Download presentation
Presentation is loading. Please wait.

1
by Mr. Zay, Mr. Ouan, Ms. Sandar, Ms. Lai 21July 2011

2
Location Vientiane Vientiane is the capital of Lao PDR, which located in central of Laos an essential economic zone central of education(many colleges, school, NUOL) more modern city than other, have many hotels, apartments (small room)… there are a lot of SMEs who do furniture business good infrastructure transportation and logistic
 more modern city than other, have many hotels, apartments (small room)… there are a lot of SMEs who do furniture business good infrastructure transportation and logistic")
3
Client Products and Services Bed room Furniture Living room Furniture Dining room Furniture Repair and maintenance service Etc…….

4
Mission and Vision - Produce Modern furniture in new life style - Make for people who need small space furniture - To know, trust and use our products

5
Objectives - To produce small scale furniture - To know our product’s good design and compactable - To export worldwide who needed our products - To service after sale and researching for more comfortable design

6
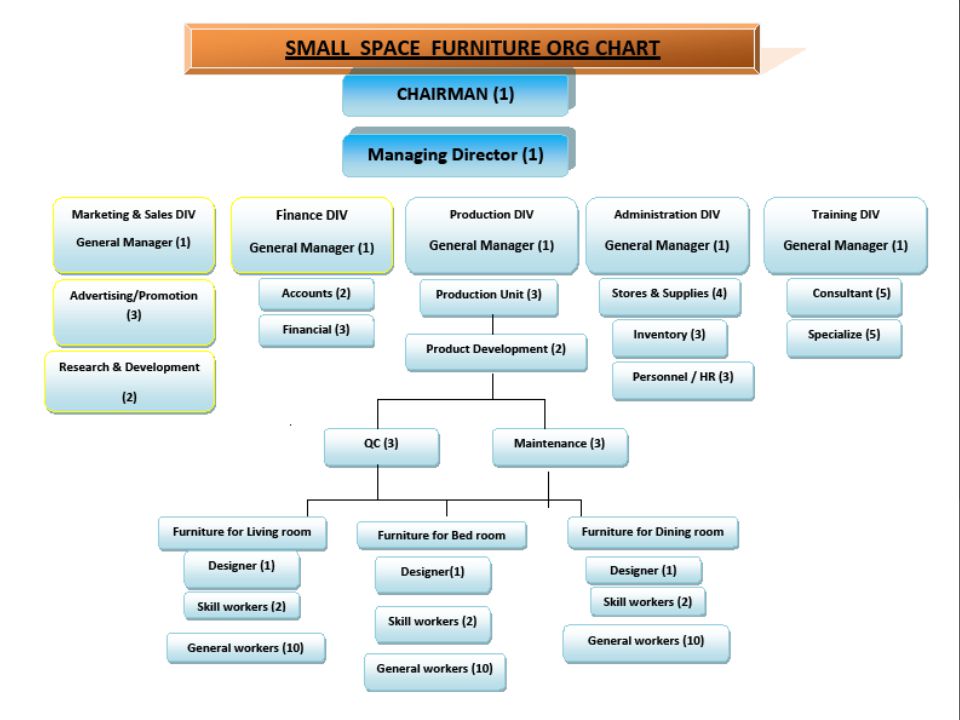
Cluster Profile Location : Vientiane, Laos PDR. Total Investment : 90 millions us dollars Area : 1.2 Hectars Clusters : 48 Nos. 2 nos. for Klin Drying 2 nos. for Hardware and metal 21 for woodworking(furniture for dining room,living room,bed room) 5 for hosting 5 for design 10 for finishing 3 for repair and maintenance Aggregate Employment : 2800 nos.
 5 for hosting 5 for design 10 for finishing 3 for repair and maintenance Aggregate Employment : 2800 nos..")
9
Products / ServiceAreas Allocated / sq.m AmountPrice SMEs - 48 X 100 m 2 48003001440000 Parking area50015075000 Security10030030000 Conference25030075000 Maintenance300 90000 Design20030060000 Quality control10030030000 Sport & Canteen20030060000 Storage600300180000 Social affair20030060000 Training centre300 90000 Fire station10030030000 Health care10030030000 Showroom25030075000 Recreation centre10030030000 Road40020080000 Wall44010044000 TOTAL 8940 m 2 2479000

10
Cutting Machine (wood) 15 X 100015000 Polishing 15 X 100015000 Cutting Machine (steel) 15 X 200030000 Welding Machine (steel) 15 X 200030000 Welding Machine (spot) 10 X 100010000 Gas Cutter 10 X 100010000 Drilling Machine 30 X 100030000 Screw Machine 30 X 100030000 TOTAL370000 Engineering Cost - 200000(Design,Architech,etc…..) Machinery & Equipment
 15 X Polishing 15 X Cutting Machine (steel) 15 X Welding Machine (steel) 15 X Welding Machine (spot) 10 X Gas Cutter 10 X Drilling Machine 30 X Screw Machine 30 X TOTAL Engineering Cost (Design,Architech,etc…..) Machinery & Equipment")
13
Marketing analysis Product market is already exist in Laos. We have to try to export foreign countries such as China, Japan,Thailand,E.U and U.S.A Market Size Local market is 10% and International market is 90%. We have to use business machinery and trade fair for marketing. Revenues and profitability is as follow in Financial statement. Competitors Direct competitors are rubber products, plastic products and so on. Indirect competitors are steel products producer, constructors. Strength Our products are made by wood, steel so it can be use more than plastic products. Our products are compact, comfort and modernized than plastics. Weakness Production cost of our products is more than plastic so our products plastic is more than plastic.

14
Marketing Strategies Direct distribution For local sale directly and export market by representative Advertising and Promotion Strategy Direct Mail using a good brochure with designs Trade Shows Advertising Internet Publicity/Public Relations Marketing and Sales Plans Incentives to sale promoter

15
BASIC FINANCIAL ASSUMPTIONS FIXED INVESTMENT EquityLoan 1. Land & Land Development24000000 2. Building, Walls, Roads, etc. Construction2479000 3. Machinery & Equipment370000 4. Office Equipment200000 5. Transport Equipment1180000 6. Others120000 PRE-OPERATING INVESTMENT 6641000 1. R&D, Engineering, Design & Other Studies200000 2. Patent Fees, Licenses & Standards27000 3. Staff Recruitment & Training27000 4. Other Development Costs20000 5. Others150000 WORKING CAPITAL 424000 DIRECT OPERATING COST 1. Raw Materials Costs400000 2. Direct Labour Costs208000 3. Cluster Overhead157000 INDIRECT OPERATING COSTS765000 1. Administration Staff Salary49400 2. Salary for Marketing Staff12350 3. Salary for Production Staff35100 4. Salary for Adm. & Finance Staff15600 5. Selling & Marketing Costs120000 6. Office Supplies12000 7. Rentals & Subcontracting10000 8.Other Expenses12000 OTHER IMPORTANT ASSUMPTIONS266450 Production Cycle (in Months)1 Percent of Working Capital Loan (in decimal)0.5 Sales for Year 12916000 Sales Growth1.1 Annual Increases in Cost Items1.1 Interest Rate (in decimal)0.08 Terms of Loans (Years)3 Cash Sales (in Decimal)0.99 Tax Rate (in Decimal)0.09 Currency:US$ Start date of LoanJan-13
1 Percent of Working Capital Loan (in decimal)0.5 Sales for Year Sales Growth1.1 Annual Increases in Cost Items1.1 Interest Rate (in decimal)0.08 Terms of Loans (Years)3 Cash Sales (in Decimal)0.99 Tax Rate (in Decimal)0.09 Currency:US$ Start date of LoanJan-13.")
16
INVESTMENT PLAN #REF! TotalEquityLoan FIXED INVESTMENT 1. Land & Land Development 2400000 0 2. Building, Walls, Roads, etc. Construction 2479000 0 3. Machinery & Equipment 370000 0 4. Office Equipment 200000 0 5. Transport Equipment 1180000 0 6. Others 12000 0 Total Fixed Investment 6641000 0 PRE-OPERATING INVESTMENT 1. R&D, Engineering, Design & Other Studies 200000 2. Patent Fees, Licenses & Standards 27000 3. Staff Recruitment & Training 27000 4. Other Development Costs 20000 5. Others 150000 Total Pre-Operating Investment (POI) 424000 TOTAL INVESTMENTS 7065000 0
 TOTAL INVESTMENTS")
17
WORKING CAPITAL DIRECT OPERATING COST 1. Raw Materials Costs400000 2. Direct Labour Costs208000 3. Cluster Overhead157000 Total Direct Operating Costs765000 INDIRECT OPERATING COSTS 1. Administration Staff Salary49400 2. Salary for Marketing Staff12350 3. Salary for Production Staff35100 4. Salary for Adm. & Finance Staff15600 5. Selling & Marketing Costs120000 6. Office Supplies12000 7. Rentals & Subcontracting10000 8.Other Expenses12000 Total Indirect Operating Costs (1)266450 TOTAL ANNUAL OPERATING COSTS 1031450 WORKING CAPITAL REQUIRED 85954.1742977.08 TOTAL PROJECT COST 7150954710797742977.08 DEBT TO EQUITY SHARE (%) 100%99%1% (1) NOTE that this Indirect Operating Costs still needs depreciation and POI amortization.
 TOTAL ANNUAL OPERATING COSTS WORKING CAPITAL REQUIRED TOTAL PROJECT COST DEBT TO EQUITY SHARE (%) 100%99%1% (1) NOTE that this Indirect Operating Costs still needs depreciation and POI amortization..")
18
PROJECTED PROFIT AND LOSS #REF! Year 1Year 2Year 3Year 4Year 5 Planned Production (in units) SALES 29160003207600352836038811964269316 DIRECT OPERATING COST 1. Raw Materials Costs400000 2. Direct Labour Costs208000 3. Cluster Overhead157000 Total Direct Operating Costs76500084150092565010182151120037 GROSS PROFIT21510002366100260271028629813149279 INDIRECT OPERATING COSTS 1. Administration Staff Salary49400 2. Salary for Marketing Staff12350 3. Salary for Production Staff35100 4. Salary for Adm. & Finance Staff15600 5. Selling & Marketing Costs120000 6. Office Supplies12000 7. Rentals & Subcontracting10000 8. Other Expenses12000
 SALES DIRECT OPERATING COST 1. Raw Materials Costs Direct Labour Costs Cluster Overhead Total Direct Operating Costs GROSS PROFIT INDIRECT OPERATING COSTS 1. Administration Staff Salary Salary for Marketing Staff Salary for Production Staff Salary for Adm. & Finance Staff Selling & Marketing Costs Office Supplies Rentals & Subcontracting Other Expenses")
19
TOT IND. OPE. COST BEF DEP’N & POI266450293095322404.5354645390109.4 9. Depreciation600300 10. POI Amortization84800 TOTAL IndiOPERATING COSTS951550978195100750510397451075209 OPERATING PROFIT11994501387905159520618232362074070 INTEREST00000 PROFIT BEFORE TAX11994501387905159520618232362074070 TAX107950.5124911.5143568.5164091.2186666.3 PROFIT10915001262994145163716591451887403 BEP44%41%39%36%34% DEPRECIATION CALCULATOR Value (Eu)Period (Yrs)Annual Dep’n 1. Building247900010247900 2. Machinery & Equipment370000574000 3. Office Equipment200000540000 4. Vehicles11800005236000 5. Others1200052400 TOTAL 600300 DEPRECIATION CALCULATOR Value (Eu)Period (Yrs)Amort. / Year 1. Pre-Operating Investment424000584800
Period (Yrs)Annual Dep’n 1. Building Machinery & Equipment Office Equipment Vehicles Others TOTAL DEPRECIATION CALCULATOR Value (Eu)Period (Yrs)Amort. / Year 1. Pre-Operating Investment")
20
PROJECTED CASH FLOW #REF! Yr. 0Yr. 1Yr. 2Yr. 3Yr. 4Yr. 5 Sales 29160003207600352836038811964269316 Cash In-Flow 1. Cash Sales 28868403175524349307638423844226622 2. Receivable 291603207635283.638811.96 3. Equity7107977 4. Fixed Investment Loan0 5. Working Capital Loan42977.08 6. Beginning Cash Balance 85954.171819068374992058691248209840 Total Cash In-Flow7150954297279450237527275072974679112475274 Cash Out-Flow 1. Total Investment7065000

21
Cash Out-Flow 1. Total Investment7065000 2. Direct Operating Costs 76500084150092565010182151120037 3. Total Ind. Ope Costs bef. Dep'n & POI 266450293095322404.5354645390109.4 4. Interest 00000 5. Tax 107950.5124911.5143568.5164091.2186666.3 Total Cash Out-Flow706500011394011259506139162315369511696812 Net Cash 85954.17183339437642465883449820984010778462 Loan Payments 1. Principal for Fixed Investment Loan 00000 2. Principal for Working Cap Loan 14325.69 00 Total Loan Payments 14325.69 00 Ending Cash Balance 85954.17181906837499205869124820984010778462

22
PROJECTED BALANCE SHEET Year 0Year 1Year 2Year 3Year 4Year 5 ASSETS CURRENT ASSETS 1. Cash85954.171819068374992058691248209840.010778462.2 2. Receivable 291603207635283.638812.042693.2 3. Inventories Total Current Assets85954.171848228378199659044078248651.910821155.3 FIXED ASSETS 1. Land & Land Development2400000 2. Building, Walls, Roads, etc. Construction2479000 3. Machinery & Equipment370000 4. Office Equipment200000 5. Vehicles1180000 6. Others12000 Total Fixed Assets6641000 6641000.0 Accumulated Depreciation 600300120060018009002401200.03001500.0 Book Value of Fixed Assets66410006040700544040048401004239800.03639500.0 POI424000 424000.0 Accumulated POI 84800169600254400339200.0424000.0 Book Value of POI42400033920025440016960084800.00.0 TOTAL ASSETS7150954822812894767961091410712573251.914460655.3

23
LIABILITIES & EQUITY CURRENT LIABILITIES 1. Account Payable 2. Working Capital Loan42977.0828651.3914325.69-3.6E-120.0 Total Current Liabilities42977.0828651.3914325.69-3.6E-120.0 LONG TERM LIABILITIES 1. Fixed Investment Loan00000.0 Total Long Term Liabilities00000.0 3. EQUITY 1. Owner’s Equity7107977 7107977.1 109150023544933806130.15465274.9 3. Current Profit 1091500126299414516371659144.81887403.4 Total Equity7107977819947794624701091410712573251.914460655.3 TOTAL LIABILITIES & EQUITY7150954822812894767961091410712573251.914460655.3 ROA= (Profit/Total Assets)x100% 13.3 13.213.1 CHECK00000.0
x100% CHECK")
24
Conclusions and Recommendations Conclusion - As mention above: now market need a lot of SSF - cluster has enough advantages to be able to remain competitive. Now we are ready to produce SSF Recommendation - Government should provide: tax credits, innovative financing for furnishings manufacturers, investments in furniture research and development and job training to enhance the skills of legacy manufacturing workers - government could provide grants for researching innovation in furniture manufacturing.

25
Thank you so much for your attention

Similar presentations


>")


 OPERATING INCOME (EBIT) - Interest.>")


