Download presentation
Presentation is loading. Please wait.

1
SUCCESSION IN MINED COASTAL SAND DUNES THE ROLE OF COLLEMBOLA AS BIO-INDICATORS

2
SOIL FAUNA Collembolan and oribatid species diversity and communities structure are the most sensitive mesofaunal parameters to evaluate the soil restoration (Andrés & Mateos, 2006). Frequently exceedingly abundant in soil and litter, are among the most important consumers, under some conditions the soil consists largely in collembolan fecal pellets (Daly et al., 1998).
..")
3
TRADITIONAL CLASSIFICATION FOR COLLEMBOLA Hexapoda= Entognatha (Ellipura+Diplura) +Ectognatha (Archeognatha+Dicondylia). Ellipura Börner (1910)= Collembola+Protura CollembolaProturaDipluraInsecta Hexapoda Ellipura
= Collembola+Protura CollembolaProturaDipluraInsecta Hexapoda Ellipura.")
4
COLLEMBOLA Diversity (more than 7500 species, 600 genera, 30 families). Wind-borne, world wide distributed from glaciers in high mountains to dry desert.

5
COLLEMBOLA

6
BIOINDICATORS Collembola were linked to pH, nutrient content or organic matter, soil chemical parameters that characterize humus type (Cassagne et al., 2003). Soil and litter arthropods, such as Collembola, are considered to be useful bioindicators of changes in soil quality (Huhta et al. 1967; Hole 1981; Detsis et al. 2000; Cassagne et al., 2003).
..")
7
ENDEMIC SPECIES

8
Endemic biota are usually more affected than non-endemic biota by artificial disturbance; the restricted distribution of endemic taxa attests in itself to the level of this sensitivity, which prevents them from crossing ecological barriers unimportant for non-endemic biota (Deharveng, 1995).
.")
9
ENDEMIC SPECIES Deharveng, 1995

10
OBJECTIVES Make the first survey of Collembola in Brazilian northeastern “restinga” (salt marsh), and identify endemic and new species. Evaluate the effects of the composition of the vegetation in reforested mined sand dunes, on the Collembola diversity. Use the Collembola diversity as indicator of soil and litter quality.

11
SAMPLING METHODS The Collembola samples were taken from the discards of the Malaise traps. Reforested areas with 2, 4, 8 and 16 years, and a native area, were sampled. Each area was subdivided into 3 parcels (A, B and C). One Malaise was left in each parcel during a week both in dry and rainy seasons. Total of 15 samples/season.
. One Malaise was left in each parcel during a week both in dry and rainy seasons. Total of 15 samples/season..")
12
SAMPLING METHODS The Collembola were separated and counted from the alcohol after the insects were removed from the collection bottles. A series of each noticed morphospecies was mounted in slides to the identification under optic microscope. The results were tabulated in excel for the statistic analysis.

13
COMPARATIVE METHODS The Collector curve was plotted, to estimate the completeness of the sampling for Collembola. The numbers of individuals and species of Collembola were correlated with the composition of the vegetation and age of areas. The similarity index of Morisita-Horn was used to plot dendograms of linkage distances.

14
COMPARATIVE METHODS The estimated richness of species of Collembola was plotted against the age of the areas. The total richness was plotted against the age of the areas. The diversity index of Shannon was estimated to the different areas and plotted for comparison.

15
RESULTS Distribution of the species of Collembola at the study sites. 24 species, 14 genera, 10 families. Species 2 years4 years8 years16 yearscontrol Seira sp.n. 1-XX-- Seira brasiliana--X-- Seira mirianae----X Seira prodiga--XXX Seira xinguensis-XXXX Seira sp.n. 3XXXXX Seira sp.n. 4---X- Seira sp. n. 5----X Calx sp. 2---X- Entomobrya sp. 6---X- Lepidocyrtus finus---XX Lepidocyrtus sp. 7----X Cryptopygus thermophilus----X Pseudachorutes sp. 11----X Brachystomella parvula---XX Xenylla sp. 12----X Sphaeridia sp. 13---XX Sphyrotheca sp. 14----X Prorastriopes sp. 15-X--X Rastriopes sp. 16-XXXX Sminthurinus latimaculosus--X-X Sminthurinus sp.n. 8----X Dicyrtoma sp. 9---XX Dicyrtoma sp. 10----X

16
COLLECTOR CURVE

17
VARIABLES VARIABLES OF FLORA AND COLLEMBOLA AreaParcel Average number of trees Average number of species of trees Average of the biggest diameter of the crowns (m) Average of the smallest diameter of the crowns (m) Litter height (cm) number of individuals of Collembola per parcel number of species of Collembola per parcel 2 years2A7,521,51,2411081 2 years2B811,1850,99100 2 years2C420,5150,361,0500 4 years4A124,52,6052,0351,551653 4 years4B1942,121,741,64482 4 years4C7,531,5951,4051,05343 8 years8A15,55,52,9952,45 4004 8 years8B134,53,082,5452,055485 8 years8C11,56,53,292,6851,719895 16 years16A16,57,54,0453,27564795 16 years16B1974,63,774,5233 16 years16C1855,1553,6954,1534057 CONTROLconA24112,8852,183,35246010 CONTROLconB4611,52,0351,5833806 CONTROLconC29,5113,152,393,35174416
 Average of the smallest diameter of the crowns (m) Litter height (cm) number of individuals of Collembola per parcel number of species of Collembola per parcel 2 years2A7,521,51, years2B811,1850, years2C420,5150,361, years4A124,52,6052,0351, years4B1942,121,741, years4C7,531,5951,4051, years8A15,55,52,9952, years8B134,53,082,5452, years8C11,56,53,292,6851, years16A16,57,54,0453, years16B1974,63,774, years16C1855,1553,6954, CONTROLconA24112,8852,183, CONTROLconB4611,52,0351, CONTROLconC29,5113,152,393,")
18
CORRELATION ANALYSIS N/ind/Coll/parc, number of individuals of Collembola per parcel; N/sp/Coll/parc, number of species of Collembola per parcel. Variable pairsR Spearmanp Area N/ind/Coll/parc0,6443180,009522 N/sp/Coll/parc0,912970,000002 Parcel N/ind/Coll/parc0,6416450,009924 N/sp/Coll/parc0,9127210,000002 Average number of trees N/ind/Coll/parc0,5192480,047303 N/sp/Coll/parc0,7105640,002988 Average number of species of trees N/ind/Coll/parc0,5743740,025131 N/sp/Coll/parc0,845680,000071 Average of the biggest diameter of the crowns (m) N/ind/Coll/parc0,6630920,007049 N/sp/Coll/parc0,6534870,008242 Average of the smallest diameter of the crowns (m) N/ind/Coll/parc0,6023240,017493 N/sp/Coll/parc0,5850780,021955 Litter height (cm) N/ind/Coll/parc0,5734780,025412 N/sp/Coll/parc0,7418880,001543
 N/ind/Coll/parc0, , N/sp/Coll/parc0, , Average of the smallest diameter of the crowns (m) N/ind/Coll/parc0, , N/sp/Coll/parc0, , Litter height (cm) N/ind/Coll/parc0, , N/sp/Coll/parc0, ,")
19
CORRELATION ANALYSIS Both, the number of species and the number of individuals, are sensitive to the age of the reforestation, to the species composition of the local flora, the shade projected by the tree cover and the height of the leaf litter.

20
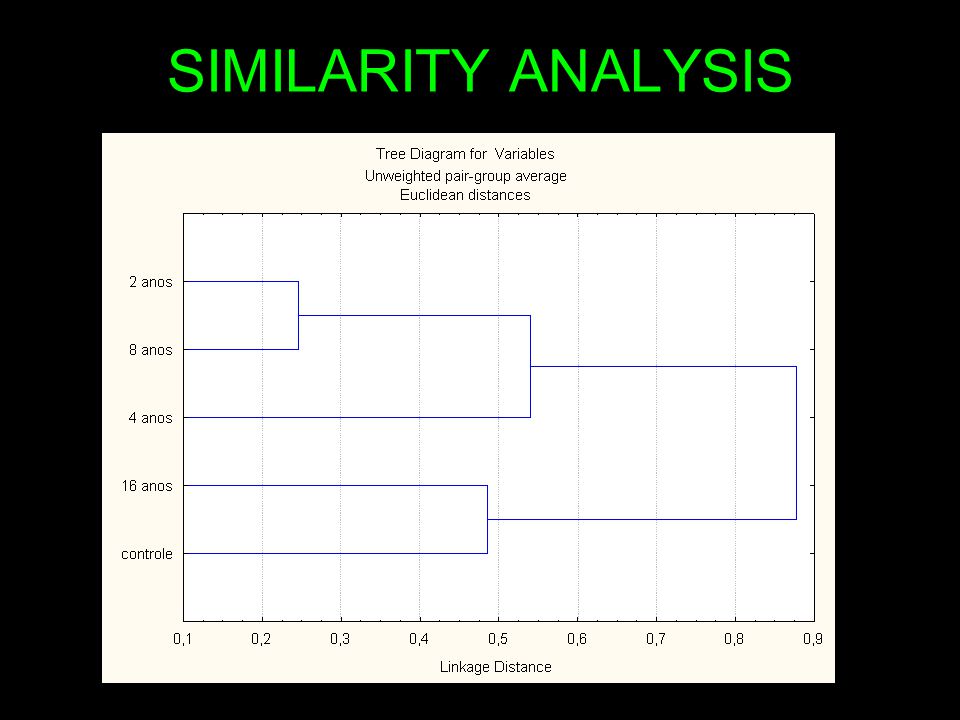
SIMILARITY ANALYSIS

23
The areas with 2, 4 and 8 years seems to be more similar to each other, than they are to areas with 16 years and control. The area with 8 years seems to be more related to the area with 2 years than it is to the area with 4 years.

24
ESTIMATED RICHNESS

25
TOTAL RICHNESS

26
SOBS !!!! RIQUEZA

27
RICHNESS The species richness of Collembola is sensitive to the age of the reforestation, the areas with 16 years and control are significantly different from the remaining areas. The overlapping distribution of the richness of the areas with 2, 4 and 8 years indicates that they are not significantly different.

28
UNIQUENESS (endemism?) It is impossible to determine endemic species at this point of the work, but the distribution of the species in the different areas present an interesting pattern, that partially reproduces the Deharveng’s 1995 findings.
 It is impossible to determine endemic species at this point of the work, but the distribution of the species in the different areas present an interesting pattern, that partially reproduces the Deharveng’s 1995 findings.")
29
UNIQUENESS (endemism?) REFORESTED DUNES IN MATARACA, PB, LYONDELL CORP.
 REFORESTED DUNES IN MATARACA, PB, LYONDELL CORP.")
30
SHANNON DIVERSITY INDEX

31
The estimated diversity index shows that the planted area with 4 years is more heterogeneous than the area with 8 years, and the area with 16 years is more heterogeneous than the control, it is likely to be an effect of the plantation species used in the area 8 years and the collector curve in the control.

32
CONCLUSIONS The Collembola diversity is sensitive to the age of the reforestation and the species composition of the flora. The “unique” species seems to respond strongly to the age of the reforestation (16 species from a total of 24 if considered the 16 years and control together). The diversity of Collembola can be recovered with appropriate reforestation techniques, but it takes a long time.
. The diversity of Collembola can be recovered with appropriate reforestation techniques, but it takes a long time..")
33
THANK YOU VERY MUCH! I acknowledge to M.Sc. Valderez !!! For providing the floristic data, to Malva Hernandez and Helder !!! For the help with the statistic analyses.

Similar presentations

, Marybeth Hanley, Keith Killingbeck (URI) Interdunal seasonal wetlands, also known.>")


 Liu (Michigan.>")


