Download presentation
Presentation is loading. Please wait.

1
Does The Gradient Matter? Further Understanding the Intergenerational Transmission of Human Capital December 2006 PRELIMINARY DRAFT ---- PLEASE DO NOT CITE George JakubsonAndré Portela Souza

2
What are we doing here? This paper investigates the relationship between the educational attainment of parents and children in a developing country context and evaluates the importance of the gradients.

3
Questions: (i) Is there a causal effect in the intergenerational transmission of human capital? (ii) if yes, does the gradient matter? That is, are there decreasing marginal effects of parent’s schooling? (iii) do these effects differ across genders? That is, do mothers and fathers affect sons and daughters differently?
 if yes, does the gradient matter. That is, are there decreasing marginal effects of parent’s schooling. (iii) do these effects differ across genders. That is, do mothers and fathers affect sons and daughters differently .")
4
Data The data set is the 1996 Brazilian Annual Household Survey from the Brazilian Census Bureau (PNAD/IBGE). This study makes use of a sample of husbands and wives with information on their final educational attainment as well as information on the schooling levels of their parents.

5
Method We use Generalized Method of Moments (GMM) techniques to estimate structural empirical models that control for unobservable characteristics. We compare those results to those from OLS and SUR estimations.

6
The Trick Parent education can affect child education both structurally and through a common taste component. If there is positive assortative mating, child’s education should be correlated with the education of his or her in-laws through that taste component.

7
The Trick (cont) Use information on the schooling of the spouse’s parents to “control for” the taste component in the context of a statistical model The statistical model to do this is overidentified, hence rejectable.
 Use information on the schooling of the spouse’s parents to control for the taste component in the context of a statistical model The statistical model to do this is overidentified, hence rejectable.")
8
Overview of Results Even after controlling for individual and family unobservable characteristics, there is still a strong effect of parent’s schooling on the schooling levels of their sons and daughters

9
Overview of Results (cont) OLS and SUR estimates –biased upward –After controlling for individual and family unobservable attributes, the intergenerational impact is three to four times smaller The effect of parent's schooling on children's schooling appears to exhibit diminishing returns over a range of schooling levels
 OLS and SUR estimates –biased upward –After controlling for individual and family unobservable attributes, the intergenerational impact is three to four times smaller The effect of parent s schooling on children s schooling appears to exhibit diminishing returns over a range of schooling levels")
10
Overview of Results (cont) fathers have stronger impacts on sons than on daughters mothers have stronger effects on daughters than on sons
 fathers have stronger impacts on sons than on daughters mothers have stronger effects on daughters than on sons")
11
The Data PNAD –1996 Pesquisa Nacional por Amostragem a Domicílio (PNAD) –Instituto Brasileiro de Geografia e Estatística (IBGE), the Brazilian census bureau –yearly and nationally representative household survey (excepting the rural Amazon region) similar to the Current Population Survey in the U.S.
 –Instituto Brasileiro de Geografia e Estatística (IBGE), the Brazilian census bureau –yearly and nationally representative household survey (excepting the rural Amazon region) similar to the Current Population Survey in the U.S.")
12
The Data (cont) close to one hundred thousand households information on the demographic and labor market characteristics of the households 1996 survey obtains retrospective information from the household head and the spouse about the educational attainment of their parents.
 close to one hundred thousand households information on the demographic and labor market characteristics of the households 1996 survey obtains retrospective information from the household head and the spouse about the educational attainment of their parents.")
13
The Data (cont) information of complete education of two consecutive generations link the parents’ education to the sons and daughters’ education at a point in time when the sons and daughters are no longer in the midst of their formal education covers Brazilian generations with low levels of average schooling and higher variance of schooling in comparison to more developed countries
 information of complete education of two consecutive generations link the parents’ education to the sons and daughters’ education at a point in time when the sons and daughters are no longer in the midst of their formal education covers Brazilian generations with low levels of average schooling and higher variance of schooling in comparison to more developed countries")
14
The Sample all individuals aged 25 to 97 years old that are household head or spouse living in households where there are head and spouse A male head or spouse is considered the husband and a female head or spouse is considered wife Since we need the education information of the parents we restrict the sample to heads and spouses

15
The Sample (cont) since we will explore the correlation of the parents’ education and in-laws’ education, we further restrict the sample to households with heads and spouses. Thus households with no spouses are automatically excluded from the sample. 28% are single head households (and thus excluded) the sample is further restricted to husbands and wives with valid information on their education attainment, gender, race/color, and their parent’s education attainment
 the sample is further restricted to husbands and wives with valid information on their education attainment, gender, race/color, and their parent’s education attainment.")
17
The Sample (cont) The greatest decrease in the sample size is due to the existence of no information on parents’ education. Most of the unknown information of parents’ education is due to the fact that some heads and spouses declared they did not know their father or mother final education attainment. A closer inspection of those that declared they did not know their parents’ education showed that they are in general illiterate or lower educated.

18
The Sample (cont) We have not modeled this sample selection process. We think (hope?) that the selection bias goes against us. If the low schooling kids who don’t report parents’ schooling had college educated parents then we’d be in trouble. Given the correlations in schooling that we see this seems unlikely.
 that the selection bias goes against us. If the low schooling kids who don’t report parents’ schooling had college educated parents then we’d be in trouble. Given the correlations in schooling that we see this seems unlikely..")
19
The Sample (cont) the final sample may over-represent the more educated Since there is a steady expansion of education attainment across generations in Brazil, it is likely that the final sample is more homogenous in education than otherwise. Thus, the positive relationship between parents’ education and sons and daughters’ education is likely to be steeper than the one observed in this sample.

21
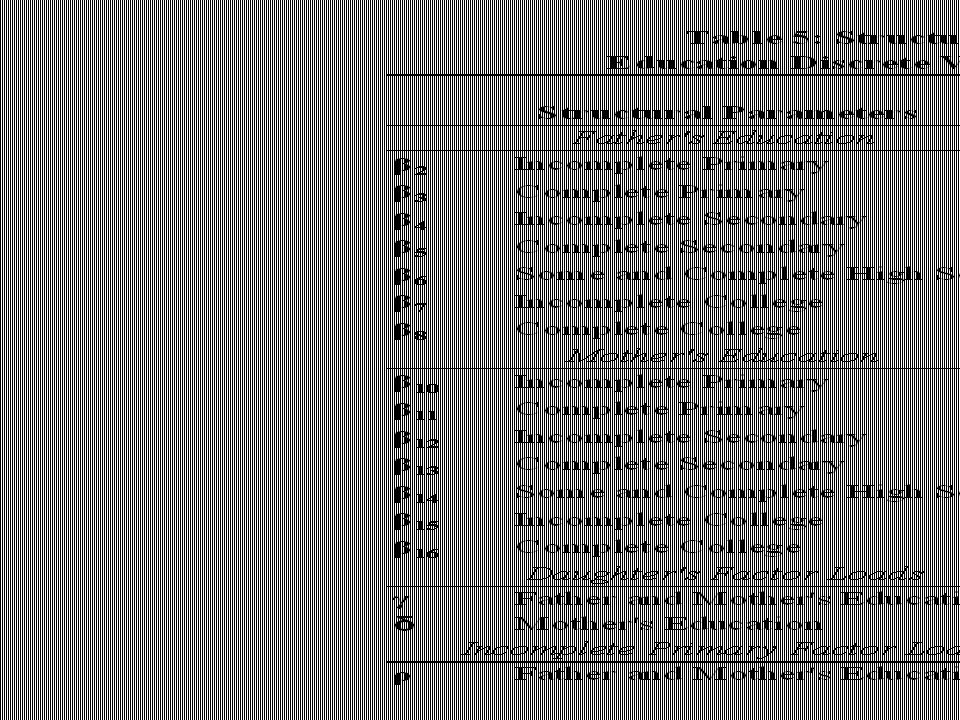
Stylized Facts Table 1 shows –the education attainment distributions of husbands, wives, and their respective parents’ education. –It also presents the education transition matrices from parents to sons and daughters

22
Stylized Facts (cont) –the education attainments are classified into four categories according to the Brazilian educational system. complete primary education (0 to 4 years of schooling) some or completed secondary (5 to 8) some or completed high school (9 to 11) some college or above (12 or above)
 some or completed secondary (5 to 8) some or completed high school (9 to 11) some college or above (12 or above).")
24
Table 1 The first row of Table 1 shows the education distribution of sons and daughters, separately. The first column of Table 1 presents the education distribution of fathers and mothers, respectively.

25
Table 1 (cont) An inspection of all the four transition matrices reveals clearly that sons and daughters of lower educated parents are more likely to be less educated in comparison of sons and daughters of more educated parents. The results are marked if one compares the sons and daughters of primary educated parents to sons and daughters of college educated parents. the parents’ education is a good predictor to the sons and daughters’ education in Brazil low intergenerational education mobility in Brazil

26
Assortative Mating? Table 2 shows the cross-tabulations of the education attainment between –husbands and wives, –fathers’ husbands and mothers’ husbands –fathers’ wives and mothers’ wives –each cell in the cross-tabulation the overall percentage the row percentage the column percentage

30
Assortative Mating? there is a positive assortative matching process where higher educated husbands marry higher educated wives and lower educated husbands marry lower educated wives. Qualitatively similar patterns are encountered in the other two cross- tabulations.

31
Does our trick stand a chance? Finally, if parents’ education is strongly associated with their sons and daughters’ education, and if husbands and wives’ education are strongly associated to each other, it is likely that the husbands’ parent’s education be positively associated with the wives’ parent’s education.

34
strong positive association of their education levels. For instance, of all husband and wife couples, 82.2 (83.9) percent have both their fathers (mothers) primary educated. So, we’ve got a chance…
 percent have both their fathers (mothers) primary educated. So, we’ve got a chance….")
35
OLS and GLS, pre-trick Table 4 presents the results for both OLS and SUR regressions. dependent variables are the years of schooling completed by the husbands (sons) and wives (daughters) The second and fourth columns of Table 4 show the OLS coefficients for husbands and wives, respectively. The sixth and eighth columns present the SUR coefficients for husbands and wives, respectively.
 and wives (daughters) The second and fourth columns of Table 4 show the OLS coefficients for husbands and wives, respectively. The sixth and eighth columns present the SUR coefficients for husbands and wives, respectively..")
36
The results exhibit the expected patterns. First, there is a strong positive association between parents’ education and sons and daughters’ education. Second, the older generations have lower education attainment than younger ones. Third, non-white individuals have lower schooling than white individuals.

37
Fourth, father’s (mother’s) education point estimates are greater for sons (daughters) than for daughters (sons) in both OLS n SUR regressions. Finally, SUR point estimates are lower than OLS point estimates.

39
The Structural Model

40
Allowing for gender match effects

41
If we just had a single schooling variable this would be a 1:1 reparameterization and hence not rejectable However, we specify schooling as a series of indicators of levels, and hence we have a rejectable set of proportionality restrictions

42
One more thing … We allow the proportionality restriction between the husband’s and wife’s equations to be different for the lowest schooling level (incomplete primary) That factor loading we call ρ Results not sensitive to setting it to unity, but fits data better with ρ free
 That factor loading we call ρ Results not sensitive to setting it to unity, but fits data better with ρ free")
43
Reduced form: Structure: Consistent Estimators, etc:

44
Minimum Distance:

54
So, what do you think??

55
What is to be done? Add the third generation. Schooling still in progress here, so we need to be careful Missing data –Model as selection? –Multiple imputation?

Similar presentations


>")

 Zeng Yi and Zhenglian.>")


 per capita and the.>")


 and dependant (Y) variables.>")


