Download presentation
Presentation is loading. Please wait.

1
December 2011 M R Tiwari M.Sc-TQM

2
Laboratory test results (Good laboratory practice, GLP) Clinical diagnosis Patient management
 Clinical diagnosis Patient management")
3
Quality can be assured at ◦ Pre-analytical stage ◦ Analytical stage ◦ Post-analytical stage

6
Patient’ case no. / Name:______________________________________________ Date of Birth/Age:____________________________________________________ Sex: _______________________________________________________________ Patient’ case no. / Name:______________________________________________ Date of Birth/Age:____________________________________________________ Sex: _______________________________________________________________ Referring Doctor’ name:_______________________________________________ Address (OPD/WARD/Unit):___________________________________________________ __________________________________________________________________ Referring Doctor’ name:_______________________________________________ Address (OPD/WARD/Unit):___________________________________________________ __________________________________________________________________ Primary Sample Type: Blood/Fluid/Sputum/Stool/Microbiological Specimen/Slides/Tissue/_________________________________________________ (Any other specify) Date and Time of Primary Sample Collection: ___________________________________________________________________________________________________ Date and Time of Receipt of Primary Sample by the Laboratory: ____________________________________________________________________________________ Primary Sample Type: Blood/Fluid/Sputum/Stool/Microbiological Specimen/Slides/Tissue/_________________________________________________ (Any other specify) Date and Time of Primary Sample Collection: ___________________________________________________________________________________________________ Date and Time of Receipt of Primary Sample by the Laboratory: ____________________________________________________________________________________ Clinical History of the patient: ________________________________________________________________ ________________________________________________________________ Clinical History of the patient: ________________________________________________________________ ________________________________________________________________ Treatment History of Patient: __________________________________________________________________ __________________________________________________________________ Treatment History of Patient: __________________________________________________________________ __________________________________________________________________ Examinations Requested Requisition number 1. 2. 3. 4. 5. Examinations Requested Requisition number 1. 2. 3. 4. 5. Requisition form Reference: Clause 5.4 (ISO 15189) Signature ______________ Name of the organization Complete address/telephone no./fax no./e mail/website Name of the organization Complete address/telephone no./fax no./e mail/website
:___________________________________________________ __________________________________________________________________ Referring Doctor’ name:_______________________________________________ Address (OPD/WARD/Unit):___________________________________________________ __________________________________________________________________ Primary Sample Type: Blood/Fluid/Sputum/Stool/Microbiological Specimen/Slides/Tissue/_________________________________________________ (Any other specify) Date and Time of Primary Sample Collection: ___________________________________________________________________________________________________ Date and Time of Receipt of Primary Sample by the Laboratory: ____________________________________________________________________________________ Primary Sample Type: Blood/Fluid/Sputum/Stool/Microbiological Specimen/Slides/Tissue/_________________________________________________ (Any other specify) Date and Time of Primary Sample Collection: ___________________________________________________________________________________________________ Date and Time of Receipt of Primary Sample by the Laboratory: ____________________________________________________________________________________ Clinical History of the patient: ________________________________________________________________ ________________________________________________________________ Clinical History of the patient: ________________________________________________________________ ________________________________________________________________ Treatment History of Patient: __________________________________________________________________ __________________________________________________________________ Treatment History of Patient: __________________________________________________________________ __________________________________________________________________ Examinations Requested Requisition number Examinations Requested Requisition number Requisition form Reference: Clause 5.4 (ISO 15189) Signature ______________ Name of the organization Complete address/telephone no./fax no./e mail/website Name of the organization Complete address/telephone no./fax no./e mail/website.")
7
Sample collection

9
Stress and exercise ◦ Increases cell concentrations ◦ Increases coagulation factors (VIII) & also tissue plasminogen activator (t-PA) with increased fibrinolytic activity (2-4). Reference: (2) Standardization of blood specimen collection procedure for reference values. Clin Lab Haematol 4:83- 86, 1982. (3) Van Assendelft OW, Simmons A. Specimen collection, handling, storage and variability, in Lewis SM, Koepke JA (eds): Hematology Laboratory Management and Practice. Oxford, Butterworth Heinemann, 1995, p 109-127. (4) Dacie JV, Lewis SM. Practical Haematology, 8th ed. Edinburgh, Churchill Livingstone, 1995, p 9-19.
 Standardization of blood specimen collection procedure for reference values. Clin Lab Haematol 4:83- 86, (3) Van Assendelft OW, Simmons A. Specimen collection, handling, storage and variability, in Lewis SM, Koepke JA (eds): Hematology Laboratory Management and Practice. Oxford, Butterworth Heinemann, 1995, p (4) Dacie JV, Lewis SM. Practical Haematology, 8th ed. Edinburgh, Churchill Livingstone, 1995, p")
10
Prolonged use of a tourniquet ◦ haemoconcentration; the patient’s posture (standing, sitting or lying) and even the position of the arm during venous sampling will cause fluctuations of 5-10% in the blood count (1). Reference : (1) International Committee for Standardization in Hematology.
 International Committee for Standardization in Hematology..")
11
K 3 EDTAK 2 EDTA Causes significant shrinking of the red cells with a decrease of 1-2% in the MCV.. K 2 EDTA in a concentration of 1.5- 2.2 mg/ml (4.55 ± 0.8 mmol/ml) as this cause less cellular change (5). Reference: (5) Bachmann F. Molecular aspects of plasminogen, plasminogen activators and plasmin, in Bloom AL, Forbes CD, Thomas DP, Tuddenham EGD (eds): Haemostasis and Thrombosis. Edinburgh, Churchill Livingstone, 1994, p 575-613
 as this cause less cellular change (5). Reference: (5) Bachmann F. Molecular aspects of plasminogen, plasminogen activators and plasmin, in Bloom AL, Forbes CD, Thomas DP, Tuddenham EGD (eds): Haemostasis and Thrombosis. Edinburgh, Churchill Livingstone, 1994, p")
12
Improper technique results in : ◦ Presence of microclots or platelet clumps ◦ Low platelet count reported by cell counter

13
Shortening of APTT Micro clots Prolongation of PT & APTT Excess sodium citrate consumes Ca +2 present in reagents

14
Prolongation of APTT Contact with heparin Prolongation of PT & APTT Delayed sample leads to Factors deterioration

15
Withdraw the blood slowly using 22 or 21 gauze needles Remove the needle from the syringe and deliver the blood gently into the containers Avoid vigorous mixing as it may cause foaming and hemolysis Avoid hemolysis

16
While drawing blood form indwelling lines or catheters errors due to dilution and or contamination from flushing solution should be avoided. Reference : NABL 112, Issue 02, Page 18/39

17
When an intravenous solution is being administered in a patient's arm, blood should be drawn from the opposite arm. If an intravenous infusion is running in both arms, samples may be drawn after the intravenous infusion is turned off for at least two minutes before venipuncture and applying the tourniquet below the intravenous infusion site. Reference : NABL 112, Issue 02, Page 19/39

18
Mislabeling is a serious error ◦ collection from the wrong patient ◦ subsequent specimen mix-up ◦ transcription error These can occur at any stage. It is essential to have a cross-check procedure.

19
Sample transport ◦ trays having protective covering ◦ providing suitable environment required preventing deterioration of the sample ◦ person carrying the sample should be following the universal safety norms

20
◦ Laboratory checks quantity, quality, labeling, request forms, clot presence etc.

21
Quantity not Sufficient* *Do not reject. Each sample is precious. Report with a comment.

22
Sample hemolysed / lipemic

23
Name on vaccutainer and name on the requisition form do not match X

24
Outside of container contaminated by specimen

25
Sample partially / fully clotted

26
Sample received without requisition form X

29
A feedback of this kind to the concerned ward of the hospital may enhance a positive attitude towards quality improvement at pre-analytical stage Quality Indicator Rejection analysis helps in ‘Continual improvement’

31
=

32
Definition Precision refers to the reproducibility of a result. Checking precision is required while -calibration -troubleshooting

33
Definition Closeness of a result to the true (accepted) value. NOTE You cannot have accuracy without precision. However, you can have precision without accuracy. Before determining accuracy, first determine precision.

34
This figure illustrates that the results are neither accurate nor precise.

36
In 1931, Dr. Walter Shewhart, a scientist at the Bell Telephone Laboratories, proposed applying statistical based control charts to interpret industrial manufacturing processes. In 1931, Dr. Walter Shewhart, a scientist at the Bell Telephone Laboratories, proposed applying statistical based control charts to interpret industrial manufacturing processes. In 1950, S. Levey & E.R. Jennings suggested the use in the clinical laboratory. In 1950, S. Levey & E.R. Jennings suggested the use in the clinical laboratory.

37
X-axis - the days of the month (time interval) Y-axis. - control observations
 Y-axis. - control observations")
38
By using common materials Manually - arithmetic graph paper MS Excel Software in computer Quality software program e.g. MedLab QC Automated hematology analyzer inbuilt quality software program

39
By using simple statistics Mean Standard Deviation (SD) ± 1SD ± 2SD ± 3SD Coefficient of Variation (CV %) TARGET CONTROL LIMITS
 ± 1SD ± 2SD ± 3SD Coefficient of Variation (CV %) TARGET CONTROL LIMITS")
40
The mean and standard deviation of the control being used should be determined based on at least 20 measurements over 20 days. Reference: http://www.medialabinc.net/levey-jennings-keyword.aspx Or Statistical data should be determined based on >10 measurements. (In case of perishable and less quantity control material).
..")
41
First step – Calculate Target Value Mean ( ) is the sum of all the measurements (Σ) divided by the number of measurements (n) Formula = ∑ x i / n Where x i = each data point n = the number of data points in the set = Mean
 is the sum of all the measurements (Σ) divided by the number of measurements (n) Formula = ∑ x i / n Where x i = each data point n = the number of data points in the set = Mean")
42
Second step – Calculate Dispersion from target value i.e. Standard deviation (SD) SD quantifies the degree of dispersion of data points about the mean. SD is used to set limits upon which control result acceptability is determined.
 SD quantifies the degree of dispersion of data points about the mean. SD is used to set limits upon which control result acceptability is determined..")
43
Calculation Procedure No. of runs A (x i ) B (x - x i ) C (x - x i ) 2 1.List values in column A 2.Add column A, comes to 2000 3.Divide total of column A by no. of values (see mean formula), comes to 100 4.This is the average or mean value 5.In column B list the difference in values of column A from the average values of column A from the average value 100, disregard + or – signs 6.Square each value and place in column C 7.Add values in column C 8.Divide the total of column C by number of values minus 1 (see SD formula) 9.Determine the square root of 8.37 which comes to 2.89. this is the standard deviation 1 2 3 4 5 6 7 8 9 10 11 12 13 14 15 16 17 18 19 20 95 100 101 102 97 103 101 99 98 100 95 101 105 100 98 101 97 106 100 101 2000 -5 0 +1 +2 -3 +3 +1 -2 0 -5 +1 +5 0 -2 +1 -3 +6 0 +1 25 0 1 4 9 1 4 0 25 1 25 0 4 1 9 36 0 2 157 SD calculation Where, Here n = 20 Mean = 2000 / 20 = 100 SD SD =√ 157 / (20-1) SD=2.87
 B (x - x i ) C (x - x i ) 2 1.List values in column A 2.Add column A, comes to Divide total of column A by no. of values (see mean formula), comes to This is the average or mean value 5.In column B list the difference in values of column A from the average values of column A from the average value 100, disregard + or – signs 6.Square each value and place in column C 7.Add values in column C 8.Divide the total of column C by number of values minus 1 (see SD formula) 9.Determine the square root of 8.37 which comes to this is the standard deviation SD calculation Where, Here n = 20 Mean = 2000 / 20 = 100 SD SD =√ 157 / (20-1) SD=2.87.")
44
Third step – Calculate Control Limits (± 1SD, ± 2SD, ± 3SD) Upper Control Limits Lower Control Limits Mean + (3 x SD) = + 3SD Mean + (2 x SD) = + 2SD Mean + (1 x SD) = + 1SD Mean - (1 x SD) = - 1SD Mean - (2 x SD) = - 2SD Mean - (3 x SD) = - 3SD
 Upper Control Limits Lower Control Limits Mean + (3 x SD) = + 3SD Mean + (2 x SD) = + 2SD Mean + (1 x SD) = + 1SD Mean - (1 x SD) = - 1SD Mean - (2 x SD) = - 2SD Mean - (3 x SD) = - 3SD")
46
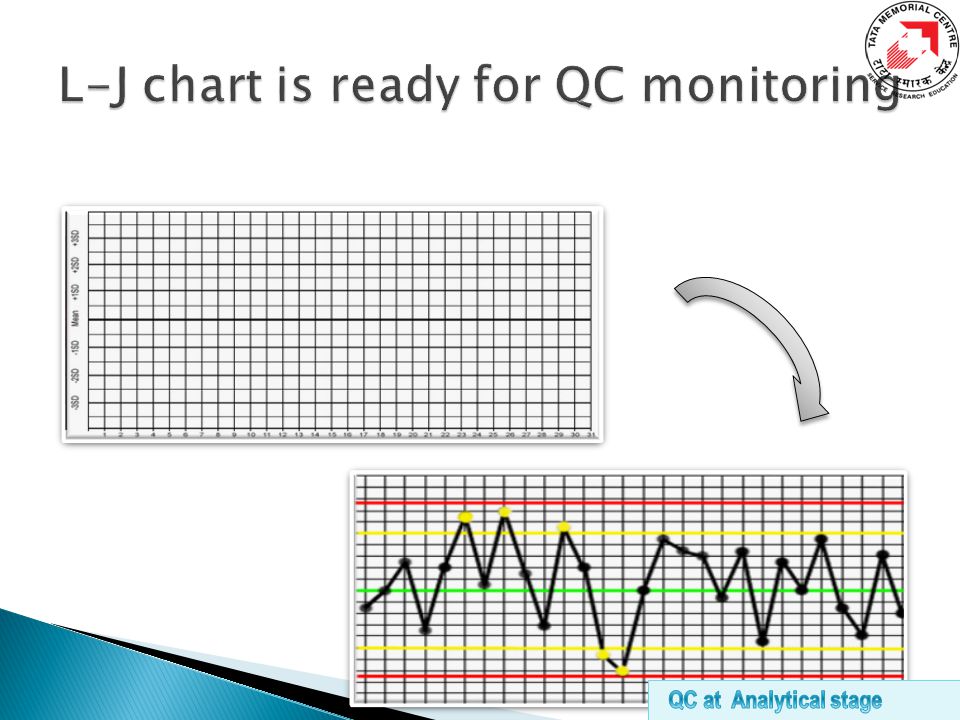
L-J chart interpretation

48
Coefficient of variation (CV %) CV is another way of indicating standard deviation, related to the actual measurement, so that variation at different levels can be compared.
 CV is another way of indicating standard deviation, related to the actual measurement, so that variation at different levels can be compared.")
49
CBC parametersAcceptable %CV WBC4.0 % RBC3.0 % Hemoglobin2.0 % MCV2.0 % Platelet9 % Improved %CV 3% 2.5% 1.0% 1.5% 7% Quality Indicator – %CV is continual improvement”

51
Hematology analyzers

52
Follow the manufacturer’s manual Perform maintenance regularly ◦ Daily ◦ Weekly ◦ Biweekly ◦ Monthly ◦ Annually ◦ As if required Maintain record of maintenance

53
Try to correct at operator level if possible or Call the service engineer for help Maintain a record of any breakdown observed ◦ Nature ◦ Time ◦ Error detected ◦ Corrective action ◦ QC checked ◦ Service report

55
Calibration Is done to standardize the instrument for accuracy. Calibrator Certified Reference Material (CRM) used to calibrate a measurement on an analyzer. Cal-Factors If any deviation from calibration references is observed necessary calibration correction factors are applied to set the accuracy of the instrument.
 used to calibrate a measurement on an analyzer. Cal-Factors If any deviation from calibration references is observed necessary calibration correction factors are applied to set the accuracy of the instrument..")
56
Pre-calibration check ◦ Total maintenance of the instrument ◦ Reagents (replenish or replace) ◦ Calibrator (Check for expiry) Calibration procedure ◦ Precision check ◦ Carryover check ◦ Calibration in both (open and closed modes) Post-calibration validation ◦ Run calibrator as samples ◦ Run 3 level controls
 ◦ Calibrator (Check for expiry) Calibration procedure ◦ Precision check ◦ Carryover check ◦ Calibration in both (open and closed modes) Post-calibration validation ◦ Run calibrator as samples ◦ Run 3 level controls")
57
Commercial controls – expensive but important ◦ Reproducibility / precision check Retained sample ◦ Reproducibility / precision check Moving averages (Bull’s algorithm)
")
58
First step Start up status and background count check (Monitor for acceptable background…..if required take corrective action) Done once QC monitoring using multilevel controls (Low level, normal level and high level) (Monitor L-J chart, apply Westergard’s interpretation, monitor %CV…..if required take corrective action) Periodic in b/w check till shut down QC monitoring using retained sample (Monitor %CV…..if required take corrective action)
 Done once QC monitoring using multilevel controls (Low level, normal level and high level) (Monitor L-J chart, apply Westergard’s interpretation, monitor %CV…..if required take corrective action) Periodic in b/w check till shut down QC monitoring using retained sample (Monitor %CV…..if required take corrective action)")
59
Warning rule = use other rules to inspect the control points Rejection rule = “out of control” ◦ Stop testing ◦ Identify and correct problem ◦ Repeat testing on patient samples and controls ◦ Do not report patient results until problem is solved and controls indicate proper performance

60
Comparative study b/w the analyzers Rerun on same analyzer in different mode Lot validation (after change of reagent) with retained sample Correlation with peripheral smears
 with retained sample Correlation with peripheral smears")
62
Normal Distribution Curve or Gaussian curve Describes events or data that occur symmetrically about the mean. Out of 100 events 68.7 will fall within ±1 SD 95.4 will fall within ± 2 SD 99.7 will fall within ±3 SD

63
A - 1A - 2A - 3A - 4A - 5A - 6A - 7A - 8A - 9A-10A-11A-12 MEAN SD WBC5.96.36.25.26.36.25.96.36.25.96.36.26.10.3 HGB13.112.912.713.112.912.713.112.912.713.112.912.712.90.2 PLT262246255262246255262246300262246255258.114.9 Z-SCOREA - 1A - 2A - 3A - 4A - 5A - 6A - 7A - 8A - 9A-10A-11A-12 WBC-0.550.700.39-2.740.700.39-0.550.700.39-0.550.700.39 HGB1.170.00-1.171.170.00-1.171.170.00-1.171.170.00-1.17 PLT0.26-0.81-0.210.26-0.81-0.210.26-0.812.820.26-0.81-0.21 Z SCORE SCALING :- < ±0.5 - Excellent performance ±0.5 to ±1.0 - Satisfactory ±1 to ±2 - Acceptable > ±2 - Defect requiring attention Z-Score

64
Check for the IQC results during the period when the EQAS sample was analyzed. Follow the instructions from the nodal organization.

66
Report Sample (post analysis) Record (retention)
 Record (retention)")
68
a Report format Reference : ISO 15189:2007 Pg 23 & 24 Clause 5.8.3 (a to n) b c d e f g h i j k l m n
 b c d e f g h i j k l m n")
69
A formal way of testing for aberrant results is known as `delta check`. The blood count parameters should not differ from recent tests in the previous 2-3 weeks by more than a certain amount. For Hb and RBCFor WBCFor Platelet count 10 %20-25 %50 % Assuming that the patient’s clinical condition has not altered significantly

71
Quality Indicator – “TAT shall be monitored on periodic basis for continual improvement” TAT BMA- 3wd Coag- 4 hrs CBC- 2hrs The requester i.e. the clinician is notified in case of delay in examination only in such cases where the delay can compromise patients care. The laboratory takes responsibility for reporting the results within the specified turn around time.

74
◦ Repeat examination ◦ Additional or further examinations

75
Color Coding Type of Container Waste Category Yellow Plastic Bag Waste from laboratory contaminated with blood and body fluids including cotton, gloves, and other contaminated material Yellow Puncture proof container Waste sharps Needles, syringes, glass; etc. that may cause puncture and cuts. Black Plastic bagPaper, stationeries and non-contaminated wastes Reference -Maharashtra Pollution Control Board

77
Reason for retention ◦ prompt retrieval of the information Retention time ◦ the length of time that reported data are retained may vary as long as medically relevant.

78
QualityGood Laboratory Practice ◦ Pre-analytical stage ◦ Analytical stage ◦ Post-analytical stage Laboratory test results Clinical diagnosis Patient management

Similar presentations


 are.>")


. You can freely download,>")


