Download presentation
Presentation is loading. Please wait.

1
SOCIO-ECONOMIC DATA FOR WNDD Presentation by: Tom Harris and Buddy Borden Buddy Borden

2
Understanding WNDD Regional Strengths and Weaknesses Understanding Strengths and Weaknesses was a crucial piece of a successful region as defined in Module 2 in March in Carson City. (SET Facilitators Guidebook Page 2.29).
..")
3
QUESTIONS TO BE DISCUSSED TODAY What are the current socio-economic conditions in WNDD? What components of the WNDD demographics and economy are growing or declining? What options exist for improving demographics and economic conditions in WNDD, and what options should we pursue first?

4
Silicon Valley Index Measures for Success Successful region can measures its success by: 1.Population Change 2.Educational Attainment 3.Employment 4.Occupational Skills (Source for 1 to 3: Index of Silicon Valley, Silicon Valley Community Foundation/Joint Venture Silicon Valley Network: San Jose, CA, 2011: P. 14. Accessed July 5, 2012 at: http://www.siliconvalleycf.org/docs/joint- venture/2011-jv-index.pdf )http://www.siliconvalleycf.org/docs/joint- venture/2011-jv-index.pdf
 venture/2011-jv-index.pdf.")
5
Why Are There Changes in Proportional Share in Goods-Producing and Service-Producing Industries? Increased Efficiencies Increased Personal Income and Changes in Demand Changes in World Economy

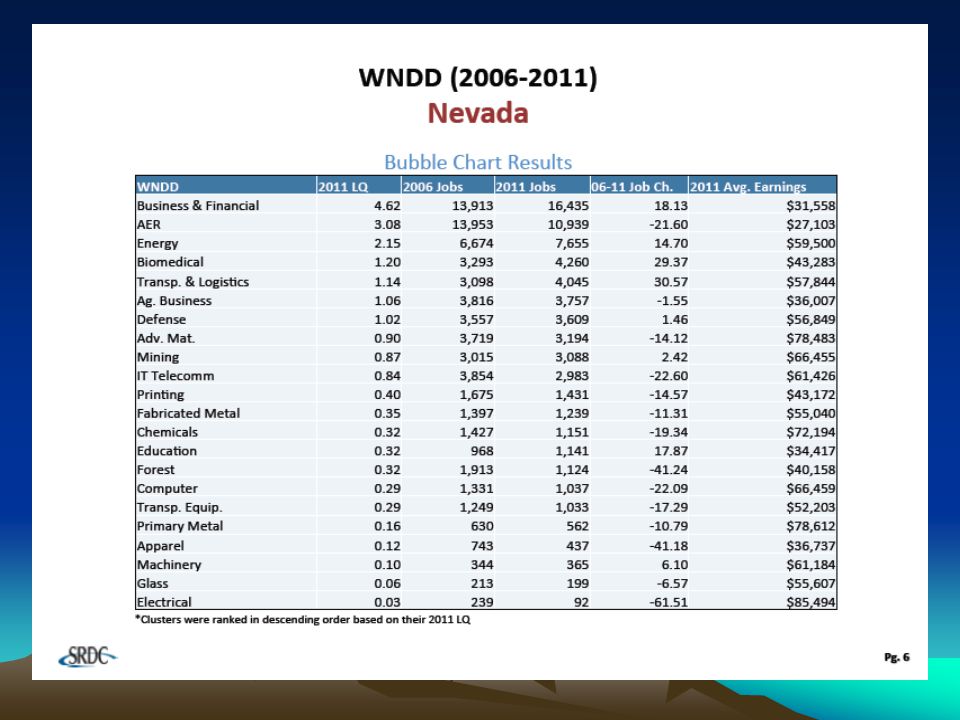
6
Proportionate Shares of Sources of Income for the U.S., State of Nevada, and WNDD from 1969 to 2010

7
County Population, Rank of Population and Change in Population Rank, WNDD and State of Nevada, 2000 to 2010 County20002010Change in Rank PopulationRankPopulationRank Clark1,375,76511,951,26910 Washoe339,4862421,40720 Carson City52,457355,27430 Elko45,291448,8185 Douglas41,259546,9976 Lyon34,501651,9804+2 Nye32,485743,94670 Churchill23,982824,87780 Humboldt16,106916,52890 White Pine9,1811010,030100 Pershing6,693116,753110 Lander5,794125,775120 Mineral5,071134,77214 Lincoln4,165145,34513+1 Storey3,399154,010150 Eureka1,651161,987160 Esmeralda97117783170 WNDD183,468 211,191 WNDD Plus Washoe522,954 632,598 TOTAL1,998,257 2,700,551

8
Population by Age and Proportionate Share of Population by Age, Western Nevada Development District, 2000 and 2010. 20002010 Age GroupNumber Proportionate shareNumberProportionate share Under 511,7356.40%12,6245.98% 5 to 913,0697.12%12,9376.13% 10 to 1414,0917.68%13,5966.44% 15 to 1912,4326.78%13,5926.44% 20 to 248,7064.75%10,9355.18% 25 to 3421,88711.93%23,32911.05% 35 to 4429,93916.32%25,55712.10% 45 to 5427,15614.80%32,79215.53% 55 to 6419,56710.67%30,84014.60% 65 to 7414,2947.79%20,8269.86% 75 to 848,4804.62%10,5505.00% 85 and above2,1121.15%3,6131.71% 65 and above 13.56%16.57% TOTAL183,468100.00%211,191100.00%

9
Trends in Population by Race, Western Nevada Development District, 2000 and 2010 20002010 RaceNumber Proportionat e Share Number Proportionate Share Percentage Change 2000 to 2010 White158,92986.65%177,24483.93%+11.52% Black or African- American2,3751.29%2,6431.25%+11.28% American Indian or Alaska native5,6453.08%6,3323.00%+12.17% Asian & Pacific Islander2,7331.49%4,0171.90%+46.98% Other Race13,7287.48%20,9559.92%+52.64% Total183,410100.00%211,191100.00%+15.15% Hispanic or Latino (of any race)21,31911.62%33,77315.99%+58.42%
21, %33, %+58.42%")
10
Nevada County Educational Attainment, Residents 25 and Older, 2010 County High School or BetterBachelor’s or BetterGraduate or Professional Churchill 87.7%18.2%6.6% Clark 83.5%21.7%7.2% Douglas 91.2%25.9%9.9% Elko 84.5%15.8%5.1% Esmeralda 84.1%21.1%6.1% Eureka 88.2%17.8%3.0% Humboldt 80.9%13.4%3.1% Lander 75.0%12.9%2.5% Lincoln 83.0%15.8%6.2% Lyon 85.8%12.7%4.2% Mineral 86.3%8.2%1.7% Nye 81.7%10.5%2.7% Pershing 79.4%12.4%3.6% Storey 91.8%13.9%5.5% Washoe 86.4%26.7%9.7% White Pine 83.8%13.4%3.8% Carson City 88.0%21.6%9.0% WNDD 87.1%18.0% 6.9% WNDD Plus Washoe 54.3%21.8%7.4% NEVADA 85.0%27.9%10.3%

11
Nevada County Educational Attainment, High School or Better, Selected Age Groups, 2010 County High School or Better 25 to 34 Years Old High School or Better 45 to 64 Year Olds Churchill 91.9%89.8% Clark 82.2%85.0% Douglas 89.3%92.7% Elko 84.7%85.0% Esmeralda 100.0%86.0% Eureka 78.4%91.8% Humboldt 82.8%80.8% Lander 77.1%77.3% Lincoln 74.2%85.6% Lyon 82.7%87.8% Mineral 96.1%89.9% Nye 79.4%83.1% Pershing 69.7%80.1% Storey 100.0%88.9% Washoe 83.4%87.6% White Pine 85.2%86.9% Carson City 85.4%90.0% WNDD 85.8%89.0% WNDD Plus Washoe 82.6%85.8% NEVADA 86.8%87.5%

12
Group Exercise 1.What are the WNDD Region’s Strengths from a Demographic Perspective 2.What are the WNDD Region’s Weaknesses from a Demographic Perspective

13
Two Economic Development Procedures Export Enhancement Import Substitution

14
Export Enhancement Export Enhancement seeks to find economic sectors which WNDD has had relative success in attracting and nurturing during the past

15
Import Substitution Import Substitution seeks to reduce money outflows from WNDD by creating economic development opportunities to fill the demands for goods and services by WNDD businesses and institutions

16
Types of Import Substitution GAPS are demands for goods and services by WNDD industries and institutions purchased outside the WNDD Area because they are not produced locally. These are called Non- Competitive Imports. DISCONTECTS are demands for goods and services by WNDD industries and institutions purchased outside the WNDD Area but are produced locally. These are called Competitive Imports.

17
CRITERIA FOR SELECTING EXPORT ENHANCEMENT SECTORS IN WNDD Criteria used for selection follows 2006-2011 data supplied by the Southern Rural Development Center: 1.Location Quotients for 2011 2.Jobs in 2006 3.Hobs in 2011 4.Percentage Change in Jobs from 2006 to 2011 5.Average Earnings for 2011

18
CALCULATION OF LOCATION QUOTIENT LQ i = LEI i / TLE NEI i / TNE Where: LEI j = Local Employment Industry i TLE = Total Local Employment NEI j = National Employment Industry i TNE = Total National Employment

19
EXAMPLE LQ CALCULATION

20
BUBBLE CHART AREAS

21
BUBBLE CHART ANALYSIS WITH SRDC DATA

24
CLUSTER RATING CLUSTERCategory Business & Financial STAR AER MATURE Energy STAR Biomedical STAR Transportation &Logistics STAR Agricultural Business MATURE Defense STAR Advanced Materials TRANSFORMING Mining EMERGING IT Telecommunications TRANSFORMING Printing TRANSFORMING Fabricated Metal TRANSFORMING Chemicals TRANSFORMING Education EMERGING Forest TRANSFORMING Computer TRANSFORMING Transportation Equipment TRANSFORMING Primary Metal TRANSFORMING Apparel TRANSFORMING Machinery EMERGING Glass TRANSFORMING Electrical TRANSFORMING

25
RANKING OF WNDD CLUSTERS-SRDC CLUSTER Business & Financial Energy Transportation & Logistics AER Biomedical Advanced Materials Mining Defense Primary Metal IT Telecomm Machinery Chemicals Agricultural Business Computer Fabricated Metal Education Glass Transportation Equipment Printing Electrical Forest Apparel

26
DETAILED SECTOR BY SRDC CLUSTER

27
Group Exercise Which clusters should WNDD pursue and why? Which clusters should WNDD not pursue and why?

28
SIERRA PACIFIC MEGAPOLITAN

Similar presentations


 Epidemiology and Program Prevention Efforts.>")


