Download presentation
Presentation is loading. Please wait.

1
Eban Z. Bean, PhD ECUEngineering

2
Largest reservoir of fresh water that is readily available Relatively Constant Quality and Production

3
Zone of saturation Water table – the upper limit of the zone of saturation

5
Porosity – percentage of total volume of rock or sediment that consists of pore spaces

7
Overpumping In many places the water available to recharge the aquifer falls significantly short of the amount being withdrawn Subsidence Ground sinks when water is pumped from wells faster than natural recharge processes can replace it Coastal plain subsidence rate: 0.1 – 0.3 in/yr

9
Saltwater intrusion/contamination Excessive groundwater withdrawal causes saltwater to be drawn into wells, thus contaminating the freshwater supply primarily a problem in coastal areas

10
Seawater: >30 ppt

11
Sinking a well can lead to groundwater pollution problems Other sources and types of contamination include substances such as Gas and oil Highway salt Fertilizers Pesticides Chemical and industrial materials

12
50“ Rain 34” ET 5” Overland Runoff 11“ Groundwater Recharge 15” Total Runoff 1” Recharge to Confined Aquifers COASTAL PLAIN 50“ Rain 5” Overland Runoff 11“ Groundwater Recharge 16” Total Runoff PIEDMONT or MOUTAINS Modified from Wilder, H.B., Robinson, T. M., and Lindskov, K. L., 1978. Water Resources of Northeast North Carolina. USGS Water Resources Investigations, 77-81 34” ET

14
1970’s – 1980’s – Aquifer levels declining, wells producing less water 1998 – CCPCU Investigative Report 1997/1999 – 2000 Approved Base Rate 2001 – CCPCUA Approved 2002 – CCPCUA Rules Effective > 10,000 gpd withdrawals

15
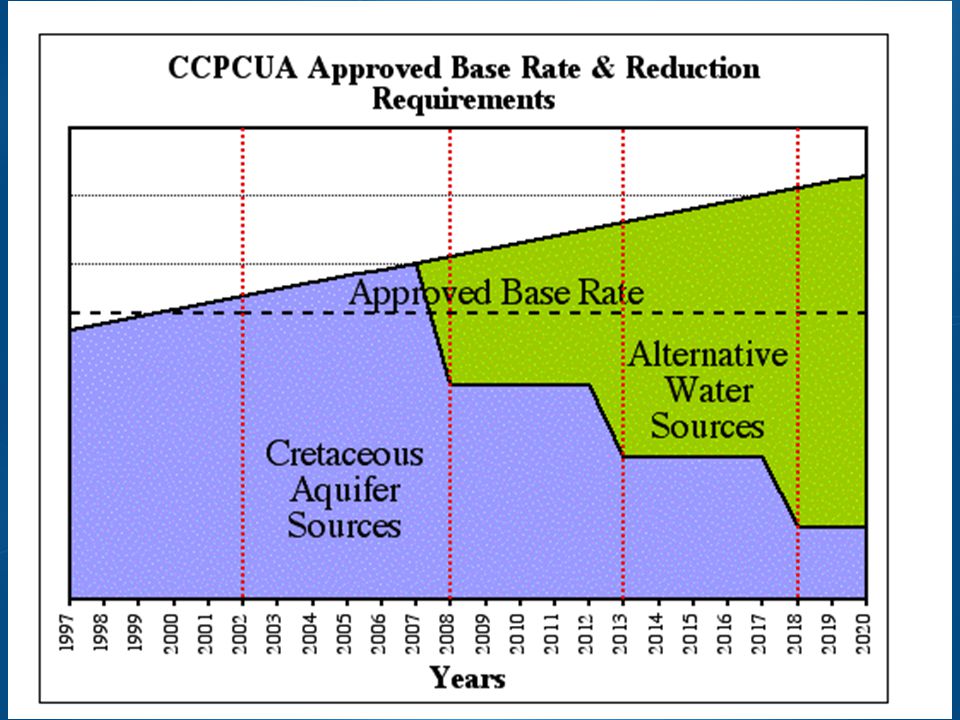
CRETACEOUS AQUIFERS (Subject to CCPCUA Rules)
")
16
Declining Water Level Zone: 2008: 10% 2013: 20% 2018: 30% Dewatering and Salt Water Encroachment Zone: 2008: 25% 2013: 50% 2018: 75%

18
Banked Water

19
Tar River Aquifer Storage and Recovery ~8 ft. /yr

20
2007 2011 Upper Cape Fear Aquifer

21
KinstonNeuse River Black Creek Aquifer ~10 ft./yr

22
2007 2012 Black Creek Aquifer

23
JacksonvilleCastle Hayne & Peedee Aquifers ~10 ft./yr

24
1992 2010

25
Reduce (Best) First and foremost, use less water overall Indoors: low flow fixtures, home run plumbing, etc. Outdoors: native drought-tolerant landscaping, soil moisture sensors, micro-irrigation, etc. Reuse (Better) Second, minimize potable water use via reuse Stormwater reuse Graywater reuse (rooftops, cisterns, shower/bath/sinks, etc.) Recycle (Good) Lastly, recycle wastewater Dual piped reclaimed water systems
 Second, minimize potable water use via reuse Stormwater reuse Graywater reuse (rooftops, cisterns, shower/bath/sinks, etc.) Recycle (Good) Lastly, recycle wastewater Dual piped reclaimed water systems.")
26
“Adopt water conservation-based rate structure, such as: flat rates, increasing block rates, seasonal rates, or quantity-based surcharges.” Unit Price Quantity

27
“Adopt water conservation ordinance for irrigation, including such measures as: time-of-day and day-of-week restrictions on lawn and ornamental irrigation, automatic irrigation system shut-off devices or other appropriate measures.” Lawns are most irrigated crop Half of home’s water use Municipalities limit turfgrass area

28
Evapotranspiration (ET) Controllers Rain Sensors (RS) Soil Moisture Sensors (SMSs)
 Controllers Rain Sensors (RS) Soil Moisture Sensors (SMSs)")
29
“Implement a retrofit program that makes available indoor water conservation devices to customers (such as showerheads, toilet flappers, and faucet aerators).”
.")
31
USEGal/Person/Day*Percentage of Total Faucets10.823.9% Clothes Washing10.022.1% Showers8.819.5% Toilets8.218.0% Leaks4.08.8% Baths1.22.7% Dishwashers0.71.5% Other Uses1.63.4% Total45.2100.0% Indoor Water Use Handbook of Water Use Conservation, Amy Vickers Residential End Uses of Water: WERF, 1999 45.2 Gal/Person/Day * 365 days * 2.5 people = 41,245 Gal/yr. *Water Conservation Values (e.g. low flow toilets, showers)
.")
32
“Evaluate the feasibility of water reuse as a means of conservation, where applicable” Reclaimed water system Gray Water (Purple Pipe/Dual Pipe) Stormwater Reuse
 Stormwater Reuse")
33
POTABLE SUPPLY WWTP FAUCETS SHOWERS/BATHS DISH WASHING CLOSTHES WASHING TOILETS

34
SUPPLY USE WTP POTABLE POTABLE/ NON-POTABLE DISCHARGE SANITARY SEWERS TO WWTP

35
SUPPLY USE WTP POTABLE POTABLE/ NON-POTABLE DISCHARGE SANITARY SEWERS TO WWTP REUSE AND RECYCLING

36
Under or Above Ground Detains Runoff Recovers Storage by Use Relatively Small Foot Print Great Retrofit Option

37
SUPPLY USE WTP POTABLE POTABLE/ NON-POTABLE DISCHARGE SANITARY SEWERS TO WWTP RAINFALL/ RUNOFF STORM SEWERS TO SURFACE WATERS

38
SUPPLY USE WTP POTABLE POTABLE/ NON-POTABLE DISCHARGE SANITARY SEWERS TO WWTP RAINFALL/ RUNOFF STORM SEWERS TO SURFACE WATERS CAPTURE & TREATMENT

39
Greenville, NC Annual Rainfall: ~48 in.

40
Roof Area: 2000 ft 2 Annual Rainfall: ~48 in. Annual Roof Runoff Volume: ~50,000 gal/yr. Capture Efficiency (80%): ~40,000 gal/yr. 2.5 people = 41,245 Gal/yr.
: ~40,000 gal/yr. 2.5 people = 41,245 Gal/yr..")
41
“We are not running out of water….we’re running out of CHEAP water” -Florida Water Management District Official Eban Bean, PhD beaneb@ecu.edu Engineering Department Institute for Coastal Science and Policy East Carolina University

Similar presentations