Download presentation
Presentation is loading. Please wait.

1
Six Sigma Approach to Reduction of Infections Lois Yingling, RNC, MSN, CPHQ, Black Belt Florida Hospital Orlando, Florida Lois.Yingling@flhosp.org

2
Objectives At the conclusion of the presentation participants will: At the conclusion of the presentation participants will: List the 5 steps of Six Sigma Identify components of the IHI central line bundle Appreciate the value of a systematic approach to process improvement

3
Overview Who is Florida Hospital Bloodstream infections Five steps of Six Sigma Define Measure Analyze Improve Control Lessons learned with CDT

4
Who is Florida Hospital? Founded in 1908 by Adventist Church Oldest & largest healthcare system in Central Florida Seven campuses in 3 counties Licensed for over 1800 beds Third largest employer in Central Florida Largest Medicare population in the nation Recognized as one of America’s Best Hospitals in U.S. News & World Report for the seventh year in a row HealthGrades 2005 Award for Excellence in Patient Safety

5
D MAIC Define

6
Why Bloodstream Infection (BSI) Published mortality rates as high as 35% Baseline CVC related BSI: 13% Additional therapy costs $56,000 Baseline CVC related BSI: $16,699 variable cost Increased length of stay Baseline CVC related BSI: 20.6 additional days per case
 Published mortality rates as high as 35% Baseline CVC related BSI: 13% Additional therapy costs $56,000 Baseline CVC related BSI: $16,699 variable cost Increased length of stay Baseline CVC related BSI: 20.6 additional days per case")
7
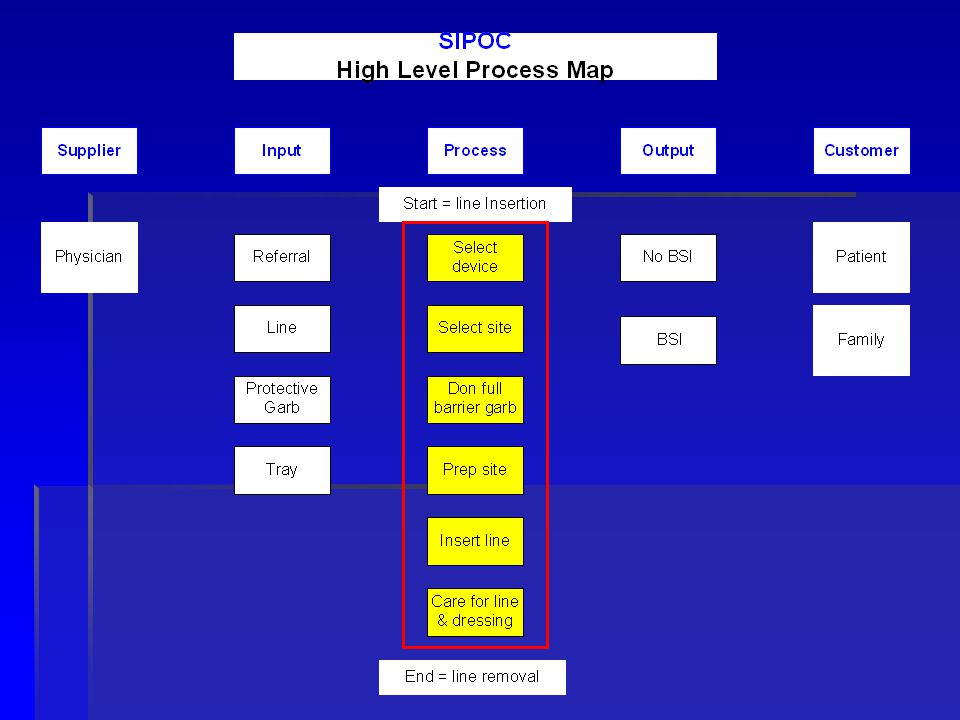
National Interest Institute for Healthcare Quality (IHI) Central line bundle Hand hygiene Maximal barrier precautions Chlorhexadine skin antisepsis Appropriate care of site and line system No routine replacement Center for Disease Control (CDC) Guidelines
 Central line bundle Hand hygiene Maximal barrier precautions Chlorhexadine skin antisepsis Appropriate care of site and line system No routine replacement Center for Disease Control (CDC) Guidelines")
8
D M AIC Measure

9
Scope In Scope: Inpatients system-wide >17 y/o Positive blood culture within 48 hours of admission (2 weeks re- admission) Confirmed based on CDC definition CVC Out of Scope PICC lines Tunneled, port, dialysis, peripherals
 Confirmed based on CDC definition CVC Out of Scope PICC lines Tunneled, port, dialysis, peripherals")
10
Project Description/ Problem Statement Based on 2003 & annualized 2004 data: 43% of BSIs were secondary to CVCs LOS is increased by 20.6 days per case Variable treatment cost is increased by $16,699 per case Goal: Decrease the number of CVC related cases by 10%, a decrease of 16 cases per year

12
Baseline Process in control, no special cause variation

13
Gauge Repeatability 100% One person repeatedly measures same unit

14
Gauge Reproducibility 90% Two or more persons measure the same unit

15
DM A IC Analyze

16
Process Capability Y1 All BSI Overall Z.USL -1.39 Sigma 0

17
Vital Xs

18
DMA I C Improve

19
Interventions & Results

20
Statistical Significance Two-Sample T-Test and CI: Historical VS New Mean Two-sample T for Rate C7 N Mean StDev SE Mean 1 11 0.658 0.154 0.047 (Jan 2003 - November 2003) 2 14 0.355 0.131 0.035 (Nov 2003 - January 2005) Difference = mu (1) - mu (2) Estimate for difference: 0.303182 95% CI for difference: (0.181309, 0.425054) T-Test of difference = 0 (vs not =): T-Value = 5.21 P-Value = 0.000 DF = 19 Difference between historical & new mean is statistically significant
 (Nov January 2005) Difference = mu (1) - mu (2) Estimate for difference: 95% CI for difference: ( , ) T-Test of difference = 0 (vs not =): T-Value = 5.21 P-Value = DF = 19 Difference between historical & new mean is statistically significant")
21
Error Proofing Trays Custom Trays: Anesthesia Trays - no sterile garb ED & Unit Trays – sterile garb Issue: Anesthesia trays without sterile garb distributed to units Error Proof: All custom trays include sterile garb and antimicrobial catheter

22
DMAI C Control

23
Reliable Measurements BSI Rate is based on CDC definition. CVC related BSI extrapolated from total BSI cases.

24
Current Status Process is in Control

25
Target: 5 or Less/Month

26
Process Capability Y1 All BSI overall Z.USL 0.30 current Sigma 1.8

27
Owner Accountability

28
Results Capacity YTD April Actual 296 Days Target 110 Days Variance 186 Days Dollar Savings YTD April Actual $207,196 Target $77,233 Variance $129,963

29
CDT: Lessons Learned

30
Scope: Containment In Scope: Inpatients system-wide >17 y/o Diarrhea with confirmed assay diagnosis of CDT Out of Scope Outpatients Inpatients without diarrhea & confirmed assay diagnosis of CDT

31
Scope: Prevention In Scope: Inpatients system-wide, except Campus 3, >17 y/o with a history of a surgical procedure on the SIP list Diarrhea with confirmed assay diagnosis CDT Out of Scope All patients admitted to Campus 3 All medical patients and all surgical patients not on SIP list

32
CDT Baseline Out of Control Baseline 2003 through June 2004

33
CDT Rate 100% Assay Testing increased Case Finding

34
Containment April 2005 Terminal Cleans with bleach for rooms of CDT patients May 2005 Error Proofing Terminal Cleans for all rooms July Pilot Campus 6 New non-bleach product Kills spores No damage to furniture Bleach

35
CDT Rate

36
CDT Cases/Month Terminal bleach clean CDT rooms Terminal bleach clean all Rooms 2004 - June 2005: Target 152 or less/month

37
Prevention Right Antibiotic Right time Within one hour of incision Right duration Discontinue within 24 hours for prophylaxis Document if treating infection

38
Business Case Improved clinical quality (absence of infection) Capacity opportunity of 1639 days Financial opportunity of $1,298,484
 Capacity opportunity of 1639 days Financial opportunity of $1,298,484")
39
Summary Six Sigma: Well defined methodology Systematic approach Robust Data driven Directional Statistical application for other initiatives

40
“Alice came to a fork in the road. ‘Which road do I take?’ she asked. ‘Where do you want to go?’ responded the Cheshire cat? ‘I don’t know.’ Alice answered. ‘Then’ said the cat, ‘it doesn’t matter.’” “Alice came to a fork in the road. ‘Which road do I take?’ she asked. ‘Where do you want to go?’ responded the Cheshire cat? ‘I don’t know.’ Alice answered. ‘Then’ said the cat, ‘it doesn’t matter.’” From “Alice in Wonderland” by Lewis Carroll

Similar presentations
: What the Direct Caregiver Should Know>")
>")


>")


 Key Facts Three year demo (2003-2006); extended for three additional years through Oct. 2009 225 hospitals.>")


 State Healthcare.>")


