Download presentation
Presentation is loading. Please wait.

1
Landfill Cover Design Jae K. (Jim) Park, Professor Dept. of Civil and Environmental Engineering University of Wisconsin-Madison

2
Landfill Cover Design Design considerations Cost Estimation of
percolation quantities Erosion and slope stability concerns Selection of landfill cover components Selection of cover materials, slope, and thickness Estimation of runoff quantities onto adjacent lands Long-term durability Main design consideration: minimize leachate production during filling of a landfill and after closure of a landfill, and collect landfill gas for beneficial use

3
Role of Cover Components
Vegetative soil cover: reduces infiltration and wind erosion, and provides rootzone and temporary moisture retention Filter layer: prevents sifting of overlying cover soil into the drainage layer; cohesionless soil or geotextiles; d15 (filter)/d85 (drainage layer) < 4~5 Drainage layer: provides a lateral path for water to exit rapidly Clay layer: minimizes infiltration through the cover Gas collection layer: collect landfill gas Cover layer: cover refuse
/d85 (drainage layer) < 4~5 Drainage layer: provides a lateral path for water to exit rapidly Clay layer: minimizes infiltration through the cover Gas collection layer: collect landfill gas Cover layer: cover refuse")
4
Problems with Clay Liner
Difficulty of compacting on a soft foundation Cracks due to desiccation Damage by freezing Cracks due to differential settling Difficult to repair once damaged Inability of restricting the movement of landfill gas Solution to problems associated with clay liner Use one or more geomembranes* * Sheet-like structures, which are commonly used in environmental and water protection applications

5
Landfiil Cover Type I Can be replaced with geotextile

6
Landfiil Cover Type II

7
Landfiil Cover Type III

8
Final Cover Configurations (1)
")
9
Final Cover Configurations (2)
")
10
Final Cover Configurations (3)
Top soil Cover soil Geotextile Gravel Geotextile Clay Gas venting Waste

11
Final Cover Configurations (4)
Top soil Cover soil Geocomposite for drainage Geomembrane Geocomposite for Gas venting Waste

12
Interim Landfill Cover

13
Landfill Cover Objectives
To operate with a min. postclosure maintenance To allow the site to be returned to some beneficial use as quickly as possible To make the site aesthetically acceptable to nearby residents To accommodate settlement To prevent the blowing of litter or dust onto adjacent properties To suppress fire dangers To contain gases and vapors To allow placement as each cell is completed To be water- and erosion-resistant To be stable against slumping, cracking, and slope failure To be resistant to cold weather distress and to disruption by animals and plants

14
Components of the Hydrologic Cycle (1)
Interception and evapotranspiration by vegetation Precipitation Surface runoff Infiltration Cover material Change in water content Refuse Percolation Interception: by vegetation; function of the season of the year, vegetative species, the age and density of the vegetation, and the character of the storm.

15
Components of the Hydrologic Cycle (2)
Evapotranspiration: determined based on empirical data or pan-evaporation data; function of solar radiation, differences in vapor pressure between a water surface and the overlying air, temperature, wind, atmospheric pressure, and type of vegetation; major factor in determining leachate generation Lysimeter: consists of an upright vegetation soil cell so designed that input water and water percolating out the bottom can be accurately measured. The difference is evapotranspiration. Adjusted pan-evaporation: evaporation from a typical pan 4 ft diameter and 10 inch deep times a pan coefficient (0.7) Thornthwaite method: determine the annual heat index, use a table to determine daily potential evapotranspiration (PE), and adjust the PE for month and day lengths with correction factors (Chapter 7 Water Balance)
 Thornthwaite method: determine the annual heat index, use a table to determine daily potential evapotranspiration (PE), and adjust the PE for month and day lengths with correction factors (Chapter 7 Water Balance)")
16
Components of the Hydrologic Cycle (3)
Infiltration: penetrates the ground surface and clarify into the soil by gravitational and capillary forces; function of porosity (soil density, grain size and shape, organic content, etc.), initial moisture content, slope and degree of surface deformation, raindrop size and impact velocity, rainfall intensity and duration, inwash of fine materials, vegetation, and temperature
, initial moisture content, slope and degree of surface deformation, raindrop size and impact velocity, rainfall intensity and duration, inwash of fine materials, vegetation, and temperature.")
17
Infiltrometer (ASTM D 5093 - 90)
The infiltration rate of water through soil is measured using a double-ring infiltrometer with a sealed or covered inner ring. The infiltrometer consists of an open outer and a sealed inner ring. The rings are embedded and sealed in trenches excavated in the soil. Both rings are filled with water such that the inner ring is submerged. The rate of flow is measured by connecting a flexible bag filled with a known weight of water to a port on the inner ring. As water infiltrates into the ground from the inner ring, an equal amount of water flows into the inner ring from the flexible bag. After a known interval of time, the flexible bag is removed and weighed. The weight loss, converted to volume, is equal to the amount of water that has infiltrated into the ground. An infiltration rate is then determined from this volume of water, the area of the inner ring, and the interval of time. This process is repeated and a plot of infiltration rate versus time is constructed. The test if continued until the infiltration rate becomes steady or until it becomes equal to or less than a specified value.

18
Infiltrometers

19
Components of the Hydrologic Cycle (4)
* 07/16/96 Components of the Hydrologic Cycle (4) Surface Runoff: develops after the initial demand of interception, infiltration, and surface storage have been satisfied; function of surface slope, antecedent moisture conditions, and vegetative cover; Soil Conservation Services (SCS) methodology is frequently used. S = potential max. soil moisture retention after runoff begins S Ex. 10 inches of sand with 30% voids; rainfall, P of 8 in. S = 10 × 0.3 = 3 in. CN = 1,000/(10+3) = 77 Q (direct runoff) = 5.3 in. *
 Surface Runoff: develops after the initial demand of interception, infiltration, and surface storage have been satisfied; function of surface slope, antecedent moisture conditions, and vegetative cover; Soil Conservation Services (SCS) methodology is frequently used. S = potential max. soil moisture retention after runoff begins. S. Ex. 10 inches of sand with 30% voids; rainfall, P of 8 in. S = 10 × 0.3 = 3 in. CN = 1,000/(10+3) = 77. Q (direct runoff) = 5.3 in. *")
20
Runoff Curve Numbers (30~100)
Reference:

21
Soil Groups Average runoff condition and initial abstraction of 0.2 S
Infiltration rate, in/hr, Ic 0.3~0.4 0.15~0.3 0.05~0.15 0~0.05 Transmission rate, cm/hr, rt ≥0.76 0.38~0.76 0.13~0.38 < 0.13 Average runoff condition and initial abstraction of 0.2 S Poor: < 50% ground cover; Fair: 50~75% ground cover; Good: > 75% ground cover If CN is < 30, use CN = 30 for runoff computations CN: min. 30 and max. 100

22
USDA Textural Types Corresponding to USCS Soil Designations
GW Same as GP (except well graded in grain sizes) GP Gravel, very gravelly sand (less than 5 percent silt and clay) GM Very gravelly sandy loan, very gravelly loamy sand, very gravelly silt loam, very gravelly loam GC Very gravelly clay loam, very gravelly sandy clay loam, very gravelly silty clay loam, very gravelly silty clay, very gravelly clay SW Same as SP (except well graded in grain sizes) SP Sand, gravelly sand (less than 20 percent very fine sand) SM Loamy sand, sandy loam; sand; gravelly loamy sand and gravelly sandy loam SC Sandy clay loam, sandy clay; gravelly sandy clay loam and gravelly sandy clay ML Silt, silt loam, loam, sandy loam CL Silty clay loam, clay loam, sandy clay OL Mucky silt loam, mucky loam, mucky silty clay loam, mucky clay loam MH Silt, silt loam (highly elastic, micaceous or diatomaceous) CH Silty clay, clay CH Mucky silty clay PT Muck, peat USCS: Unified Soil Classification System; G: gravel, S: Sand, M: Silt, C: Clay, O: Organic P: Poorly graded (uniform particle), W: Well graded, H: High plasticity, L: Low plasticity
 GP Gravel, very gravelly sand (less than 5 percent silt and clay) GM Very gravelly sandy loan, very gravelly loamy sand, very gravelly silt loam, very gravelly loam. GC Very gravelly clay loam, very gravelly sandy clay loam, very gravelly silty clay loam, very gravelly silty clay, very gravelly clay. SW Same as SP (except well graded in grain sizes) SP Sand, gravelly sand (less than 20 percent very fine sand) SM Loamy sand, sandy loam; sand; gravelly loamy sand and gravelly sandy loam. SC Sandy clay loam, sandy clay; gravelly sandy clay loam and gravelly sandy clay. ML Silt, silt loam, loam, sandy loam. CL Silty clay loam, clay loam, sandy clay. OL Mucky silt loam, mucky loam, mucky silty clay loam, mucky clay loam. MH Silt, silt loam (highly elastic, micaceous or diatomaceous) CH Silty clay, clay. CH Mucky silty clay. PT Muck, peat. USCS: Unified Soil Classification System; G: gravel, S: Sand, M: Silt, C: Clay, O: Organic. P: Poorly graded (uniform particle), W: Well graded, H: High plasticity, L: Low plasticity.")
23
Estimated Unit Costs for Various Cover Layers (Source: RMT, Inc.)
Layer Type and Thickness Installed Cost, dollars/yd2 Loose soil (2 ft) 0.35 Compacted soil (2 ft) 0.70 Cement concrete (4 in.) 9.00 Asphalt concrete (4 in.) 2.50~3.50 Soil-cement (7 in.) 1.50 Soil-asphalt 1.50 Polyethylene membrane (10 mil)* 1.00~1.50 Polyvinyl chloride membrane (20 mil) 1.30~2.00 Chlorinated polyethylene membrane (20-30 mil) 2.40~3.20 Hypalon membrane (20 mil) 2.50 Neoprene membrane 5.00 Ethylene propylene rubber membrane 2.70~3.50 Butyl rubber membrane 2.70~3.80 Paving asphalt 1.20~1.70 Sprayed.asphalt membrane (1/4 in.) and soil cover 1.25~1.75 Reinforced asphalt membrane (100 mil) and soil cover 1.50~2.00 Bentonite layer (2 in.) 1.40 Bentonite admixture (9 lb/yd2) in soil 0.75 * Not recommended because of thinness
 Compacted soil (2 ft) Cement concrete (4 in.) Asphalt concrete (4 in.) 2.50~3.50. Soil-cement (7 in.) Soil-asphalt Polyethylene membrane (10 mil)* 1.00~1.50. Polyvinyl chloride membrane (20 mil) 1.30~2.00. Chlorinated polyethylene membrane (20-30 mil) 2.40~3.20. Hypalon membrane (20 mil) Neoprene membrane Ethylene propylene rubber membrane 2.70~3.50. Butyl rubber membrane 2.70~3.80. Paving asphalt 1.20~1.70. Sprayed.asphalt membrane (1/4 in.) and soil cover 1.25~1.75. Reinforced asphalt membrane (100 mil) and soil cover 1.50~2.00. Bentonite layer (2 in.) Bentonite admixture (9 lb/yd2) in soil * Not recommended because of thinness.")
24
Components of the Hydrologic Cycle (5)
Caution: Since a daily time increment is used in the hydrologic water balance, a short-duration intensive storm is uniformly distributed over the 24-hr period, resulting in decreased rainfall intensity → more infiltration and less runoff Subsurface Lateral Flow: occurs when infiltrated rainfall meets an underground zone of low transmission (the clay layer) and is diverted laterally travels to either (1) external surface of the landfill or (2) the drainage collection tiles. Runoff Velocity and Time of Concentration (tc) (time required for the most remote location in the drainage catchment to contribute to a point of interest, such as a culvert under a road near the landfill site): estimated for different slope and surface covers, using Manning’s equation.
 and is diverted laterally travels to either (1) external surface of the landfill or (2) the drainage collection tiles. Runoff Velocity and Time of Concentration (tc) (time required for the most remote location in the drainage catchment to contribute to a point of interest, such as a culvert under a road near the landfill site): estimated for different slope and surface covers, using Manning’s equation.")
25
Components of the Hydrologic Cycle (6)
Time of Concentration (tc) (min) (Kirpich formula) tc = L0.77 S where L = max. length of flow (ft) and S = watershed gradient (ft/ft) Rational Method: widely used for the design of storm sewers Q (ft3/sec) = CiA where C = dimensionless runoff coefficient [0.1 (sandy loam) ~ 0.6 (tight clay)], i = rainfall intensity (in/hr), and A = contributing drainage area (in acres) Assumptions: 1. The rainfall is assumed to occur at a uniform intensity over the entire watershed. 2. The rainfall occurs at a uniform intensity for a duration equal to the time of concentration. 3. The frequency of the runoff equals that of the rainfall used in the eq. 4. The runoff coefficient is the same for all storm events.
 (min) (Kirpich formula) tc = L0.77 S where L = max. length of flow (ft) and S = watershed gradient (ft/ft) Rational Method: widely used for the design of storm sewers Q (ft3/sec) = CiA where C = dimensionless runoff coefficient [0.1 (sandy loam) ~ 0.6 (tight clay)], i = rainfall intensity (in/hr), and A = contributing drainage area (in acres) Assumptions: 1. The rainfall is assumed to occur at a uniform intensity over the entire watershed. 2. The rainfall occurs at a uniform intensity for a duration equal to the time of concentration. 3. The frequency of the runoff equals that of the rainfall used in the eq. 4. The runoff coefficient is the same for all storm events.")
26
Average Velocities for Estimating Travel Time for Overland Sheet Flow
Ex. Determine the runoff velocity in a landfill cover at a 5% slope over a grassy surface and the travel time for a distance of 1,000 ft. tc = L0.77 S-0.385 = = 5.0 min 3.3

27
Components of the Hydrologic Cycle (7)
Flow Recurrence Calculation: Estimation of flows associated with specific recurrence intervals requires utilization of tc and the intensity-duration-frequency (IDF) curves specific to a particular region. Chicago, IL Ex. A landfill with tc of 20 min. and a storm with a recurrence interval of 5 yrs. Estimate rainfall. Precipitation intensity = 3.6 in/hr
 curves specific to a particular region. Chicago, IL. Ex. A landfill with tc of 20 min. and a storm with a recurrence interval of 5 yrs. Estimate rainfall. Precipitation intensity = 3.6 in/hr.")
28
Design Factors in Infiltration/Percolation Control (1)
Material Selection: Based on permeability; subject to availability and cost; soil or geomembranes Compaction: Effective in reducing infiltration/percolation but additional equipment cost; poor compaction when soil pore water is frozen Soil Layering: Lower layers act to impede percolation while upper layers support vegetation, provide erosion protection, and help retain capillary water in the lower layers Thickness: Increases water storage capacity and reduces detrimental effects of cracks and settlement; min. cover thickness > 2 R, where R is relief, defined as the vertical distance from the high point to the low point of irregularities on the top surface of the solid waste; governed by coverage, gas migration, infiltration, trafficability and support requirements, and freeze/thaw or dry/soak effects

29
Design Factors in Infiltration/Percolation Control (2)
Differential Settlement: Creates depressions detaining runoff, keep bulky objects away from upper part of waste; settlement arises because of the following factors: A reduction in void space and compression of loose materials Volume changes from biological decomposition and chemical reaction Loss of volume due to dissolution into leachate Movement of smaller particles into larger voids Settlement of underlying soil materials beneath the landfill Maintain a 5% slope toward the edge; ave. settlement - 11% of the overall depth (max. 30%); major settlement within a year Discontinuities and Surface Slope: If the refuse depth is variable, cracks and surface ponding will occur. A steeper slope increases surface runoff. At < 3%, surface irregularities act as traps. 5% is best. At steep slopes, an assessment of slope stability is necessary. Surface Drainage: Assist in conveying the water off the landfill
; major settlement within a year. Discontinuities and Surface Slope: If the refuse depth is variable, cracks and surface ponding will occur. A steeper slope increases surface runoff. At < 3%, surface irregularities act as traps. 5% is best. At steep slopes, an assessment of slope stability is necessary. Surface Drainage: Assist in conveying the water off the landfill.")
30
Final and Daily Cover Materials
Both soil and non-soil materials are used. Example non-soil cover alternatives Bituminous concrete or mortar, bitumen-sulfur concrete, sprayed bituminous membranes, sprayed sulfur membrane, polyurethane foam, pre-fabricated bituminous membrane, plastic and rubber membrane, fly ash, bottom ash and slag, incinerator residue, mill tailings, plant sludges, mulched leaves, asphalt, industrial wastes (foundry sand and paper mill sludge) etc. Geomembranes are typically recommended at 40 to 60 mil thickness. A soil buffer or geotextile must be provided above and below the geomembrane for protection.
 etc. Geomembranes are typically recommended at 40 to 60 mil thickness. A soil buffer or geotextile must be provided above and below the geomembrane for protection.")
31
Alternative Daily Cover (1)
")
32
Alternative Daily Cover (2)
Foam spray

33
Alternative Cover (3)
")
34
Vegetative Growth and Surface Preparation
Completed landfills are being developed to include parks, golf courses, nature areas, and bicycle path. Vegetation: select appropriate species Top soil: medium-textured soils, e.g., loam soils; test for pH, Mg, Ca, P, NO3, NH4, K, Cu, Fe, Zn, Mn, conductivity, particle-size distribution, bulk density, and organic matter Top soil thickness: grasses - 24~30 in.; shrubs - 36~42 in. Application of seed and mulch

35
Gas Control A gas collection layer is required.
A low permeable layer of 2 ft of clay and a 20 mil flexible membrane liner, a surface water drainage layer, and a cover layer capable of supporting vegetation Active or passive collection system Require a coarse particle-size gradation Require a min. slope in the collector pipe of 2% (2~5%) Vented gas Riser Vegetation Final cover Drainage layer Compacted soil Perforated lateral Gravel
 Vented gas. Riser. Vegetation. Final cover. Drainage layer. Compacted soil. Perforated lateral. Gravel.")
36
Maintenance Problems Difficulty of Maintaining Vegetation: high rate of vegetation die-off due to low moisture, elevated CO2 and CH4 conc.; gas barrier systems A soil trench underlain with plastic sheeting over gravel and vented by means of vertical PVC pipe A 0.9 m soil mound underlain with 30 cm of clay A 0.9 m soil mound with no clay barrier Environmental Soil Conditions: freezing/thawing, wetting/drying, root penetration, and burrowing animals Erosion due to Excessive Velocities: < 0.75 ~ 2.4 m/sec (2.5 ~ 8 ft/sec) depending on type of vegetation or cover Off-Site Flows: post-development runoff level predevelopment level
 depending on type of vegetation or cover. Off-Site Flows: post-development runoff level predevelopment level.")
37
A (tons/acre/yr) = R K L S C P
Soil Loss Estimation Universal Soil Loss Equation A (tons/acre/yr) = R K L S C P Rainfall factor, R: function of kinetic energy of a storm and its intensity; Table 8.15 Soil erodibility factor, K: function of physical/chemical properties of soil; Table 8.16 Slope-length factor, L: Figure 8.14 Slope-gradient factor, S: Figure 8.14 Cropping-management factor, C: ratio of soil loss from land cropped under particular conditions to that from continuously fallowed land; Table 8.17 Erosion control practice factor, P: Table 8.18 0 < A < 5: frequently considered as an acceptable loss/yr 5 < A < 20: sedimentation retention required A > 20: design changes required (terraces or slope/depth changes)
 = R K L S C P. Rainfall factor, R: function of kinetic energy of a storm and its intensity; Table Soil erodibility factor, K: function of physical/chemical properties of soil; Table Slope-length factor, L: Figure Slope-gradient factor, S: Figure Cropping-management factor, C: ratio of soil loss from land cropped under particular conditions to that from continuously fallowed land; Table Erosion control practice factor, P: Table < A < 5: frequently considered as an acceptable loss/yr. 5 < A < 20: sedimentation retention required. A > 20: design changes required (terraces or slope/depth changes)")
38
Example Calculate the soil loss for Madison, Wisconsin of 5 acres. Design slope = 14% & 200 ft long; 65% silt & 35% sand with slow to moderate permeability; bare of vegetation Solution R = 77; K = 0.3; LS = 3.3; C = 1 (Initial); C = (First yr); P = 1. Initial : A = 77 0.3 3.3 1 1 = ton/acre/yr First yr: A = 77 0.3 3.3 0.05 1 = 3.81 ton/acre/yr
; C = 0.05 (First yr); P = 1. Initial : A = 77 0.3 3.3 1 1 = ton/acre/yr. First yr: A = 77 0.3 3.3 0.05 1 = 3.81 ton/acre/yr.")
39
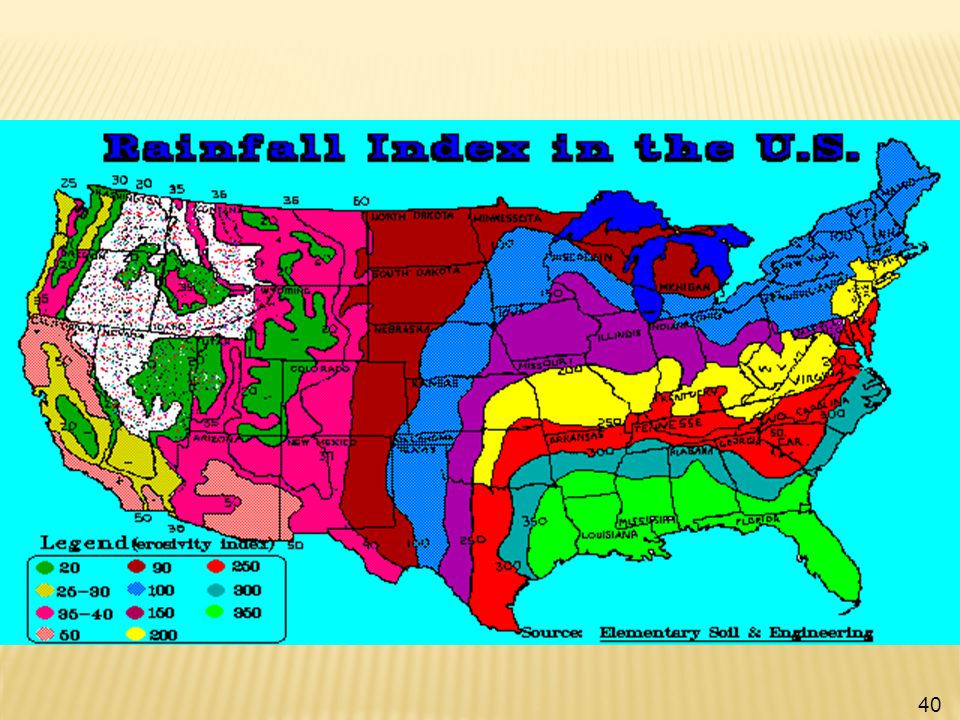
Determination of Rainfall Factor R from Table 8.15
* 07/16/96 Determination of Rainfall Factor R from Table 8.15 10 year Storm for Madison Wisconsin R = 77 *

41
Determination of Soil Erodibility Factor K from Table 8.16
65% silt and 35% sand with slow to moderate permeability K = 0.3

42
Organic Matter Content
K Factor K Factor Data Organic Matter Content Textural Class Average Less than 2 % More than 2 % Clay 0.22 0.24 0.21 Clay Loam 0.30 0.33 0.28 Coarse Sandy Loam 0.07 -- Fine Sand 0.08 0.09 0.06 Fine Sandy Loam 0.18 0.17 Heavy Clay 0.19 0.15 Loam 0.34 0.26 Loamy Fine Sand 0.11 Loamy Sand 0.04 0.05 Loamy Very Fine Sand 0.39 0.44 0.25 Sand 0.02 0.03 0.01 Sandy Clay Loam 0.20 Sandy Loam 0.13 0.14 0.12 Silt Loam 0.38 0.41 0.37 Silty Clay 0.27 Silty Clay Loam 0.32 0.35 Very Fine Sand 0.43 0.46 Very Fine Sandy Loam

43
Determination of L (Slope-Length Factor) S (Slope-Gradient Factor)
14% slope and 200 ft long 3.3 Figure 8.14

44
Equation for Calculation of LS
S = slope steepness, %; LS = slope length, ft; C = constant (72.5 Imperial or 22.1 metric); and NN = see table below
; and. NN = see table below.")
45
Determination of Cropping-Management Factor C from Table 8.17
Initial = 1.0 Newly seeded 1st year = 0.05

46
Determination of Erosion Control Practice Factor P from Table 8.18
Erosion Control Practice P value Surface condition with no Cover; compact, smooth, 1.30 Scraped Landfill surface 1.00 Rough irregular surface; Equipment (tracks in all 0.90 directions) Small sediment basins (1 0.50 Basin for 4 acres)
 Small sediment basins ( Basin for 4 acres)")
47
Soil Loss Tolerance Rates
Soil Erosion Class Potential Soil Loss (tons/acre/year) Very low (tolerable) < 3 Low 3 ~5 Moderate 5 ~10 High 10 ~ 15 Severe > 15
 Very low (tolerable) < 3 Low 3 ~5 Moderate 5 ~10 High 10 ~ 15 Severe > 15")
48
Management Strategies to Reduce Soil Losses
Factor Management Strategies Example R Cannot be altered. -- K Cannot be altered. -- Terraces may be constructed to Terracing requires additional LS reduce the slope length resulting investment. Investigate other in lower soil losses. Soil conservation practices first. The selection of crop types and Consider cropping systems that C tillage methods that result in the will provide maximum protection lowest possible C factor will for the soil. Use minimum tillage result in less soil erosion. Systems where possible The selection of a support practice Use support practices such as P that has the lowest possible factor cross slope farming that will cause associated with it will result in deposition of sediment to occur lower soil losses. close to the source.

49
Cross Slope Farming Tilling and planting across the natural slope creates a series of dams which redirect and slow runoff. This allows water to soak into the ground or to flow gently between the rows to grassed headlands at the edge of the field or to grassed waterways within the field. On short slopes, cross-slope farming can reduce erosion by up to 50%.

50
Designing for Water Erosion Control
* 07/16/96 Designing for Water Erosion Control Selection of erosion resistant soils (See Table 8.16) Dispersive clay and dispersants Try to hold overall top slope 5% Drainage features –stabilized with vegetation, additives, linings, or berms External runoff diversion Side slope protection Favorable cropping practices Mulch application to prevent bare soil Smoothing and compaction Additives: most economical treatment – straw-mulch When the ratio of sodium to other ions at these exchange sites is high, clay particles are less tightly bound to each other and the soil aggregates easily disperse when the soil becomes wet. *
 Dispersive clay and dispersants. Try to hold overall top slope 5% Drainage features –stabilized with vegetation, additives, linings, or berms. External runoff diversion. Side slope protection. Favorable cropping practices. Mulch application to prevent bare soil. Smoothing and compaction. Additives: most economical treatment – straw-mulch. When the ratio of sodium to other ions at these exchange sites is high, clay particles are less tightly bound to each other and the soil aggregates easily disperse when the soil becomes wet. *")
51
Embankment Protection Structures (1)
")
52
Embankment Protection Structures (2)
")
53
Embankment Protection Structures (3)
")
54
Drainage Facilities

55
Wind Erosion Effects (1)
Erosion Loss Model A’ (tons/acre/yr) = f(K’,C’,L’,T’,V’) Soil erodibility, K’: reflects the nature of the soil and an adjustment for knoll or hill configuration; determined from the product of the soil erodibility factor from Figure 8.16 Climate factor, C’: combines wind velocity and near-surface water content; Figure 8.17 Field length factor, L’: unsheltered distance along the direction of prevailing wind erosion; Figure 8.18 Soil ridge roughness factor, T’: reflects surface roughness beyond what is caused by clods or vegetation; determined by making amplitude measurements from crest to trough on the ground, as indicated in Figure 8.19 Vegetative cover quantity, V’: combines type and orientation effects with the tons per acre of vegetation cover; Figure 8.20
 = f(K’,C’,L’,T’,V’) Soil erodibility, K’: reflects the nature of the soil and an adjustment for knoll or hill configuration; determined from the product of the soil erodibility factor from Figure 8.16 Climate factor, C’: combines wind velocity and near-surface water content; Figure 8.17 Field length factor, L’: unsheltered distance along the direction of prevailing wind erosion; Figure 8.18 Soil ridge roughness factor, T’: reflects surface roughness beyond what is caused by clods or vegetation; determined by making amplitude measurements from crest to trough on the ground, as indicated in Figure 8.19 Vegetative cover quantity, V’: combines type and orientation effects with the tons per acre of vegetation cover; Figure 8.20")
56
Determine Soil Erodibility
Erodibility that would occur from a wide, isolated, smooth, unsheltered, bare field having a calculated % of dry aggregate > 0.84 mm in diameter. Fraction > 0.84 mm: 20% Knoll slope (from top of knoll): 5% K’ = 100 ton/acre Figure 8.16 Wind Erosion versus Percent Coarse Fraction
: 5% K’ = 100 ton/acre. Figure 8.16 Wind Erosion versus Percent Coarse Fraction.")
57
Knoll Adjustment (a) from Top of Knoll and (b) from Upper Third of Slope
Figure 8.21

58
Determine Soil Ridge Roughness
Recommended roughness factor = 2.5~4.5” Soil roughness factor = 4.5 inches Roughness factor: a measure of the surface roughness other than caused by clods or vegetation T’ = 0.5 A2’ = 250 × 0.5 = 125 H = ridge height, cm; S = ridge spacing, cm Figure Soil Ridge Roughness Factor T’ from Actual Soil Ridge Roughness

59
Determine Climate Factor in March, Madison, Wisconsin
Figure Wind Erosion Climate Factor C’ in Percent

60
4. Determine Field Length Effect
A3’ = 25 Given: L’ = 1,000 ft A2’ = 125; A3’ = 25 A2’ = 125 A4’ = 22 Move this scale to match A2’ = 125 in the main graph with A3’ = 25 in the scale L’ = 1,000 Figure 8.18

61
5. Determine Vegetative Cover and Annual Erosion
800 lb/acre actual flat residue V’ = 2,500 lb/acre Figure 8.20 Relationship between Vegetative Cover Quantity V’ and Type Vegetative Cover

62
A4’ = 22 A5’ (A) = 7 ton/acre/yr Figure 8.22
 = 7 ton/acre/yr Figure 8.22")
63
Wind Erosion Effect (2) Design Aspects 1. Determine from Figure 8.16 an erodibility increment, A1’ = K’; adjust K’ for knoll configuration as necessary using Figure Account for the effect of roughness, T, from Figure 8.19 and determine the erodibility increment, A2’ = A1’ · T’ 3. Account for the effect of local wind velocity and surface soil moisture, C’, from Figure 8.17 and find the erodibility increment, A3’ = A2’·C’ 4. Account for the effect of length of field, L’, and determine A4’ = A3’ · L’ 5. Account for vegetative cover in V’ (Figure 8.22) and determine the annual erosion as A5’ = A4’f(V’), as per Figure 8.20
 and determine the annual erosion as A5’ = A4’f(V’), as per Figure 8.20")
64
Off-Site Runoff Control
Construction of a landfill results in large increases in off-site flows and sediments. Types of off-site flow control: Swales and storm-water recharge ponds Detention basin design steps Determine the peak flow for pre-existing conditions for a specified recurrence interval. Construct a hydrograph for the design storm for the completed landfill site arriving at the detention pond. Calculate the storage needed for major storms such as the 25-year and 100-year storms. Check the performance of the basin during the more frequent storms, such as the 5- and 10-year storms.

Similar presentations
 in the natural environment or their source.>")


 Park, Professor Dept. of Civil and Environmental Engineering University of Wisconsin-Madison.>")


