Download presentation
Presentation is loading. Please wait.

1
Future Climate: 21st Century and Beyond

2
The Future… 1. The irreversibility of climate change on human time scales. 2. Sea Level Rise. New predictions 3. Ocean acidification 4. Methane permafrost and clathrate stability 5. Regional Forecasts, including California 6. Societal instability, extinction rates 7. Runaway Greenhouse odds 8. Ice sheet grounding and instability Rapidity of the change is what is so devastating, not just the absolute value of the eventual change. Ecosystems cannot adapt this fast. Human society may not be able to adapt either The GREATEST unknown is this. What will do about carbon emissions?

3
1. CO2-Induced Climate Change is Irreversible for Thousands of Years
Solomon et al , Port et al and others, show that CO2 added to the atmosphere only very slowly is soaked up by the ocean and land, and ocean thermal mass and inertia mean that climate change is irreversible on human time scales. Newest study says 20,000 – 200,000 years for climate to return to pre-industrial conditions, this is long past when Milankovich forcing will produce warming on their own. It is probably worse… Solomon et al. uses IPCC AR climate models as starting points. These are, as we know now, overly optimistic. They also do not include permafrost and peat release of methane, or continental glacier acceleration due to meltwater at the base, nor iceberg travel south out of the Arctic Ocean. Nor inhibition of warmer, fresher water near the melting poles to penetrate the thermocline and thus taking its heat further north. One caveat – in an interview, Solomon acknowledged that if somehow CO2 could be pulled OUT of the atmosphere on a grand scale, this would be a solution, if it were done soon enough, before too much diffused into the oceans. Charts from this study…

4
Atmospheric CO2 – Next 1000 years
Atmospheric CO2 – Next 1000 years. Peaks are moments of zero further Emissions. CO2 only slowly declines over the next ~200. These post-emission declines however do not include the now better-understood destruction of soil microbes and the inability of plants now in existence to handle such massive climate change and hold carbon.

5
Why Don’t CO2 Levels Fall Faster when Emissions Stop?
Because on a warmer planet… 1. Marine plants and animals are much less able to convert dissolved CO2 to CaCO3 under rising acidity 2. The sheer time scale of mixing CO2 into the ocean. Complete ocean mixing takes ~1000 years. 3. Thermal inertia of the oceans. Remember, we saw that 93% of the heat of global warming has gone into the oceans. That heat won’t go away, it’s still there, and being added to every day. CO2 does not absorb well into a hotter ocean – a hotter ocean can hold less dissolved CO2

6
93% of the Heating Has Been Transmitted Ultimately into the Oceans, Where it will Reside for Thousands of Years.

7
Oceans Soak Up CO2 Better Early On, Then as it Warms, Not So Much
Oceans Soak Up CO2 Better Early On, Then as it Warms, Not So Much. Note We Don’t Achieve Thermal Equilibrium Until ~400 years after CO2 Cessation

8
Therefore, Temperatures Don’t Fall, Even After CO2 Emissions Halt – for Millenia (Solomon et al. 2009).
..")
9
From Wigley & Weaver (2010) with explanation here
From Wigley & Weaver (2010) with explanation here. Confirming other work, that even with ZERO GHG emissions, temperatures at best remain constant
 with explanation here. Confirming other work, that even with ZERO GHG emissions, temperatures at best remain constant.")
10
Climate Forcing and Equilibrium
Think of a glass of cold 40F water being placed in a sauna room. The water takes time to warm up to the 105F temperature of the sauna. The heat diffuses into the water because there is “climate forcing” being applied to it from the hotter air around it. Its temperature continues to rise until, a couple of hours later, the water in the glass has reached a temperature of 105F, and then there is radiative equilibrium: There is as much heat flow leaving the water as there is heat flow into the water. Only then does the water temperature stop changing. That’s our situation. Meanwhile, temperature extremes will become the norm (17sec YouTube) The Earth is not in radiative equilibrium. We are forcing it to higher temperatures by reducing the atmosphere’s thermal conductivity by adding CO2 and raising humidity. If we merely STOP forcing the conductivity lower, the surface will still not be in equilibrium. It will take ~ a century or more until the atmosphere is hot enough to again be radiating as much heat as we get from the sun. During that time, we are doomed to further heating. That heating can be either rapid, or slow, depending on our actions – but we will continue to heat up. Because of the much longer thermal inertia of the oceans, the time scale for final planet-wide equilibrium to come back down to temperatures of just a few decades ago, is many thousands of years. To have hope of returning to a cooler climate, we must think about more than just reducing the rate of damage, more than even completely stopping the CO2 input damage, we must think about rapidly reversing the damage, if that is possible.
 The Earth is not in radiative equilibrium. We are forcing it to higher temperatures by reducing the atmosphere’s thermal conductivity by adding CO2 and raising humidity. If we merely STOP forcing the conductivity lower, the surface will still not be in equilibrium. It will take ~ a century or more until the atmosphere is hot enough to again be radiating as much heat as we get from the sun. During that time, we are doomed to further heating. That heating can be either rapid, or slow, depending on our actions – but we will continue to heat up. Because of the much longer thermal inertia of the oceans, the time scale for final planet-wide equilibrium to come back down to temperatures of just a few decades ago, is many thousands of years. To have hope of returning to a cooler climate, we must think about more than just reducing the rate of damage, more than even completely stopping the CO2 input damage, we must think about rapidly reversing the damage, if that is possible.")
11
Climate Sensitivity (=Temp response from doubling CO2) From of Fasulo & Trenberth (2012) (Digest here) (Note:“Earth Climate Sensitivity” = ECS = how much hotter Earth surface temperatures will be, after equilibrium, at double the pre-industrial CO2 levels - a convenient benchmark used to discuss future prospects.) “In short, while FS12 does not provide a specific measurement of climate sensitivity, it does suggest that the climate models with lower sensitivity ( 'low' here refers to approximately 2 to 3°C surface warming in response to doubled CO2, not the ridiculously low estimates of 1°C or less proposed by contrarians like Lindzen) are not accurately representing changes in cloud cover, and are therefore biased. Climate models with higher sensitivity - in the 3 to 4.4°C ECS range for doubled CO2 - more accurately simulate the observational RH (relative humidity) data and thus the response of subtropical clouds to climate change.” (Fasulo & Trenberth 2012) (continued on next page)
 In short, while FS12 does not provide a specific measurement of climate sensitivity, it does suggest that the climate models with lower sensitivity ( low here refers to approximately 2 to 3°C surface warming in response to doubled CO2, not the ridiculously low estimates of 1°C or less proposed by contrarians like Lindzen) are not accurately representing changes in cloud cover, and are therefore biased. Climate models with higher sensitivity - in the 3 to 4.4°C ECS range for doubled CO2 - more accurately simulate the observational RH (relative humidity) data and thus the response of subtropical clouds to climate change. (Fasulo & Trenberth 2012) (continued on next page)")
12
“If climate sensitivity is on the higher end of the likely range, it does not bode well for the future of the climate. As Fasullo told The Guardian, "our findings indicate that warming is likely to be on the high side of current projections." In terms of warming over the 21st Century, we are currently on track with IPCC emissions scenario A2, which corresponds to about 4°C warming above pre-industrial levels by 2100 if ECS is around 3°C for doubled CO2. Note that's the warming models expected by the year 2100, but at that point there will still be a global energy imbalance, and thus additional warming will remain 'in the pipeline' until the planet reaches a new equilibrium. An even higher ECS would correspond to even more warming, but anything greater than +2°C will almost certainly be catastrophic.”

13
Conclusions from Solomon et.al. 2009
Anthropogenic Global Warming is irreversible for more than ~1,000 years after emissions stop. Following cessation of emissions, removal of atmospheric carbon dioxide decreases radiative forcing, but is largely compensated by slower loss of heat to the ocean, so that atmospheric temperatures do not drop significantly, even out 1,000 years into the future (after which they stopped calculating. Among illustrative irreversible impacts that should be expected if atmospheric carbon dioxide concentrations increase from current levels near 385 parts per million (now in 2015 it’s over 400 ppm) by volume (ppmv) to a peak of 450–600 ppmv over the coming century are irreversible dry-season rainfall reductions in many regions (including western U.S. ) comparable to those of the ‘‘dust bowl’’ era, and inexorable sea level rise. Thermal expansion alone, even neglecting melting of continental ice produces irreversible global average sea level rise of at least 0.4 –1.0 m if 21st century CO2 concentrations exceed 600 ppmv and 0.6 –1.9 m for peak CO2 concentrations exceeding 1,000 ppmv. Sea level rise does not stop there, it continues to rise. Additional contributions from melting glaciers and ice sheet contributions to future sea level rise are uncertain but may equal or exceed several meters over the next millennium or longer. These findings are confirmed by Port et al. (2012), Wigley and Weaver (2010) and others
 by volume (ppmv) to a peak of 450–600 ppmv over the coming century are irreversible dry-season rainfall reductions in many regions (including western U.S. ) comparable to those of the ‘‘dust bowl’’ era, and inexorable sea level rise. Thermal expansion alone, even neglecting melting of continental ice produces irreversible global average sea level rise of at least 0.4 –1.0 m if 21st century CO2 concentrations exceed 600 ppmv and 0.6 –1.9 m for peak CO2 concentrations exceeding 1,000 ppmv. Sea level rise does not stop there, it continues to rise. Additional contributions from melting glaciers and ice sheet contributions to future sea level rise are uncertain but may equal or exceed several meters over the next millennium or longer. These findings are confirmed by Port et al. (2012), Wigley and Weaver (2010) and others.")
14
This graph considers thermal expansion of ocean water only
This graph considers thermal expansion of ocean water only. Temperatures held this high for this long will cause much of continental land ice to melt, increasing sea level many times more than shown here

15
But Won’t CO2 “Fertilization” Sequester More Carbon, Looking on the Bright Side?
Port et al. (2012) model effects on vegetation from predicted CO2 rises They find fertilization due to rising CO2 causes boreal forests to spread north, deserts to slightly shrink. By including the rise in carbon sequestered by CO2-fertilized plants, the reduction in greenhouse warming is only 0.22 C 0.22C drop, however, is only a tiny dent in the net ~6 C rise in global temperatures they consider And studies in 2013 say this is probably too optimistic, since it fails to include the effect of heating and drying on the soil microbes which fix nitrogen so that it is available to plants… Most plants are NITROGEN-LIMITED, not carbon-limited It also fails to account for the rapidly rising boreal and temperate forest fires as droughts spread. Burning forests convert sequestered carbon into atmospheric carbon
 model effects on vegetation from predicted CO2 rises. They find fertilization due to rising CO2 causes boreal forests to spread north, deserts to slightly shrink. By including the rise in carbon sequestered by CO2-fertilized plants, the reduction in greenhouse warming is only 0.22 C. 0.22C drop, however, is only a tiny dent in the net ~6 C rise in global temperatures they consider. And studies in 2013 say this is probably too optimistic, since it fails to include the effect of heating and drying on the soil microbes which fix nitrogen so that it is available to plants… Most plants are NITROGEN-LIMITED, not carbon-limited. It also fails to account for the rapidly rising boreal and temperate forest fires as droughts spread. Burning forests convert sequestered carbon into atmospheric carbon.")
16
From Port et al. 2012

17
2. Sea Level Rise

18
The Rate of Sea level Rise Itself continues to Accelerate as Land Ice Melting Accelerates
Observed rate of sea-level rise (red) compared with reconstructed sea level calculated from global temperature (dark blue with light blue uncertainty range). Grey line is reconstructed sea level from an earlier, simpler relationship between sea level and temperature (Vermeer 2009)
 compared with reconstructed sea level calculated from global temperature (dark blue with light blue uncertainty range). Grey line is reconstructed sea level from an earlier, simpler relationship between sea level and temperature (Vermeer 2009)")
19
The IPCC AR (nor AR4) modelling of glaciers did not include the effect of melt water on lubricating the glacier/soil interface. When real-world data is used to estimate this effect… sea level rise is much worse, and clearly is still accelerating in year 2100 (Vermeer and Ramstorff 2009). And latest (2013). New positive feedbacks (ice albedo drop, Antarctic breakup) suggest this graph is also too optimistic
. And latest (2013). New positive feedbacks (ice albedo drop, Antarctic breakup) suggest this graph is also too optimistic.")
20
These SERDP and NRC Projections are worse
These SERDP and NRC Projections are worse. Scale is meters of sea level rise

21
Eventually…. from Raymo et. al. 2012
(from the paper’s Abstract) - “… observations of Pleistocene shoreline features on the tectonically stable islands of Bermuda and the Bahamas have suggested that sea level about 400,000 years ago was more than 20 meters higher than it is today. Geochronologic and geomorphic evidence indicates that these features formed during interglacial marine isotope stage (MIS) 11, an unusually long interval of warmth during the Ice Ages “Here we show that the elevations of these features are corrected downwards by 10 meters when we account for post-glacial crustal subsidence of these sites over the course of the anomalously long interglacial. On the basis of this correction, we estimate that eustatic sea level rose to 6–13m above the present-day value in the second half of MIS 11. That’s feet of sea level rise This suggests that both the Greenland Ice Sheet and the West Antarctic Ice Sheet (WAIS) collapsed during the protracted warm period while changes in the volume of the East Antarctic Ice Sheet were relatively minor, thereby resolving the long-standing controversy over the stability of the East Antarctic Ice Sheet during MIS 11.” (new in 2014 – confirmation that WAIS is now already in irreversible collapse) Given the permanence of the climate change we are causing, it is likely that a similar collapse of the Greenland and Antarctic ice sheets is also in our future, even with gradual conversion to renewable energy sources.
 - … observations of Pleistocene shoreline features on the tectonically stable islands of Bermuda and the Bahamas have suggested that sea level about 400,000 years ago was more than 20 meters higher than it is today. Geochronologic and geomorphic evidence indicates that these features formed during interglacial marine isotope stage (MIS) 11, an unusually long interval of warmth during the Ice Ages. Here we show that the elevations of these features are corrected downwards by 10 meters when we account for post-glacial crustal subsidence of these sites over the course of the anomalously long interglacial. On the basis of this correction, we estimate that eustatic sea level rose to 6–13m above the present-day value in the second half of MIS 11. That’s feet of sea level rise. This suggests that both the Greenland Ice Sheet and the West Antarctic Ice Sheet (WAIS) collapsed during the protracted warm period while changes in the volume of the East Antarctic Ice Sheet were relatively minor, thereby resolving the long-standing controversy over the stability of the East Antarctic Ice Sheet during MIS 11. (new in 2014 – confirmation that WAIS is now already in irreversible collapse) Given the permanence of the climate change we are causing, it is likely that a similar collapse of the Greenland and Antarctic ice sheets is also in our future, even with gradual conversion to renewable energy sources.")
22
Raymo et al. find: Long Term Sea level Rise is Grim
During interglacial period MIS 11, oxygen-18 temperature proxy data shows global temperatures were ~identical to today’s (source; p 457). Therefore: Allowing temperatures to remain at today’s levels may lead to not just the loss of all permanent Arctic Ocean ice (a process which is now perhaps only a ~decade or two away) but to the melting of all Arctic ice, thence to the large sea level rises seen by Raymo et al. in MIS 11. As we saw, even halting ALL carbon emissions on Earth, still will not lead to temperature reductions Here’s another source on the future of the Arctic…
. Therefore: Allowing temperatures to remain at today’s levels may lead to not just the loss of all permanent Arctic Ocean ice (a process which is now perhaps only a ~decade or two away) but to the melting of all Arctic ice, thence to the large sea level rises seen by Raymo et al. in MIS 11. As we saw, even halting ALL carbon emissions on Earth, still will not lead to temperature reductions. Here’s another source on the future of the Arctic…")
23
Milankovitch insolation (middle graph) predicts stable Northern Hemisphere (NH) ice volume (dotted) at pre-industrial 210 ppm CO2. If instead we continue raising CO2 to ~double present values, all NH ice disappears (dotted curve bottom graph) for about 20,000 years until Milankovitch cooling begins again. source, p. 459
 for about 20,000 years until Milankovitch cooling begins again. source, p")
24
In 2012 for the first time on record, Greenland had surface melting across its entire surface, even the coldest, highest altitude inland locations. Partially melted ice is less reflective, inducing further melting as well. Increasing wildfires are adding dark soot and ash to surface snow as well, especially in See Box et al for the declining albedo of the Greenland ice cap. If/when Greenland melts entirely, it will contribute 23 feet to global sea level.

25
Later (2013) Studies from World Wide Locations Show Sea Level Rise will be Worse
Raymo et al. studied just one location to get these sobering ft sea level rise levels. A year later, Foster and Rohling (2013) published a work consolidating evidence from the past ~40 million years at many locations to determine sea level rise at thermal equilibrium (when climate has finally stabilized at a given new CO2 level) for various CO2 levels They find that at CO2 of 400 ppm (today’s level), sea level will rise at least 9m and most likely ~24m above present levels, due to complete melting of Greenland, and the West Antarctic Ice Sheet (WAIS), and part of the remainder of Antarctica as well. 24m is 80 feet, submerging the large majority of coastal cities and millions of square miles of continental area, including the prime farmland in delta regions worldwide. How will this affect our ability to feed ourselves?
 published a work consolidating evidence from the past ~40 million years at many locations to determine sea level rise at thermal equilibrium (when climate has finally stabilized at a given new CO2 level) for various CO2 levels. They find that at CO2 of 400 ppm (today’s level), sea level will rise at least 9m and most likely ~24m above present levels, due to complete melting of Greenland, and the West Antarctic Ice Sheet (WAIS), and part of the remainder of Antarctica as well. 24m is 80 feet, submerging the large majority of coastal cities and millions of square miles of continental area, including the prime farmland in delta regions worldwide. How will this affect our ability to feed ourselves")
26
Foster & Rohling Paleo Climate shows that 400 ppm CO2 leads to final sea level rise of ~24m (80 ft) above today’s.
 above today’s.")
28
May ‘14 – Collapse of West Antarctic Ice Sheet (WAIS) Has Now Begun
NY Times Article summarizing new published research paper. Warmer waters underneath the ice shelves at the terminus of the West Antarctic glaciers has eaten away at the bottom of the ice mass, disconnecting the grounding line and begun the collapse of the ice sheet. It is now described as “unstoppable”. Thomas Wagner, director of NASA’s Polar Ice Sheets program “There’s nothing that can stop it now”. While most of the cause is the warmer waters surrounding Antarctica due to Greenhouse warming, it is also being exacerbated by enhanced geothermal heating. A spreading zone underlies parts of West Antarctica.

29
West Antarctic Ice Sheet (WAIS) is In a Shallow Ocean Basin
The West Antarctic Ice Sheet is grounded in a shallow ocean basin, which it fills. If that ice melts enough to pull the bottom of the ice off the sea floor, it can no longer resist being pushed by landed ice sheets experiencing gravity, and melt in the warmer oceans. This is now the process we see beginning with these new papers just published (Rignot et al. 2014) This process was predicted back in 1978 by glaciologist John Mercer Sea level rise will almost certainly go up 10’s of meters going forward, the timing depends on our actions.
 This process was predicted back in 1978 by glaciologist John Mercer. Sea level rise will almost certainly go up 10’s of meters going forward, the timing depends on our actions.")
30
Sea Level Rise and Arctic Methane
This is an issue I want to see more research done; I’m not aware that anyone else sees an obvious implication…. Let’s put together some clear trends and some basic physics:

31
1. Sea level will rise many meters over the coming century or two and more beyond that
2. The Arctic ocean is soon to be almost free of summer ice, and only have thin breakable winter ice 3. This will flood much of the Siberian Arctic tundra with water now ABOVE the freezing point 4. We know that warm waters which invaded the Arctic basin with the rise in sea level after the end of the last Ice Age have been contributing to melting of (now) undersea tundra and liberating methane, although so far at levels lower than are being released in tropical areas How will this change atmospheric methane levels? Studies I’ve looked at only consider the direct rise in local temperatures w/o this sea level rise effect.
 undersea tundra and liberating methane, although so far at levels lower than are being released in tropical areas. How will this change atmospheric methane levels Studies I’ve looked at only consider the direct rise in local temperatures w/o this sea level rise effect.")
32
Antarctic Ice Sheets Elevation Profile: Note WAIS sits on a Shallow Ocean Basin, Grounded until Now by the Ridge Line under the Ross Ice Shelf

33
Satellite photo: Breakup of the West Antarctic Ice Sheet Has Begun (May ‘14)
")
35
3. Ocean Acidification

36
21st Century Ocean Acidification
Even using the overly conservative 2007 IPCC AR4 scenarios, by the year 2050 the oceans will be too acidic for the survival of coral reefs, and they will disappear Coral reefs to dissolve when CO2 doubles from pre-industrial levels (Silverman et.al. 2009) Shellfish reproductive failures due to acidification have already arrived. At higher levels, the key parts of the entire food web of the ocean is endangered, as many species of microbes, plants, and animals use aragonite calcium carbonate exoskeletons which cannot be made in too-acidic oceans Loss of calcareous marine life also means significantly reduced ability to convert CO2 into CaCO3 and remove it from the biosphere for geologic time scales. Already, primary productivity in the oceans has dropped significantly over the past century (Boyce et al. 2014)
 Shellfish reproductive failures due to acidification have already arrived. At higher levels, the key parts of the entire food web of the ocean is endangered, as many species of microbes, plants, and animals use aragonite calcium carbonate exoskeletons which cannot be made in too-acidic oceans. Loss of calcareous marine life also means significantly reduced ability to convert CO2 into CaCO3 and remove it from the biosphere for geologic time scales. Already, primary productivity in the oceans has dropped significantly over the past century (Boyce et al. 2014)")
37
From May 2014 News… Ocean acidification is now discovered to be eating away the shells of pteropods off the U.S. West Coast. These form the base of the ocean food chain We’d hoped this might not start till decades later, but… “The process has already begun”

38
Why the Loss of Phytoplankton?
The many possible reasons are not well quantified yet, but it’s clear the main causes are man-made…. 1. Ocean acidification and resulting destruction of carbonate exoskeletons 2. Massive over-fishing has removed predators for jellys, who are coming to dominate the oceans, and eat anything, including phytoplankton 3. Global warming: Hot atmosphere heats ocean from above, causing increased stratification, stronger thermocline and inhibition of upwelling of nutrients to sunlit surface waters where phytoplankton live. 4. Fossil fuel burning is reducing the oxygen content of the atmosphere and oceans, preferentially favoring jellys over fish

39
Welcome your new Overlords?

40
4. Weather Intensity Changes
Warmer Sea Surface Temperatures Mean… --- more evaporation --- stronger vertical air temperature gradient driving convection This drives stronger storms Warmer Air Temperatures Mean… --- air can hold more water vapor, so rain is less frequent. 7% higher saturation humidity per 1 degree C of temperature rise. --- however, when saturation of the air does take place, the rarer resulting rains will be more forceful because of the higher amounts of water --- floods far more common, as higher air temps mean more precip falls as rain now instead of snow, which runs off rapidly rather than being stored for weeks or months as snow in the mountains. We are transitioning from a time of frequent, gentle rains which allow soaking of the soil and plant roots, to a time of rarer rains on parched dry land with less healthy plants, and severe erosion caused by stronger deluges when rain does occur

41
From Coumous and Rahmstorff (2012) : Higher ocean surface temperatures go with stronger tropical storms going forward
 : Higher ocean surface temperatures go with stronger tropical storms going forward")
42
More Severe Weather in Northern Hemisphere
Melting Arctic Ocean ice -> darker surface -> more solar radiation absorbed -> excess heat released especially in Autumn This decreases the temperature gradient and pressure gradient across the jet stream boundary of the Polar Cell between the Arctic and middle latitudes The consequences are…

43
Weaker Polar Cell = Meandering Polar Jet Stream
This diminished north/south pressure gradient is linked to a weakening of the winds associated with the polar vortex (Polar cell) and polar jet stream. This weakened polar jet stream has larger loops in it, and it is these loops especially which cause large storms. The loops also are longer-lived, and as the southern ends can extend further south now, they make for more frequent slow-moving intense winter storms, and at the same time, longer and more extreme heat waves, depending on where you are in these meandering loops Bottom line: The larger “loops” in the polar jet stream mean storms more intense and that storms move slower, delivering more energy to any given location.
 and polar jet stream. This weakened polar jet stream has larger loops in it, and it is these loops especially which cause large storms. The loops also are longer-lived, and as the southern ends can extend further south now, they make for more frequent slow-moving intense winter storms, and at the same time, longer and more extreme heat waves, depending on where you are in these meandering loops. Bottom line: The larger loops in the polar jet stream mean storms more intense and that storms move slower, delivering more energy to any given location.")
44
Negative Arctic Oscillation conditions are associated with higher pressure in the Arctic and a weakened polar vortex (yellow arrows). A weakened jet stream (black arrows) is characterized by larger-amplitude meanders in its trajectory and a reduction in the wave speed of those meanders.
 is characterized by larger-amplitude meanders in its trajectory and a reduction in the wave speed of those meanders..")
45
The Polar Jet Stream and Weather
Dr. Jennifer Francis: A 2 hr lecture on weather and its connection to disappearing polar ice A 5:31 minute section of this larger 2 hr lecture, which covers the why/how of the polar jet stream and how it is changing Good visuals in this video (0:55 to 6:20) interview with Dr. Jennifer Francis
 interview with Dr. Jennifer Francis.")
46
Implications Here in California
Climate model predictions are for increasing drought, more on this later… A key reason we can expect more mega-droughts like the one we’re in now (worst since records began, and worst in 1200 years) is the “polar amplificiation” of the jet stream has pushed it far north, guiding storms that used to hit California also northward.
 is the polar amplificiation of the jet stream has pushed it far north, guiding storms that used to hit California also northward.")
47
5. Methane Release from the Permafrost
How much carbon is there? Exact amount is not known, but the estimated amount … Arctic permafrost contains roughly twice the carbon as is already in the entire atmosphere. Therefore, if ALL of it becomes CO2, it alone would triple the CO2 content, from 400 ppm to 1,200 ppm Is that possible? How long does thaw take?

48
Methane Deposits: Clathrates, permafrost, Arctic lakes, Sub sea clathrates

49
An Ice-free Arctic Ocean Warms the Entire Arctic as Far as 1500 km Inland, Includes Vast Amounts of Methane Stored in the Permafrost. Vaks et al had a clever way to determine the state of the permafrost in Paleo climate – when ground above a limestone cavern is frozen, the speliotherms cannot grow, when melted, dripping water makes them grow. O18/O16 ratios tell temperature at surface. Conclusion: paleo climate records show that Arctic permafrost melts completely when temperatures are only 0.75C warmer than today. As we saw, short of forced removal of CO2 from the atmosphere, temperatures will not go back down, even if we halt all emissions. We are already most of the way to an ice-free summer Arctic Nobel Prize winning Physicist Steven Chu on permafrost methane and climate (1:35 video) Arctic will become major carbon source via methane release from permafrost by 2020’s Shaefer et al. (2011) and summarized here. Finds estimated 30-60% of permafrost will be melted and its methane released by year 2200.
 Arctic will become major carbon source via methane release from permafrost by 2020’s Shaefer et al. (2011) and summarized here. Finds estimated 30-60% of permafrost will be melted and its methane released by year")
50
Rapid loss of Arctic Ocean ice sends temperatures across permafrost lands upward, as far as 1500 km south of the Arctic coast. Arctic Ocean ice is, in fact, already in rapid loss right now

52
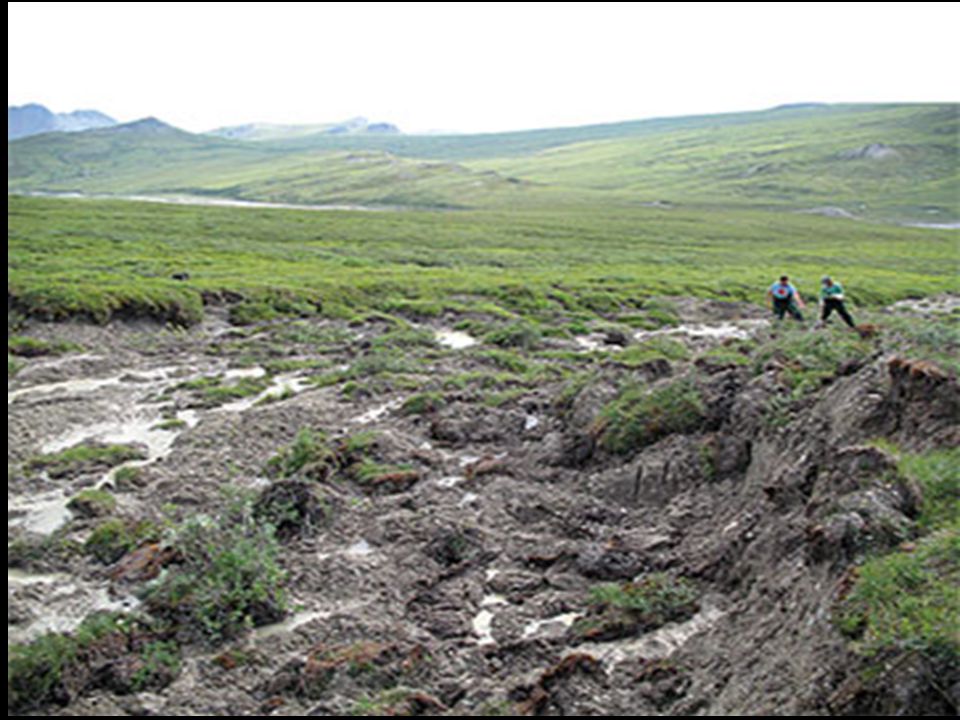
Melting Permafrost Turns Foundations to Mush

53
Will All of This Enter the Atmosphere as Methane?
Probably not Microbes will eat some, converting it to CO2 Sunlight will do the same, and this is actually one of the rare negative feedbacks, as thawing ice will uncover more tundra earlier and expose to sunlight It will slowly oxidize to CO2 and H2O over a ~century time scale Much will remain in the ground as vegetation absorbs it

54
Methane Converts to CO2 and H2O
Methane Converts to CO2 and H2O. “GWP” = Global Warming Potential”; the Climate Forcing Relative to CO2

55
Methane (hydrates) in the Permafrost – Global Climate Implications
The release of methane from the Arctic also contributes to global warming as a result of polar amplification. Alaska now has hot days even in March, as the resistant high pressure ridge drives the polar jet stream north of much of Alaska. Recent observations in the Siberian Arctic show increased rates of methane release from the Arctic seabed.[4] Land-based permafrost, also in the Siberian arctic, was also recently observed to be releasing large amounts of methane, estimated at over 4 million tons – significantly above previous estimates.[11] Atmospheric methane levels are at levels not seen for at least 650,000 years (IPCC ’07), and are over twice the pre-industrial levels.
, and are over twice the pre-industrial levels.")
56
Methane levels stable for the past millenium – until about 1850

57
Methane levels have accelerated far above the regular oscillations during the Ice Ages

58
Methane levels up 17% in just the last 34 years, and re-accelerating in just this past decade

59
Why the Decreasing Methane Rise Rate in the Late 1990’s/early ’00’s?
Slowing methane rise rate in 1990’s is thought to be lowered methane loss from wetlands due to drought, with perhaps some contribution from the breakup of the Soviet Union and resulting lowered production of fossil fuels, (NOAA source). Droughts are expected to increase, yet wetland methane emissions are not predicted to continue to slow, because wetlands are now growing in the far north, as the permafrost now begins accelerated melting, responding to the large and accelerating loss of Arctic Ocean ice. Since methane oxidizes to CO2 with a half life of roughly 10 years, without methane release from fossil fuels and from other sources, methane levels would drop fairly quickly. See table on next page. However, the source/sink actual numbers vary somewhat between different studies by different authors (see IPCC 2007)
. Droughts are expected to increase, yet wetland methane emissions are not predicted to continue to slow, because wetlands are now growing in the far north, as the permafrost now begins accelerated melting, responding to the large and accelerating loss of Arctic Ocean ice. Since methane oxidizes to CO2 with a half life of roughly 10 years, without methane release from fossil fuels and from other sources, methane levels would drop fairly quickly. See table on next page. However, the source/sink actual numbers vary somewhat between different studies by different authors (see IPCC 2007)")
60
From Houweling et.al. 1999 However the imbalance has recently clearly increased

61
The Bad News… Current methane release has previously been estimated at 0.5 Million tons (Mt) per year.[12] Shakhova et al. (2008) estimate that not less than 1,400 Gt of carbon is presently locked up as methane and methane hydrates under the Arctic submarine permafrost, and 5-10% of that area is subject to puncturing by open taliks In the very unlikely case that it would all enter our atmosphere at once, that would increase the methane content of the planet's atmosphere by a factor of twelve.[13] Wording note: “methane clathrate” = “methane hydrate” in our context In 2008 the United States Department of Energy National Laboratory system[14] identified potential clathrate destabilization in the Arctic as one the most serious scenarios for abrupt climate change, which have been singled out for priority research. The U.S. Climate Change Science Program released a report in late December 2008 estimating the gravity of the risk of clathrate destabilization, alongside three other credible abrupt climate change scenarios.[15] However, more recent work finds the risk of clathrate catastrophic (i.e. rapid) destabilization to be small, due to the depth, slow heat flow, and need for latent heat of fusion to be included before release can happen.
 per year.[12] Shakhova et al. (2008) estimate that not less than 1,400 Gt of carbon is presently locked up as methane and methane hydrates under the Arctic submarine permafrost, and 5-10% of that area is subject to puncturing by open taliks. In the very unlikely case that it would all enter our atmosphere at once, that would increase the methane content of the planet s atmosphere by a factor of twelve.[13] Wording note: methane clathrate = methane hydrate in our context. In 2008 the United States Department of Energy National Laboratory system[14] identified potential clathrate destabilization in the Arctic as one the most serious scenarios for abrupt climate change, which have been singled out for priority research. The U.S. Climate Change Science Program released a report in late December 2008 estimating the gravity of the risk of clathrate destabilization, alongside three other credible abrupt climate change scenarios.[15] However, more recent work finds the risk of clathrate catastrophic (i.e. rapid) destabilization to be small, due to the depth, slow heat flow, and need for latent heat of fusion to be included before release can happen.")
62
Taliks expand the area of unfrozen permafrost, over time

63
Worse… NewScientist states that "Since existing models do not include feedback effects such as the heat generated by decomposition, the permafrost could melt far faster than generally thought.” [20]

64
Schaefer et. al. (2011). Carbon released as CH4 (methane), which converts to CO2 + H2O over time. Because of this reaction, it is 25 times more powerful as GHG averaged over a century, but 72x more powerful when averaged over 20 years. This means that if there is abrupt, large release of methane from destabilization, it is a far more powerful climate forcer than if released slowly over many decades. This study assumed human carbon emissions end in the year Note that permafrost carbon flux remains positive (although decreasing) even after human carbon emissions are assumed to stop in 2100
 even after human carbon emissions are assumed to stop in")
65
From Shaefer et al. (2011) - Conclusions Section Quoted Here…
“The thaw and release of carbon currently frozen in permafrost will increase atmospheric CO2 concentrations and amplify surface warming to initiate a positive permafrost carbon feedback (PCF) on climate…. [Our] estimate may be low because it does not account for amplified surface warming due to the PCF itself…. We predict that the PCF will change the Arctic from a carbon sink to a source after the mid-2020s and is strong enough to cancel 42-88% of the total global land sink.” (RN: Recall from our Carbon Cycle lectures that land+ocean take up about half of human-caused CO2 emissions currently) “The thaw and decay of permafrost carbon is irreversible and accounting for the permafrost carbon feedback will require larger reductions in fossil fuel emissions to reach a target atmospheric CO2 concentration.”
 on climate…. [Our] estimate may be low because it does not account for amplified surface warming due to the PCF itself…. We predict that the PCF will change the Arctic from a carbon sink to a source after the mid-2020s and is strong enough to cancel 42-88% of the total global land sink. (RN: Recall from our Carbon Cycle lectures that land+ocean take up about half of human-caused CO2 emissions currently) The thaw and decay of permafrost carbon is irreversible and accounting for the permafrost carbon feedback will require larger reductions in fossil fuel emissions to reach a target atmospheric CO2 concentration.")
66
You May be Wondering… So…the Arctic is currently a carbon SINK?
Yes; one of the effects of global warming is that the thawing Arctic can support increased vegetation and trees. These take up atmospheric CO2 But Shaefer et al is finding that even though this trend will continue for a few more years, it will be overwhelmed by the Permafrost Carbon Feedback.

67
The Arctic loses essentially all of its permafrost within ~200 years (SvD 2012)
")
68
2,400 simulations of methane and CO2 release from thawing permafrost, and resulting global temperatures (SvD 2012)
")
69
The permafrost carbon feedback is irreversible on human time scales
The permafrost carbon feedback is irreversible on human time scales. With less near-surface permafrost, the burial mechanism described above slows down or stops, so there is no way to convert the atmospheric CO2 into organic matter and freeze it back into the permafrost. Warmer conditions and increased atmospheric CO2 will enhance plant growth that will remove CO2 from the atmosphere (Friedlingstein et al. 2006), but this can only to a small degree compensate for the much greater carbon emissions from thawing permafrost. Warmer conditions could promote peat accumulation, as seen after the end of the last ice age, but it is not clear if this would remove enough CO2 from the atmosphere to compensate for CO2 released from thawing permafrost. The effect of permafrost carbon feedback on climate has not been included in the IPCC Assessment Reports. None of the climate projections in the IPCC Fourth Assessment Report include the permafrost carbon feedback (IPCC 2007). Participating modeling teams have completed their climate projections in support of the Fifth Assessment Report, but these projections also do not include the permafrost carbon feedback. Consequently, the current IPCC Fifth Assessment Report also does not include the potential effects of the permafrost loss.
, but this can only to a small degree compensate for the much greater carbon emissions from thawing permafrost. Warmer conditions could promote peat accumulation, as seen after the end of the last ice age, but it is not clear if this would remove enough CO2 from the atmosphere to compensate for CO2 released from thawing permafrost. The effect of permafrost carbon feedback on climate has not been included in the IPCC Assessment Reports. None of the climate projections in the IPCC Fourth Assessment Report include the permafrost carbon feedback (IPCC 2007). Participating modeling teams have completed their climate projections in support of the Fifth Assessment Report, but these projections also do not include the permafrost carbon feedback. Consequently, the current IPCC Fifth Assessment Report also does not include the potential effects of the permafrost loss.")
70
A Very Different Planet For Future Generations of Life on Earth
“We find that simulated western Arctic land warming trends during rapid sea ice loss are 3.5 times greater than secular 21st century climate-change trends. The accelerated warming signal penetrates up to 1500 km inland…. “ (Lawrence et al. 2007) From the study of Schneider von Deimling et al shown in the last slide – the resulting global temperature rise does not begin to stabilize until the Earth has warmed by +10 degrees Celsius. 10C = 18F. 18 degrees Fahrenheit global warming, This is TWICE again beyond the temperature rise we’ve already seen since the depths of the last great Ice Age. A very different planet Earth, on which large areas currently supporting billions of people, become uninhabitably hot for humans
 From the study of Schneider von Deimling et al shown in the last slide – the resulting global temperature rise does not begin to stabilize until the Earth has warmed by +10 degrees Celsius. 10C = 18F. 18 degrees Fahrenheit global warming, This is TWICE again beyond the temperature rise we’ve already seen since the depths of the last great Ice Age. A very different planet Earth, on which large areas currently supporting billions of people, become uninhabitably hot for humans.")
71
A Different Planet Earth, Less Friendly to Human Life…
What would such temperature rises mean for the habitability of Earth? Sherwood and Huber (2010) in the Publications of the National Academy of Sciences find: (quoted from the abstract)… “Peak heat stress, quantified by the wet-bulb temperature (TW), is surprisingly similar across diverse climates today. TW never exceeds 31 °C. Any exceedence of 35 °C (95 F) for extended periods should induce hyperthermia in humans and other mammals, as dissipation of metabolic heat becomes impossible. While this never happens now, it would begin to occur with global-mean warming of about +7 °C, calling the habitability of some regions into question. “With 11–12 °C warming, such regions would spread to encompass the majority of the human population as currently distributed. Eventual warmings of 12 °C are possible from fossil fuel burning.” Pause. And re-read. +7C is a very real possibility by the end of THIS century.
 in the Publications of the National Academy of Sciences find: (quoted from the abstract)… Peak heat stress, quantified by the wet-bulb temperature (TW), is surprisingly similar across diverse climates today. TW never exceeds 31 °C. Any exceedence of 35 °C (95 F) for extended periods should induce hyperthermia in humans and other mammals, as dissipation of metabolic heat becomes impossible. While this never happens now, it would begin to occur with global-mean warming of about +7 °C, calling the habitability of some regions into question. With 11–12 °C warming, such regions would spread to encompass the majority of the human population as currently distributed. Eventual warmings of 12 °C are possible from fossil fuel burning. Pause. And re-read. +7C is a very real possibility by the end of THIS century.")
72
But there is more… …. more that has not been included in the IPCC AR4 (2007) studies…
 studies…")
73
There are More Methane Deposits to Consider Besides Those at the Poles
Methane hydrates along deep and shallow continental shelf ocean basins. Methane hydrates are held in stability by high pressure and low temperature. Higher temperature OR lower pressure on these deposits can destabilize them, causing explosion as it transitions to a gas. Further, the energy release in decomposition (CH4+O2 = CO2 + H20 + heat) adds further to the climate forcing
 adds further to the climate forcing.")
74
As ocean temps rise, methane hydrate turns to a gas, rising into the atmosphere. While meltwater addition to sea level would add pressure, which helps keep it as methane hydrate, it will not be sufficient to counterbalance higher temps, it is calculated.

75
Methane Release from Sea Floor Methane Hydrates?
Methane hydrate is less dense than water; it therefore floats. This is not good. Release of only 10% of this store would cause climate forcing 10 times that which CO2 is doing today. How stable? Not well studied yet. But see Archer, D. (2007) Probably Arctic methane clathrate release cannot be abrupt, since the pressure necessary for clathrates is only found at 350 m depth and greater, and this is far below the sea bottom of the Arctic, where warming is greatest. Heat transmission to these must be very slow.
 Probably Arctic methane clathrate release cannot be abrupt, since the pressure necessary for clathrates is only found at 350 m depth and greater, and this is far below the sea bottom of the Arctic, where warming is greatest. Heat transmission to these must be very slow.")
76
How are the Oil Companies thinking about Methane Hydrates?
I leave how Big Oil is pondering methane hydrates as a brief “gedanken experiment” (a “thought experiment”) for the student…
 for the student…")
77
OK. Here’s the Answer… Fossil fuel corporations are investing hundreds of millions of dollars into exploratory work for mining methane hydrates as a fuel source. To say the least, this is amazing…. methane hydrate destabilization caused the Deepwater Horizon Explosion and resulting Oil Disaster in the Gulf of Mexico in 2010

78
2010 Deepwater Horizon Oil Disaster, from Satellite Photo

79
So, That was bad. But since then, the Oil Companies surely learned how to drill safely….
…..right?

80
Shell Oil’s Alaskan drilling rig wrecked by storms Dec 31, 2012

81
Maybe Shell Oil and the Others Should have Considered…
…That since they’ve helped the Arctic lose most of its sea ice, and is projected soon to lose all of it’s summer sea ice – that Arctic Ocean waves which had been tiny due to the small fetch for wind-driven wave formation, are rapidly getting more powerful given all that new open water …Arctic storms will strengthen, and so the summer season (the only season when oil drilling can happen), will be much more dangerous for drilling than it is now.
, will be much more dangerous for drilling than it is now.")
82
Methane Hydrate Release to the Atmosphere - Effect on Climate?
I’ve not found a paper which includes climate modelling of global temperatures while including release of methane clathrates. This means that these current models are not including this effect and should be considered “conservative” (i.e. things could get significantly worse than already described). Methane release from the Arctic is simply not well enough studied yet. We don’t have enough monitoring stations, and release rates so far as we have see, can vary on short time scales by large amounts. Climatologist David Archer has argued that most or all of Arctic methane clathrates must be (to have formed in a stable way in the first place) deep enough under sediments or the ocean surface that heat flow to cause their melting must be very slow, so abrupt climate change from Arctic Ocean clathrates is not a significant danger. But ongoing slower methane release could very well be unstoppable given our climate forcing. So the question is – how much should we care about future generations and centuries and millenia from now, who will not have the chance for a climate like the one civilization evolved in? This is a moral problem.
. Methane release from the Arctic is simply not well enough studied yet. We don’t have enough monitoring stations, and release rates so far as we have see, can vary on short time scales by large amounts. Climatologist David Archer has argued that most or all of Arctic methane clathrates must be (to have formed in a stable way in the first place) deep enough under sediments or the ocean surface that heat flow to cause their melting must be very slow, so abrupt climate change from Arctic Ocean clathrates is not a significant danger. But ongoing slower methane release could very well be unstoppable given our climate forcing. So the question is – how much should we care about future generations and centuries and millenia from now, who will not have the chance for a climate like the one civilization evolved in This is a moral problem.")
83
6. Crop Yields Drop Under Climate Change

84
+3C Temps Mean Most of Earth Has Poorer (in red) Crop Yields
+3C Temps Mean Most of Earth Has Poorer (in red) Crop Yields. Exceptions: Canada, Russia, New Zealand, Chile
 Crop Yields. Exceptions: Canada, Russia, New Zealand, Chile.")
85
Already, Yields of the Staple Crops which Feed Most of Earth, Are Beginning to Decline, having peaked 10 years ago

86
These Only Consider the Effect of Drought and Temperature on Crops – What about Soil?
We’re destroying our topsoil at an amazingly fast rate of 1% per year Topsoil replacement rate: 1 cm/1000 yrs by geology, (assuming healthy plant cover) With current commercial Ag techniques, which strip soil of nutrients and prevent “weeds” from holding soil in rain, a new study shows that farming can survive for only another 60 years. The amount of arable land per person will drop by 2050 to only ¼ of what it was in 1950, What’ll we eat then? We’ve already eaten over 90% of all large fish in the ocean, and phytoplankton is dropping, both from warmer surface waters and growing acidity.
 With current commercial Ag techniques, which strip soil of nutrients and prevent weeds from holding soil in rain, a new study shows that farming can survive for only another 60 years. The amount of arable land per person will drop by 2050 to only ¼ of what it was in 1950, What’ll we eat then We’ve already eaten over 90% of all large fish in the ocean, and phytoplankton is dropping, both from warmer surface waters and growing acidity.")
87
7. Regional Climate in the Future: Drought over the populous zones, increased rain over the equatorial oceans, and poles (UN report). This Figure is from the IPCC AR4 and therefore too optimistic, as we’ve seen
. This Figure is from the IPCC AR4 and therefore too optimistic, as we’ve seen.")
88
California Forecast: Drought
Oster et al studied stalagmites from Moaning Cavern, CA; age dated via Uranium/Thorium ratio, and temperature, rainfall data from other element ratios, and correlated with Arctic from existing paleoclimate records… They find… that when the Arctic Ocean thaws, we get drought in California, as the polar jet stream migrates north, according to climate models (yes, it “wiggles” more, but the average position of the polar jet stream is farther north) That is exactly what we are already seeing now.
 That is exactly what we are already seeing now.")
89
A Decade ago, UCSC’s climatologist Lisa Sloan, modelling future climate, predicted that a Strong Persistent High Pressure Ridge would Develop in the North (Sewall and Sloan 2005 in GRL

90
It is the Loss of Arctic Ocean Ice Which Causes This Pattern.
Co-Author Jacob Sewall: “Where the sea ice is reduced, heat transfer from the ocean warms the atmosphere, resulting in a rising column of relatively warm air.The shift in storm tracks over North America was linked to the formation of these columns of warmer air over areas of reduced sea ice. Both the pattern and even the magnitude of the anomaly looks very similar to what the models predicted in the 2005 study.”

91
These predictions are coming true, faster than had been thought
These predictions are coming true, faster than had been thought. Here is the height of the 500mb air pressure, averaged over all of 2013.

92
Sloan: “Yes, in this case I hate that we (Sewall & Sloan) might be correct. And in fact, I think the actual situation in the next few decades could be even more dire that our study suggested. Why do I say that? (1) we did not include changes in greenhouse gases other than CO2; (2) maybe we should have melted more sea ice and see what happens; (3) these atmospheric and precipitation estimates do not include changes in land use, in the US and elsewhere. Changing crops, or urban sprawl increases, or melting Greenland and Northern Hemisphere glaciers will surely have an impact on precipitation patterns.”
 we did not include changes in greenhouse gases other than CO2; (2) maybe we should have melted more sea ice and see what happens; (3) these atmospheric and precipitation estimates do not include changes in land use, in the US and elsewhere. Changing crops, or urban sprawl increases, or melting Greenland and Northern Hemisphere glaciers will surely have an impact on precipitation patterns.")
93
Worsening Droughts – U.S. Southwest (blue curve)
")
94
Less Rain, Snow, Reservoirs Dry up

95
Droughts: Just Getting Started?

96
The Five Mechanisms by Which a Warming World Accentuates Drought
1. In a warming world, a larger fraction of total precipitation falls in downpours, which means a larger fraction is lost to storm runoff (as opposed to being absorbed in soil). 2. In mountain regions that are warming, as most are, a larger fraction of precipitation falls as rain rather than as snow, which means far more rapid run-off 3. What snowpack there is, melts earlier in a warming world, further reducing flows later in the year. 4. Where temperatures are higher, losses of water from soil and reservoirs due to evaporation are likewise higher than they would otherwise be. 5. Most dominant – there is simply less precipitation of any kind, over land. Increased precipitation is predicted only for the far Arctic north, and over the oceans, not where people actually live, which is on land.
. 2. In mountain regions that are warming, as most are, a larger fraction of precipitation falls as rain rather than as snow, which means far more rapid run-off. 3. What snowpack there is, melts earlier in a warming world, further reducing flows later in the year. 4. Where temperatures are higher, losses of water from soil and reservoirs due to evaporation are likewise higher than they would otherwise be. 5. Most dominant – there is simply less precipitation of any kind, over land. Increased precipitation is predicted only for the far Arctic north, and over the oceans, not where people actually live, which is on land.")
97
Climate Change - California
Dept of Interior report 2011 for western U.S. California – climate model results UC San Diego (Dettinger 2011) Different economic and emission scenarios share the modelling assumptions and nomenclature of the unfortunately too conservative IPCC, namely….
 Different economic and emission scenarios share the modelling assumptions and nomenclature of the unfortunately too conservative IPCC, namely….")
98
California is Losing its Majestic Large Trees
This study in PNAS (McIntyre et al. 2014), and discussed here, finds that in all areas of California, the great trees are gone or dying There is a 50% decline of all trees larger than 2 ft in diameter in all areas of California surveyed, except for the Central and South Coast, since 1930. This is due to drought, land use, and fire road cutting
, and discussed here, finds that in all areas of California, the great trees are gone or dying. There is a 50% decline of all trees larger than 2 ft in diameter in all areas of California surveyed, except for the Central and South Coast, since This is due to drought, land use, and fire road cutting.")
99
For Reference: IPCC Nomenclature for Future Scenarios
A1 = The A1 scenarios are of a more integrated world. The A1 family of scenarios is characterized by: Rapid economic growth. A global population that reaches 9 billion in 2050 and then gradually declines. The quick spread of new and efficient technologies. A convergent world - income and way of life converge between regions. Extensive social and cultural interactions worldwide. There are subsets to the A1 family based on their technological emphasis: ---A1FI - An emphasis on fossil-fuels (Fossil Intensive). ---A1B - A balanced emphasis on all energy sources. ---A1T - Emphasis on non-fossil energy sources. A2 = world economy consolidating within their regions, slower trade, no narrowing of economic gap between “haves” and “have nots”. High-income but resource-poor regions shift toward advanced post-fossil technologies (renewables or nuclear), while low-income resource-rich regions generally rely on older fossil technologies. Final energy intensities in A2 decline with a pace of 0.5 to 0.7% per year.
. ---A1B - A balanced emphasis on all energy sources. ---A1T - Emphasis on non-fossil energy sources. A2 = world economy consolidating within their regions, slower trade, no narrowing of economic gap between haves and have nots . High-income but resource-poor regions shift toward advanced post-fossil technologies (renewables or nuclear), while low-income resource-rich regions generally rely on older fossil technologies. Final energy intensities in A2 decline with a pace of 0.5 to 0.7% per year.")
100
IPCC “B” Scenarios – More Environmentally Friendly
B1 = The B1 scenarios are of a world more integrated, and more ecologically friendly. The B1 scenarios are characterized by: Rapid economic growth as in A1, but with rapid changes towards a service and information economy. Population rising to 9 billion in 2050 and then declining as in A1. Reductions in material intensity and the introduction of clean and resource efficient technologies. An emphasis on global solutions to economic, social and environmental stability. B2 = The B2 scenarios are of a world more divided, but more ecologically friendly. The B2 scenarios are characterized by: Continuously increasing population, but at a slower rate than in A2. Emphasis on local rather than global solutions to economic, social and environmental stability. Intermediate levels of economic development. Less rapid and more fragmented technological change than in A1 and B1.

101
Summary Predictions for Year 2100 from Interior Dept. Report
Assumes “Business as Usual” A temperature increase of +5-7 degrees C; A precipitation increase over the northwestern and north-central portions of the western United States and a decrease over the southwestern and south-central areas; A decrease for almost all of the April 1st Western snowpack, a standard benchmark measurement used to project river basin runoff; and An 8 to 20 percent decrease in average annual stream flow in several river basins, including the Colorado, the Rio Grande, and the San Joaquin (all of which are already 100% used up before reaching the ocean) These predictions, however, do not include the effects of methane release, polar amplification, newly identified positive feedbacks from the Arctic, and are almost certainly therefore too optimistic.
 These predictions, however, do not include the effects of methane release, polar amplification, newly identified positive feedbacks from the Arctic, and are almost certainly therefore too optimistic.")
102
Top two panels – A2 Scenario
Top two panels – A2 Scenario. Night temps rise by 3-5C near coast, and 5-7C in desert inland. Drought areas focus on Northern California; 30-40cm/yr loss by 2100 in coastal mtns and Sierra. Bottom two panels – B1 Scenario. Night temps rise only 1-2C, drought still severe in Sierra, less so in northern coastal mountains vs. A2 scenario (Dettinger 2011)
")
103
IPCC Climate Scenario A2 – Predictions for Us, in Northern California
IPCC Climate Scenario A2 – Predictions for Us, in Northern California. Annual mean, and broken up into winter, and summer months. Summer temps rise 8C from early 20th Century (!), and more than winter temps
, and more than winter temps.")
104
Bay Area Sea Level Rise. Purple is 1
Bay Area Sea Level Rise. Purple is 1.4m rise prediction, which is quite likely to be too conservative

105
Climate Sensitivity to CO2 doubling and Positive Feedbacks – Underestimated it seems
And exactly how sensitive is climate to a doubling of CO2 levels? Pagani et. al. (2006) argue that to explain the Paleocene-Eocene Thermal Maximum seems to require a much higher sensitivity of global temperatures to a CO2 doubling than had been previously assumed. This argues that positive feedbacks (methane release, and clouds) are more powerful than the base case assumes. This conclusion is also consistent with the work of Fasullo et. al. (2012), who finds that it is the most "alarming" climate models which do the best job of predicting what we have already seen. (See an interview with Fasullo on this work here).
 argue that to explain the Paleocene-Eocene Thermal Maximum seems to require a much higher sensitivity of global temperatures to a CO2 doubling than had been previously assumed. This argues that positive feedbacks (methane release, and clouds) are more powerful than the base case assumes. This conclusion is also consistent with the work of Fasullo et. al. (2012), who finds that it is the most alarming climate models which do the best job of predicting what we have already seen. (See an interview with Fasullo on this work here).")
106
ECS = Equilibrium Climate Sensitivity
Equilibrium climate sensitivity of global average temperature for a doubling (i.e. 560 ppm) of pre-industrial CO2 levels, from the PALEOSENS collaboration. Uses Paleo climate data from warm, and higher CO2, epochs of the past hundred million years +3 to +4C temperature rise is the general conclusion
 of pre-industrial CO2 levels, from the PALEOSENS collaboration. Uses Paleo climate data from warm, and higher CO2, epochs of the past hundred million years. +3 to +4C temperature rise is the general conclusion.")
107
El Nino / Southern Oscillation: Another Positive Feedback?
Recent work (Li et al. 2013) building on similar work earlier, uses tree ring data and other cross-correlations with climate proxies to reconstruct the ENSO modulations of the past ~800 years Find that ENSO is skewing in the late 20th century, with the warm El Nino phase predominating over the cooler La Nina phase - likely due to the strong ocean heating that GHG’s are delivering. The amplitude of the swing from El Nino to La Nina is more uncertain, but climate models on average show little change (Collins et al. 2010) Li et al. conclude: “If the El Nino phase continues to become more dominant, it suggests another positive feedback which worsens future climate heating, and should be included in future climate modelling.”
 building on similar work earlier, uses tree ring data and other cross-correlations with climate proxies to reconstruct the ENSO modulations of the past ~800 years. Find that ENSO is skewing in the late 20th century, with the warm El Nino phase predominating over the cooler La Nina phase - likely due to the strong ocean heating that GHG’s are delivering. The amplitude of the swing from El Nino to La Nina is more uncertain, but climate models on average show little change (Collins et al. 2010) Li et al. conclude: If the El Nino phase continues to become more dominant, it suggests another positive feedback which worsens future climate heating, and should be included in future climate modelling.")
108
Seriously underestimated IPCC AR3 projections are still disastrous
Seriously underestimated IPCC AR3 projections are still disastrous. Observed change is as bad or worse than the “worst case” = A2 scenario (SRES=IPCC “Special Report on Emission Scenarios”

109
The Future… Grim, especially if “Business as Usual”
What will be the response of civilization as this rapid ecological change accelerates in coming years? World wars have started over much less. Fighting over desires or status is one thing.... perhaps tempers can be calmed.. But fighting over basic food, water, and the very existence or habitability of the land you live on, is quite another. The +6 C global temperature rise which is now a serious prediction for the end of the 21st century or soon thereafter, is larger than the +5 C global temperature difference between the depths of the last great Ice Age, and the current warm interglacial, before human-caused global warming. As we saw, we could double that to +12 C with rapid Arctic methane release. +12C world would be one in which humans would, for the most part, die Thermal forcing equilibrium is reached only after several centuries, even if CO2 levels kept constant.

110
India, China, Pakistan, Mexico, Brazil and more, could become uninhabitably hot due to the irreversible climate change tipping points we’re passing ~now or in the very near future. Do you suppose they’ll simply quietly pass into history, or will those billions of people fight for a place in the regions still able to support human life? Also, coastlines will be constantly changing as seas rise, for thousands of years. How will we build ports and other necessary coastal facilities without stable coastlines?

111
Meltwater Pulse 1A Coming out of the last Ice Age, about 13,000 years ago, sea levels rose at a rate of 1 meter per decade, for 200 years. This was an orbital change driven warming (the Milankovitch cycles). We’re applying a climate forcing now which much larger. Will we see periods of sea level rise rate which are comparable? Quite possible. That would mean: no buildable stable coastlines for thousands of years.
. We’re applying a climate forcing now which much larger. Will we see periods of sea level rise rate which are comparable Quite possible. That would mean: no buildable stable coastlines for thousands of years.")
112
How Can Such Weak Milankovitch Forcings Lead to Long periods of such Rapid Sea Level Rise?
New research may be part of the answer… CO2 recently discovered to be a “corrosive” which accelerates propagation of cracks in ice by attacking the hydrogen bonds (Buehler et al. in Journal of Physics D: Applied Physics 2013 and summarized here. Higher CO2 levels expected, therefore, to accelerate cracking and dissolution of ice, leading to more surface area exposed to the warm air and water after cracking CO2 rose coming out of the Ice Ages, but it is rising hundreds of times faster now, with fossil fuel burning. This may also be part of the explanation for why our ice caps are crumbling into the ocean much faster than we had earlier expected.

113
Global temperatures since the depths of the last Ice Age; Observed (blue), current and predicted (red)
, current and predicted (red)")
114
There are a few Plant Species which are more Carbon-limited and will do very well in the Coming Earth…Especially Poison Oak

115
New Studies Also Find that Spiders will get Bigger, and Faster
New Studies Also Find that Spiders will get Bigger, and Faster. So we have that to look forward to.

116
Evolution and Adaptation?
– it can be done… but only when there is TIME to evolve. We don’t have that time… The time scale problem and thermal inertia means strong change must happen long before the most severe consequences manifest. Rapid change, whether by asteroid impact, or rapid climate change, means extinctions. This is the message of the paleo record ”Has the Earth’s Sixth Mass Exctinction Already Arrived?” Barnofsky et al Nature vol. 471) and mass extinction in the oceans here
 and mass extinction in the oceans here.")
117
Correlation is causation, in this case
Correlation is causation, in this case. Species extinction rates are accelerating much more rapidly than human population. This is only the last 200 years

118
Inevitable food price hikes devastate poorer countries, leading to riots, and revolutions. Expect the trend to accelerate as drier soils hurt nitrogen fixation and the “Green Revolution” can’t keep up

119
This is all BAD. But, could it be Infinitely Worse Still?
The ultimate in bad outcomes would be a “Runaway Greenhouse Effect”. The Runaway Greenhouse would look something like this: We continue adding CO2 to atmosphere, with positive feedback from water vapor, and the steamy climate is further accelerated by increased cirrus clouds, methane release in large quantities, followed by destabilized methane hydrates from the melting Arctic continental shelf, and temperatures accelerate until the oceans boil away, raising water-vapor induced greenhouse to maximum extent possible. Water vapor is dissociated by solar UV and water disappears from our planet. Venus suffered this fate Runaway Greenhouse means: Extinction of all life on Earth Do we run this risk?

120
Probably Not For a Long Time.
Goldblatt and Watson (2012) find a runaway Greenhouse is very unlikely, but with an important caveat – - We do not know how positive are the feedbacks from clouds when temperatures rise substantially. They find it is unlikely, but within possibility that we could trigger a runaway greenhouse with continued CO2 release. While CO2 levels have been higher in the distant past, recall that solar luminosity was also reduced in the distant past. And too, the RATE at which we are inducing CO2-forcing is unprecedented. However, there is increasing evidence and theory supporting that cloud changes in a warming world are indeed a positive feedback (Sherwood et al. 2013)
 find a runaway Greenhouse is very unlikely, but with an important caveat – - We do not know how positive are the feedbacks from clouds when temperatures rise substantially. They find it is unlikely, but within possibility that we could trigger a runaway greenhouse with continued CO2 release. While CO2 levels have been higher in the distant past, recall that solar luminosity was also reduced in the distant past. And too, the RATE at which we are inducing CO2-forcing is unprecedented. However, there is increasing evidence and theory supporting that cloud changes in a warming world are indeed a positive feedback (Sherwood et al. 2013)")
121
The Earth is near the inside edge of the Habitable Zone for our Solar System, close to the “Runaway Greenhouse” limit (However, not nearly as close as shown here in these simple cloud-free models). We survive here despite the Sun’s rising evolutionary luminosity because, on a geologic time scale, we have so little greenhouse gas left in our atmosphere.

122
Can We Hope? Maybe? Perhaps extremely powerful computers later this century will show us how to preserve our lifestyles, so we don’t have to make hard changes. Will computers save us?

123
…Maybe Not… Note that China, rapidly rising with aspirations to be the most dominant country on Earth, already has deployed “Skynet” (yes, that’s what it’s called), “Hooked into everything” including 20 million spy cameras, Except, their air pollution is so bad Skynet is having a hard time seeing through it. Their solution? Alter Skynet’s wavelength sensitivities to allow it to still search out and identify “dissidents” efficiently targeted for “termination” in the “black jails”? (click link))
, Hooked into everything including 20 million spy cameras, Except, their air pollution is so bad Skynet is having a hard time seeing through it. Their solution Alter Skynet’s wavelength sensitivities to allow it to still search out and identify dissidents efficiently. targeted for termination in the black jails (click link))")
124
SkyNet – Hooked into 20 million Spy Cameras and Facial Recognition Software

125
Steven Hawking and Other Top Physicists and Computer Scientists Observe…
“World militaries” are working on “autonomous-weapon systems which will decide on their own targets and… eliminate them.” Hey, sure! Why not? What could possibly go wrong with that?

126
They Continue… “One can imagine such technology outsmarting financial markets, out-inventing human researchers, out-manipulating human leaders, and developing weapons we cannot even understand. Whereas the short-term impact of Artificial Intelligence depends on who controls it, the long-term impact depends on whether it can be controlled at all.” Out-manipulating human leaders? But our political systems insure that only the most brilliant people become our leaders…. Right? So hey, why not? What could possibly go wrong?

127
Elon Musk is also Worried….
“I Hope we’re not just the biological boot-loader to digital super-intelligence” At the link, the blogger’s exploration of this after the article is also worth reading …Elon Musk, Steven Hawking, Nobel Prize winning Physicist Frank Wilcek…. These aren’t your average paranoid conspiracy loons… So, as we progress towards silicon-based artificial brains, all this is worth pondering.

128
John Connor! Please Call

129
Is This Going to Be Our Bottom Line?

130
Key Points – Future Climate
Climate change is permanent if CO2 remains in the atmosphere, even if further emissions are halted. Essential to remove CO2 quickly from the atmosphere to prevent this. IPCC AR4 far too conservative in assumptions IPCC scientists are good, IPCC policy statements MUST get signed off by politicians and the (fortunately very few) oil-sponsored scientists as well, tends to water down the conviction and objective estimates to the minimum that can get signed off. Using fitted Greenland glacier data in climate modelling indicates much higher sea level rise by 2100 (see graph) Ultimate equilibrium sea level rise if CO2 remains at 400ppm is ~24 meters Temperature rise going forward 90 years is comparable to that rising out of the last Great Ice Age ~20,000 yrs ago. Temperature and ice, sea level change does not stabilize for many centuries Ocean acidification could doom all aragonite calcarious species this century, which provide a significant base for the global food chain. Extinction of aragonite species would lower the ocean’s ability to turn dissolved CO2 into harmless CaCO3, further reducing ocean CO2 uptake. California climate change, temps higher, rainfall lower, snowpack much lower. Global regional forecast – stronger rain over the oceans, drought over populated mid latitudes, expanding deserts. Arctic warming the fastest and most dramatic. Arctic is warming ~8x faster than lower latitudes Extinction rate accelerating even faster than human population rise, rate changes highly correlated – half of all species of life on Earth expected to be gone this century Runaway Greenhouse very unlikely, but can’t be ruled out since, in part, the RATE of climate change is unprecedented Arctic tundra methane release could add to greenhouse effect significantly, perhaps this is the worst feedback ultimately. Methane clathrates unlikely to have abrupt methane release, despite early fears of Dr. Shahkova, due to high depth of Arctic clathrates and slow heat transmission there.
 oil-sponsored scientists as well, tends to water down the conviction and objective estimates to the minimum that can get signed off. Using fitted Greenland glacier data in climate modelling indicates much higher sea level rise by 2100 (see graph) Ultimate equilibrium sea level rise if CO2 remains at 400ppm is ~24 meters. Temperature rise going forward 90 years is comparable to that rising out of the last Great Ice Age ~20,000 yrs ago. Temperature and ice, sea level change does not stabilize for many centuries. Ocean acidification could doom all aragonite calcarious species this century, which provide a significant base for the global food chain. Extinction of aragonite species would lower the ocean’s ability to turn dissolved CO2 into harmless CaCO3, further reducing ocean CO2 uptake. California climate change, temps higher, rainfall lower, snowpack much lower. Global regional forecast – stronger rain over the oceans, drought over populated mid latitudes, expanding deserts. Arctic warming the fastest and most dramatic. Arctic is warming ~8x faster than lower latitudes. Extinction rate accelerating even faster than human population rise, rate changes highly correlated – half of all species of life on Earth expected to be gone this century. Runaway Greenhouse very unlikely, but can’t be ruled out since, in part, the RATE of climate change is unprecedented. Arctic tundra methane release could add to greenhouse effect significantly, perhaps this is the worst feedback ultimately. Methane clathrates unlikely to have abrupt methane release, despite early fears of Dr. Shahkova, due to high depth of Arctic clathrates and slow heat transmission there.")
Similar presentations