Download presentation
Presentation is loading. Please wait.

1
Karen E. Kim, MD. MS Professor of Medicine Director Office of Community Engagement and Cancer Disparities University of Chicago Comprehensive Cancer Center May 20, 2013

2
Conflict of Interest NCI P20-South Side Cancer Disparities Initiative AHRQ R24: Partnership for Healthier Asians NCI: Community Health Educator supplement CDC U54: Hepatitis B Education and Prevention President: Asian Health Coalition VP: National Council of Asian American Pacific Island Physicians Steering committee-National Viral Hepatitis Roundtable Executive board: American Cancer Society

3
Objectives Asian American Demographics and Immigration History Cancer among Asian Americans Colorectal cancer: Public health and public policy partnership

4
Who Lives In the Global Village? 4 61 Asians 13 Africans 12 Europeans 9 Latin Americans 5 North Americans If Only 100 people Lived In the World, There Would Be……

5
Asian American Immigration History 1763-Filipinos in US-escapees from Spanish ships Early 1850’s California Gold rush 1882-Chinese Exclusion Act 1922-Japanese made ineligible for citizenship 1942-46-Executive Order 9066-Japanese internment (> 2/3 were US citizens) 1965-Hart Cellar Act-abolished national origin quotas (Japan 185, China 105, other Asian 100) 1990-Immigration Act
 1965-Hart Cellar Act-abolished national origin quotas (Japan 185, China 105, other Asian 100) 1990-Immigration Act")
6
Life magazine of December 1941

7
CHINESE Parchment yellow More epicanthic folds Higher bridge Never rosy cheeks Lighter facial bones Longer face JAPANESE Earthy yellow Less epicanthic folds Flatter nose Sometimes rosy cheeks Heavy beard Shorter face

8
Asian American Immigration History 1763-Filipinos in US-escapees from Spanish ships Early 1850’s California Gold rush 1882-Chinese Exclusion Act 1922-Japanese made ineligible for citizenship 1942-46-Executive Order 9066-Japanese internment (> 2/3 were US citizens) 1965-Hart Cellar Act-abolished national origin quotas (Japan 185, China 105, other Asian 100) 1990-Immigration Act
 1965-Hart Cellar Act-abolished national origin quotas (Japan 185, China 105, other Asian 100) 1990-Immigration Act")
10
Health Care Goals Healthy People 2015 50% reduction in cancer mortality; 25% reduction in cancer incidence DHHS Eliminate health disparities by year 2010 Problems for AAPI Paucity of Data for AAPI subgroups Marginal funding for AAPI Health care system Model minority status

11
Marginal funding for AAPI MEDLINE database-1966-2000 10 million articles 1499 (0.01%) directly involve AAPI health CRISP database-1986-2000 150,369 federal health related grants 342 (0.2%) for AAPI health How do we translate ‘evidence based’ medicine into communities ? Journal of Asian American Health (JAAH)
.")
12
Demographic Trends In 2010, > 70% 0f Asian Americans are foreign born* >35% are linguistically isolated * Highest precentage for any racial/ethnic group

13
adapted from Hong and Hong, NCORE, 2006 Health Care System and AAPI AAPI stand out as being one of the least well-served Asian Americans are least likely to: Feel that their providers understand them Be involved in medical decision making Have confidence in their providers

14
14

15
Model Minority African American-sick, poor, diabetes, cancer, disenfranchised, obese, violence, can’t understand Asian American-healthy, bird flu, smart, listens, skinny

16
Cancer 2013 1.66 million new cancer diagnosed in 2013 580,350 cancer deaths 1600 deaths/day 1 in 4 deaths 226 billion –cost of cancer ACS Cancer Facts and Figures 2013

19
Cancer and Asian Americans US-Born AAPI males Foreign-born AAPI males US-Born AAPI females Foreign born AAPI females Heart dzCancer Heart dz 1980’s-Asian Americans were the first population to die from cancer as the #1 cause of death In 2009

20
Chronic Hepatitis B Infection LIVER CANCER H pylori infection and diet STOMACH CANCER Epstein Barr (EB) virus NASOPHARYNGEAL CANCER Human papilloma virus (HPV) CERVICAL CANCER Lifestyle factors(Migration effect) BREAST CANCER COLORECTAL CANCER 20 Asian Americans and Cancer Risk Factors
 virus NASOPHARYNGEAL CANCER Human papilloma virus (HPV) CERVICAL CANCER Lifestyle factors(Migration effect) BREAST CANCER COLORECTAL CANCER 20 Asian Americans and Cancer Risk Factors")
21
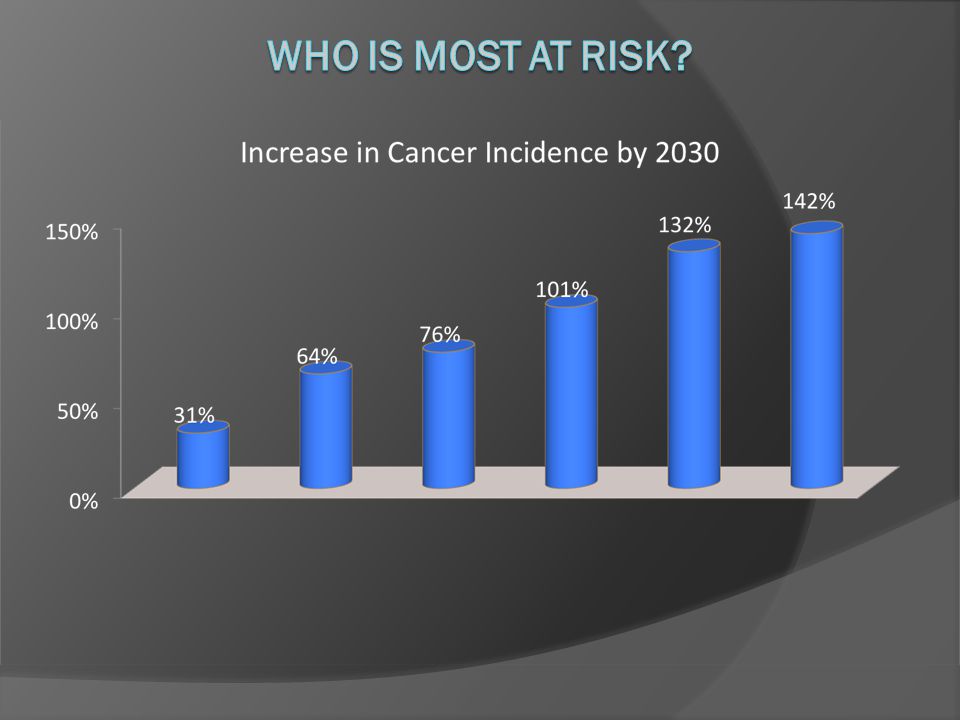
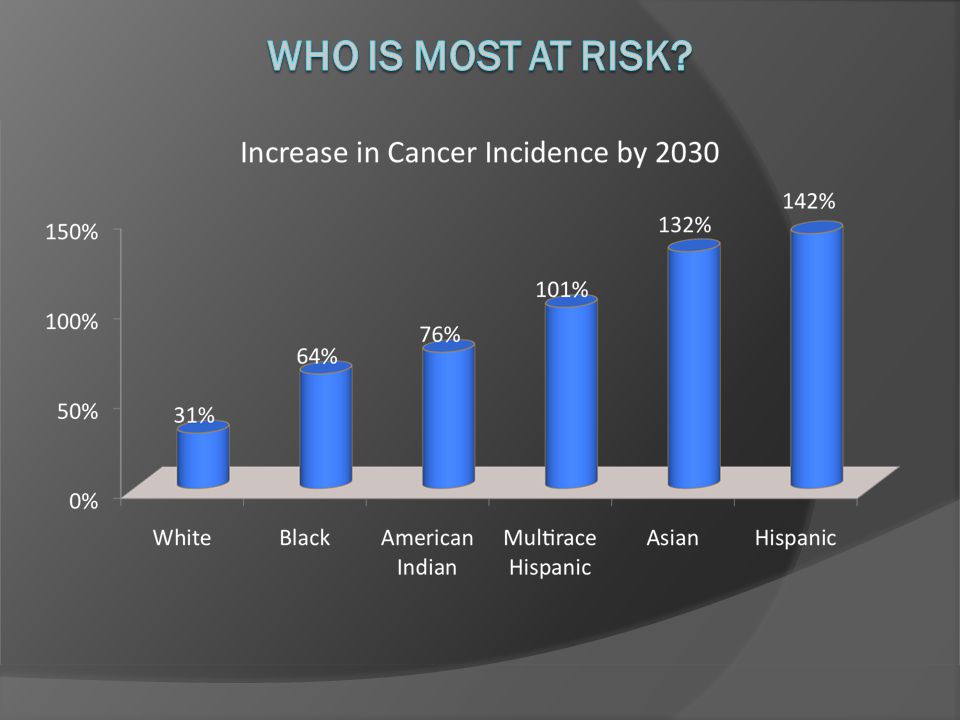
Estimated New Cancer Cases* in the US in 2013

22
Cancer Screening for Asian Americans How do we participate in public health? Nasopharyngeal cancer − no screening Liver cancer − no screening coverage in US Stomach cancer − no screening guidelines in US Breast cancer – 64% Cervical cancer – 75% Colorectal cancer – 47% 22

23
Jacobs, et al, Am J Public Health 2005 LEP and cancer screening

24
Public Health vs Public Policy

25
Public Health Interventions to Policy Downstream-individuals, communities Midstream-organizations Upstream-regulations, access, economic incentives (policy) Brownson et al. Prev Chronic Dis 2010

26
Gastric Cancer 2 nd most common Worldwide 10% all cancers, 12.1% cancer deaths Koreans have the highest prevalence worldwide Ranks in the top 10 cancers among Koreans, Vietnamese, Japanese Early detection decreases mortality

27
In the US, less than 10-20% of all gastric cancers are found in the early stages 15% survival

28
The Affordable Care Act requires health plans and encourages state-based Medicaid programs to cover those clinical preventive services recommended by the U.S. Preventive Services Task Force (USPSTF) graded ‘A’ or ‘B’. Gastric cancer screening No current recommendations Will this become a covered service? ACA and SCREENING POLICY
 graded ‘A’ or ‘B’. Gastric cancer screening No current recommendations Will this become a covered service. ACA and SCREENING POLICY.")
29
Barriers to Screening for Gastric Cancer: Evidence of Benefit No randomized controlled trials reported showing a decrease in mortality Failure to identify early gastric cancer in the US is most likely due to: Low incidence (in majority population) Lack of risk stratification Lack of aggressive screening NCI: Gastric Cancer
 Lack of risk stratification Lack of aggressive screening NCI: Gastric Cancer")
30
Gastric Screening Guidelines The future? ASGE 2010 ‘suggest screening EGD for new US immigrants from high-risk regions- especialy with a family history’

31
Public Health Interventions/Outcomes Downstream-individuals, communities Midstream-organizations Upstream-regulations, access, economic incentives (policy) Prev Chronic Dis 2010
 Prev Chronic Dis 2010")
32
Chronic Hepatitis B (CHB) & Asians World Health Organziation. Factsheet: Hepatitis B. http://www.who.int/mediacentre/factsheets/fs204/en/http://www.who.int/mediacentre/factsheets/fs204/en/ Derose KP, Bahney BW, Lurie N, Escarce JJ. Review: immigrants and health care access, quality, and cost. Medical care research and review. 2009 Aug;66(4):355-408. Epub 2009 Jan 29. ~400 million infected worldwide 75% are from Asia >1.3 million infected in US > 50% are AAPI Prevalence is 0.3% for the general population in US Prevalence is 5-15% among AAPI in US (up to 30% in some groups) Liver cancer rates increasing in US Liver cancer is 3 rd leading cause of cancer in Asians
: Epub 2009 Jan 29. ~400 million infected worldwide 75% are from Asia >1.3 million infected in US > 50% are AAPI Prevalence is 0.3% for the general population in US Prevalence is 5-15% among AAPI in US (up to 30% in some groups) Liver cancer rates increasing in US Liver cancer is 3 rd leading cause of cancer in Asians.")
33
CDC, 2006 Estimated New Chronic HBV Infections by Place of Acquisition, United States, 1990-2005 United States Immigrants from other countries

34
Policies and hepatitis B ?????

35
The Affordable Care Act requires health plans and encourages state-based Medicaid programs to cover those clinical preventive services recommended by the U.S. Preventive Services Task Force (USPSTF) graded ‘A’ or ‘B’. SCREENING POLICY
 graded ‘A’ or ‘B’. SCREENING POLICY.")
36
U.S Preventative Services Task Force Guide to Clinical Preventive Services 2010-2011 Strongly recommends screening for hepatitis B virus (HBV) infection in pregnant women at their first prenatal visit. ‘A’ Recommendation

37
Estimated Births to HBsAg-Positive Mothers, United States, 2003 Race/Ethnicity2003 BirthsCDC Point Estimate Pooled Estimate* %N%N White2,321,9040.112,554.092,090 African American 576,0330.52,880.533,053 API- US Born37,3841.4523 5.7412,642 API- Foreign Born 182,8628.916,275 Hispanic912,329.09821.21,825 American Indian 43,052.5215.29125 TOTAL4,073,56423,26919,735 * Prevalence studies in 18 states since 1990

38
U.S Preventative Services Task Force Guide to Clinical Preventive Services 2010- 2011 Recommends against routinely screening the general asymptomatic population for chronic hepatitis B virus infection. ‘D’ Recommendation

39
USPSTF 2004: Rationale The prevalence of HBV infection is low; the majority of infected individuals do not develop chronic infection, cirrhosis, or HBV-related liver disease. Potential harms of screening include labeling, although there is limited evidence to determine the magnitude of this harm Evidence-based

40
Policy: FUNDING VIRUSPrevalence (millions) % unaware Deaths 2006 VaccineCDC budget 2010 $ per pt HBV0.8-1.465%3,000YES HCV2.7-3.975%12,000NO HBV/ HCV 3.5-5.315,00024 Million $4/pt HIV1.121%14,016NO1.2 Billion $1000/ pt
 % unaware Deaths 2006 VaccineCDC budget 2010 $ per pt HBV %3,000YES HCV %12,000NO HBV/ HCV ,00024 Million $4/pt HIV1.121%14,016NO1.2 Billion $1000/ pt")
41
-2-1.5-1-0.500.511.52 All Other Cancers (Average) Liver Thyroid Esophagus Lung & Bronchus (Female) Testis Corpus & Uterus, NOS Trends in US Cancer Mortality Rates Annual Percent Change (1994–2003).Available at: http://seer.cancer.gov/csr/1975_2003/results_merged/topic_graph_trends.pdf.http://seer.cancer.gov/csr/1975_2003/results_merged/topic_graph_trends.pdf Liver Cancer Has the Fastest Growing Death Rate in the United States
 Liver Thyroid Esophagus Lung & Bronchus (Female) Testis Corpus & Uterus, NOS Trends in US Cancer Mortality Rates Annual Percent Change (1994–2003).Available at: Liver Cancer Has the Fastest Growing Death Rate in the United States")
42
DISSEMINATIONATION SCIENCE DISCOVERYDEVELOPMENTDELIVERY CRITICAL DISCONNECT

43
43 Five-year Relative Survival Rates of Major Cancers in Various Countries Cancer Facts & Figures 2012

44
Colorectal cancer prevention

46
Prevalence of Screening Behaviors and Health Care Access By Sex and Asian American Ethnic Group, 2003 California Health Interview Survey ChineseFilipinoVietnamese Korean Japanese White Males FOBT Screening >1 year or never 81.1 92.3 85.6 93.1 89.679.6 Within past year 19.0 7.7 14.4 7.0 10.4 20.4 Females >1 year or never 85.4 86.8 79.4 92.1 78.2 79.8 Within past year 14.7 13.2 20.6 7.9 21.8 20.2

47
NHIS 2010, CRS

48
SCREEN ACT Supporting Colorectal Examination and Education Now (SCREEN) Act (S.608/H.R. 1320) Waives all Medicare beneficiary cost-sharing for CRS with polyps Medicare will cover pre colon cancer screening visits Supports quality service initiatives CRS is covered under ACA
 Waives all Medicare beneficiary cost-sharing for CRS with polyps Medicare will cover pre colon cancer screening visits Supports quality service initiatives CRS is covered under ACA.")
50
Affordable Care Act Ultimate public policy 15.7% uninsured AAPI-over 30% did not see an MD within past year-least among R/E 2 million AAPI projected to become insured Legal Permanent residents status 2.7 million AAPIs will have access to preventative services-greatest cancer prevention intervention

51
Opportunities for Asian American Health Affordable Care Act From least insured covered services Medical homes Electronic Medical Record Place of birth Language preference National database/registry 2013 CLAS

52
Opportunities for APAMSA to Reduce Disparities Public Awareness Campaign Community, Physician, Public Health Partnership with other National Organizations (AMA, NMA, NCAPIP) Support the Pipeline Cultural competency Asian health disparities
 Support the Pipeline Cultural competency Asian health disparities")
54
Pritzker School of Medicine: Student language capacity

55
PSOM 93% (n=82) 28% speak on Asian language 1 in 5 graduating medical students are Asian American
 28% speak on Asian language 1 in 5 graduating medical students are Asian American")
57
Opportunities for APAMSA as a leadership organization POLICY, POLICY, POLICY Let the science drive public policy Policies reflect populations with disproportionate disease burden Create system change

58
58

Similar presentations


 Program Overview Hong Liu, Ph.D. Executive Director.>")


 Excessive thirst (polydipsia) Weight loss Vision changes Hunger Fatigue Long term risks include heart disease,>")


