Download presentation
Presentation is loading. Please wait.

1
U.S. Environmental Protection Agency ENERGY STAR UPDATE 2001-2002

2
Outline ENERGY STAR Success Public Service Announcement Campaign National Promotions Power Management Campaign Evaluation Activities Logo Use Monitoring Product Specifications

3
E NERGY S TAR Success Widespread and growing participation –More than 1,100 manufacturer partners –More than 13,000 product models carry the E NERGY S TAR label –300 utility and state administrator partners promote E NERGY S TAR, covering nearly 60% of households in the U.S. –Over 800 retail partners representing more than 15,500 storefronts in the U.S. and Puerto Rico

4
E NERGY S TAR Success Significant improvements in the design and energy efficiency of products Savings: –$50 billion in energy costs –Prevented more than 150 million metric tons of carbon dioxide pollution To date, U.S. consumers have purchased more than 750 million E NERGY S TAR labeled products.

5
Consumer Awareness 40% of consumers nationwide recognize the E NERGY S TAR label. In areas with active utility/state programs, recognition exceeds 50%. Most E NERGY S TAR purchasers would recommend E NERGY S TAR to a friend. Goal: 60% awareness by 2005.

6
Public Service Announcement (PSA) Campaign Update
 Campaign Update")
7
Public Service Campaign Update Distributed to 150 top TV markets, 50 top daily newspapers, 1000+ magazines, 35 national radio networks (Jan 02) $3 million in equivalent ad value in 4 months (TV, radio, print) Performing 75% better than the average government PSA 2/3 of TV spots used are 60 second; 2/3 also airing during best day parts
 $3 million in equivalent ad value in 4 months (TV, radio, print) Performing 75% better than the average government PSA 2/3 of TV spots used are 60 second; 2/3 also airing during best day parts")
8
PSA Campaign- TV Spot Copy: “If just one room in every home is brightened by lighting that’s earned the Energy Star, the change would reduce greenhouse gas emissions by 1 trillion pounds.”

9
PSA Campaign - Print Copy: “Some washers clean more than just clothes.” “Some lights brighten more than just a room.”

10
PSA Campaign - Partner Leveraging Intel ad (ran in Wall Street Journal, USA Today, InfoWeek, PC Week)
")
11
National Promotions Leveraging the Change Campaign

12
Change a Light, Change the World Fall lighting promotion for retailers, manufacturers, and regional program partners Covers residential lighting fixtures, bulbs, and ceiling fans Built around consistent messages: –Call to action: Start changing your world. Replace your next light with an E NERGY S TAR. –Environmental Fact: 'If just one room in every home used E NERGY S TAR lighting, the change would keep 1 trillion pounds of greenhouse gases out of our air.'

13
Change a Light, Change the World

14
2001 Highlights: Increased sales: One CFL manufacturers reported a 300% increase in sales (over the same time last year) High participation/high satisfaction –100 utilities/states, more than 20 retail chains, 25 fixture and CFL manufacturers partners participated Significant reach –TV: 11 million impressions –Partner print ads: 9 million people in 12 states –Radio: 600 broadcasts reaching 4.9 million listeners
 High participation/high satisfaction –100 utilities/states, more than 20 retail chains, 25 fixture and CFL manufacturers partners participated Significant reach –TV: 11 million impressions –Partner print ads: 9 million people in 12 states –Radio: 600 broadcasts reaching 4.9 million listeners")
15
Cool Change Spring cooling promotion for retailers, utilities, manufacturers, contractors, and distributors Central AC and heat pumps, room AC, ceiling fans, dehumidifiers, programmable thermostats Elements of the promotion: –Unified Call-to-action –E NERGY S TAR cooling consumer education guide –Marketing templates on CD –Web landing pages –HVAC Contractor tools –E NERGY S TAR Media activities –Media toolkit and support for participating partners

16
Cool Change

17
E NERGY S TAR for the Holidays Call to Action - Give the gift that gives a cleaner environment. Elements –Electronic shopping guide –Box inserts –Enhanced in-store visibility –Media and PR Product focus: TVs, VCRs, DVD players, CD players, stereos, telephone products

18
Monitor Power Management Campaign

19
Power management 54 million office computers and monitors use 1% of U.S. electricity –More than half is wasted: 60% left on at night; 45% of monitors not power managed –Under power management, monitor power use drops from 60-90 watts to 2-10 watts. A 1,000-monitor office could save 200,000 kWh by enabling power management. –Turning off computers at night can double the savings www.energystar.gov/powermanagement

20
Power Management Campaign Campaign Elements –Demonstrate the virtues of monitor power management to end users and organizations –Provide software tools to ease power management implementation –Publicize successful efforts through a PR campaign

21
Power Management Results Total of 370,500 computers addressed –29,900 through 22 organizations that have completed monitor power management enabling –45,850 through 15 organizations that have partially completed monitor power management enabling –294,760 through Website software downloads and site visits

22
Evaluation Activities Retail Store Level Assessment Product Testing Data Gathering

23
Retail Store Level Assessment - Goals Mystery Shopping –Assess salesperson knowledge of Energy Star and extent messaging is used in sales process Point-of-Sale/Point-of-Purchase Check –Check visibility/presence of Energy Star in-store displays by department Shelf/label inventory –Track availability/visibility of Energy Star qualified and labeled products in stores

24
RSL Basics First round (fall 2001) –5 national retailers –7 cities –7 products Future plans –3 rounds per year –some variation in products/retailers –lighting showrooms/local appliance dealers included on a limited basis
 –5 national retailers –7 cities –7 products Future plans –3 rounds per year –some variation in products/retailers –lighting showrooms/local appliance dealers included on a limited basis")
25
Findings: Mystery Shopping Assessment based on –Did they know what Energy Star is? –Did they introduce Energy Star without prompting? –Did they explain Energy Star correctly? Average “score” 40 on 100-point scale –highest scores in appliance departments –lowest scores in home electronics departments

26
Findings: POP Check 70% of appliance departments display Energy Star POP much less prevalent in lighting departments nonexistent in electronics departments generally more prevalent in areas with active regional programs

27
Findings: Product Inventory Shelf area devoted to Energy Star bulbs ranged from 10-30% (highest in CA) Inventories –Energy Star qualified light fixtures: 1-10% –Energy Star qualified appliances: 18% for clothes washers, 30% for dishwashers, between 20 and 50% for refrigerators –Energy Star qualified TVs: 30%
 Inventories –Energy Star qualified light fixtures: 1-10% –Energy Star qualified appliances: 18% for clothes washers, 30% for dishwashers, between 20 and 50% for refrigerators –Energy Star qualified TVs: 30%")
28
Findings: Labeling More than 86% of qualifying appliance products are labeled About 70% of lighting products are labeled Appliances rarely mislabeled; some potential mislabeling of lighting products TVs –less frequently labeled –major gaps in qualifying product lists

29
Product Testing Manufacturers test and self certify products EPA reserves the right to test any product submitted –Protect brand and partner investment in program –Verify manufacturers’ results Formal testing process –Focus on product that contribute most to pollution prevention computers, monitors, TVs other products later some ad-hoc testing

30
Product Testing Third Party Lab(s) will purchase product, do testing, and report results –10 labs contacted, 1 or 2 will be picked –Lab chosen based on cost, reputation, quality, variety of services offered, and nationwide reach Products to be tested –“Best sellers” as determined by market research firms –Individual units tested will vary by geography –Units purchased via retail and on the Internet –Not intended to be a statistically significant sample
 will purchase product, do testing, and report results –10 labs contacted, 1 or 2 will be picked –Lab chosen based on cost, reputation, quality, variety of services offered, and nationwide reach Products to be tested – Best sellers as determined by market research firms –Individual units tested will vary by geography –Units purchased via retail and on the Internet –Not intended to be a statistically significant sample")
31
Product Testing EPA will review results –For failed products, EPA will work with manufacturer to determine and agree upon an appropriate course of action –Onus is on the manufacturer to prove to EPA that their product meets specifications Results will be kept confidential

32
Product Testing Update on PEARL - project implemented by the Lighting Research Center for check testing CFLs and residential light fixtures –3 rounds completed –60 products tested; 3 samples of each = 180 total products Results –20 manufacturers contacted by EPA and DOE regarding compliance –One manufacturer removed from program –15 products de-listed

33
Data Gathering To document impact of ENERGY STAR on product design and sales and to feed into evaluation of program’s market penetration impact –Data from manufacturers to fulfill Partnership requirements Qualifying product information feeds into database and website; gives a more robust account of performance characteristics Sales data on Energy Star labeled products –Data from market research firms through purchased reports or commissioned studies Concentrating first on office equipment, consumer electronics, and heating and cooling equipment

34
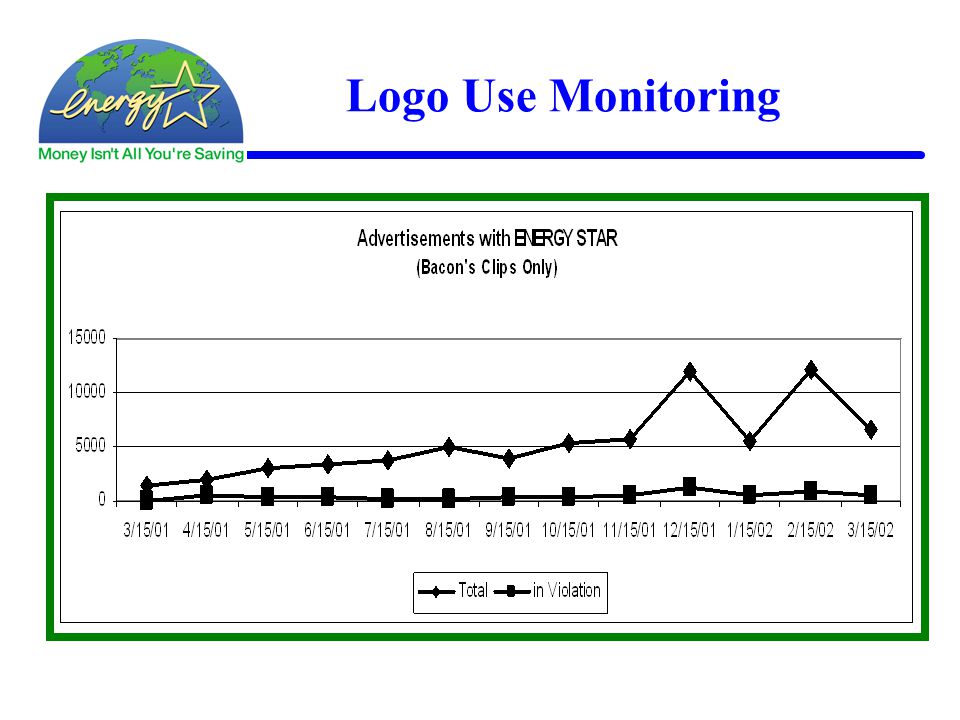
Logo Use Monitoring

35
We track logo and name use in –Advertisements (monthly) –Editorial coverage (monthly) –Web use including domain names (quarterly) We look at –Numbers of companies using logo/name –Numbers of advertisements containing logo/name –Major and minor violations –Repeat violators
 –Editorial coverage (monthly) –Web use including domain names (quarterly) We look at –Numbers of companies using logo/name –Numbers of advertisements containing logo/name –Major and minor violations –Repeat violators")
36
Logo Use Violations Minor Violations –Improper/incorrect use of logo –Use of out-of-date logo –Use of name in other than small caps or failure to display ® –Use of logo in a company name, product name, service name, domain name, web site title, etc. Major violations –Alteration of logo or its use in another logo design –Use of logo to imply endorsement –Unauthorized use of logo –Use of logo in association with unqualified products –Use of logo to disparage ENERGY STAR, EPA, DOE, or other government body

37
March 2002 Violations Out of 690 companies advertising with E NERGY S TAR : –7 partners with minor violations –82 non-partners with minor violations –0 partners with major violations –2 non-partners with major violations –10 repeat violations

38
Logo Use Monitoring

40
Logo Use Monitoring - Trends Logo use and editorial coverage have increased compared to last year Most big partners are getting it right Problem areas –Window manufacturers are most common repeat offenders –Unauthorized logo use (by non-partners) –HVAC contractors –Improper use of the logo in advertisements (not placed next to qualified product)
 –HVAC contractors –Improper use of the logo in advertisements (not placed next to qualified product)")
41
Product Specifications New product specs finished in 2001/02: –Ceiling fans –Ventilation fans –Telephony –Commercial solid door refrigerators and freezers –Light commercial HVAC Specs under revision in 2001/02: –Residential HVAC –TV/VCR –Monitors New product specs being explored in 2002 –Vending machines –Food service equipment –Air purifiers

Similar presentations

>")


 June meeting: EIA, ITI, NEMA and EPA –discuss.>")


 Kate Lewis Canadian ENERGY STAR Participants’ Meeting May 4, 2006.>")
