Download presentation
Presentation is loading. Please wait.

1
(Xperf)
")
4
Trace Capture, Processing, and Command-Line Analysis tool Xperf.exeCaptures traces, post-processes them for use on any machine, and supports command-line (action-based) trace analysis. Visual Trace Analysis tool Xperfview.exePresents trace content in the form of interactive graphs and summary tables. On/Off Transition Trace Capture tool Xbootmgr.exeAutomates on/off state transitions and captures traces during these transitions.

26
I've got a DPC issue on this machine to track down further with the NIC :)….15% DPC time as a constant is not good for performance!
….15% DPC time as a constant is not good for performance!")
27
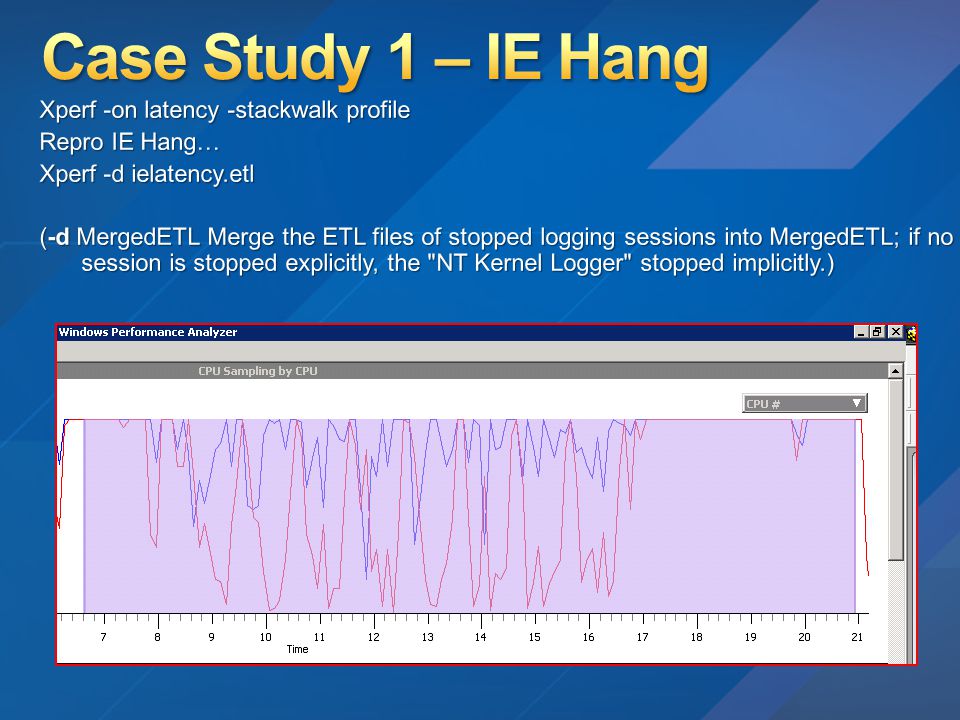
Interesting to note that it matches the CPU Sampling by CPU.

29
What is going on here? Half Idle, Half…

30
Ah, my backup application at PID 496 is running doing it's thing…

31
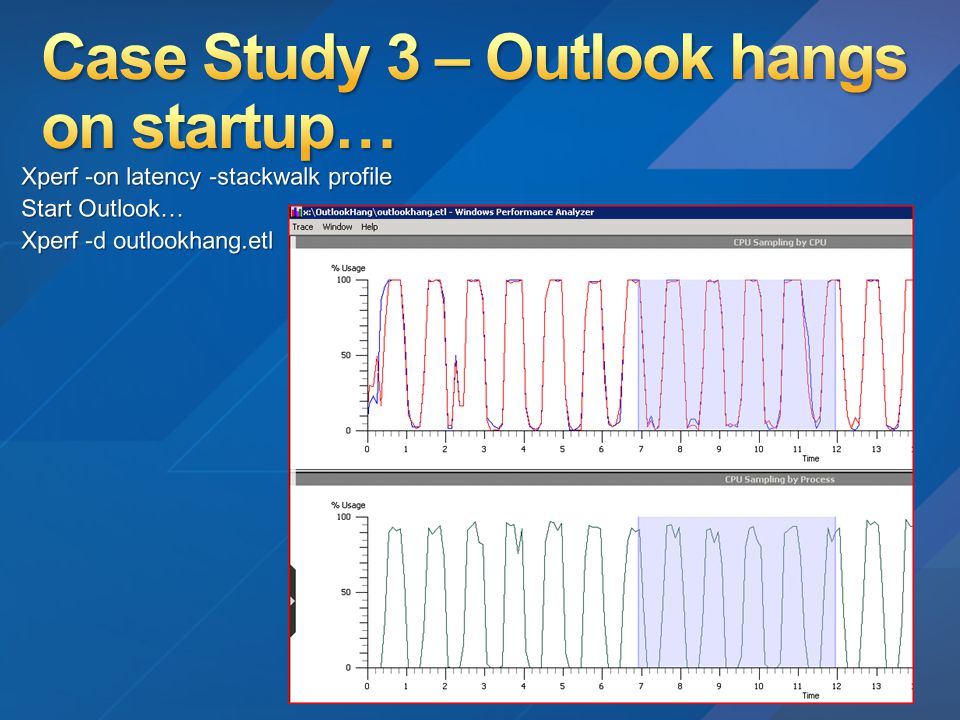
But what is Outlook doing during all this?

32
Summary: So I've found a taxing network DPC issue on my machine so I'll go follow up with my NIC configuration/driver. (turns out disable renable did the trick) Also, I've seen that I’ve got my backup application querying the file system here likely indexing by design. Also, I've got more digging to do into Outlook using the Cswitch stackwalk event (running the trace before the hang). Addendum: Found two separate hang bugs in Outlook actually where the root cause of the hangs(with the debugger, I cheated, sorry, I feel bad). The write stack matched one though!
 Also, I ve seen that I’ve got my backup application querying the file system here likely indexing by design. Also, I ve got more digging to do into Outlook using the Cswitch stackwalk event (running the trace before the hang). Addendum: Found two separate hang bugs in Outlook actually where the root cause of the hangs(with the debugger, I cheated, sorry, I feel bad). The write stack matched one though!.")
33
The situation is that on two different platforms (physical vs. virtual) of stated same build are displaying two different scheduling behaviors when viewing CPU time for RunScottRun.exe. The exe “doesn't stay on a processor”… xperf -on PROFILE+DISPATCHER+PROC_THREAD+LOADER+HARD_FAULTS+INTERRUPT+DPC+CS WITCH -maxbuffers 1024 Here is what the "good" trace looks like…We have our Process level view to clone the selection….
 of stated same build are displaying two different scheduling behaviors when viewing CPU time for RunScottRun.exe. The exe doesn t stay on a processor … xperf -on PROFILE+DISPATCHER+PROC_THREAD+LOADER+HARD_FAULTS+INTERRUPT+DPC+CS WITCH -maxbuffers 1024 Here is what the good trace looks like…We have our Process level view to clone the selection…..")
34
Now the CPU Scheduling section. At a high level the problem reported is that RunScottRun.exe is having trouble getting enough time on a single CPU and we see context switches...

35
We can see this at a little bit lower level what is getting to run…

36
At an even lower level RunScottRun.exe is lower priority, we see SomeService.exe sneak in here at Pri 9, then back to RunScottRun.exe after Delay Execution.

37
If you are an Excel wiz :) the data can be exported for another view. Here's the "good" trace summary/pivot

38
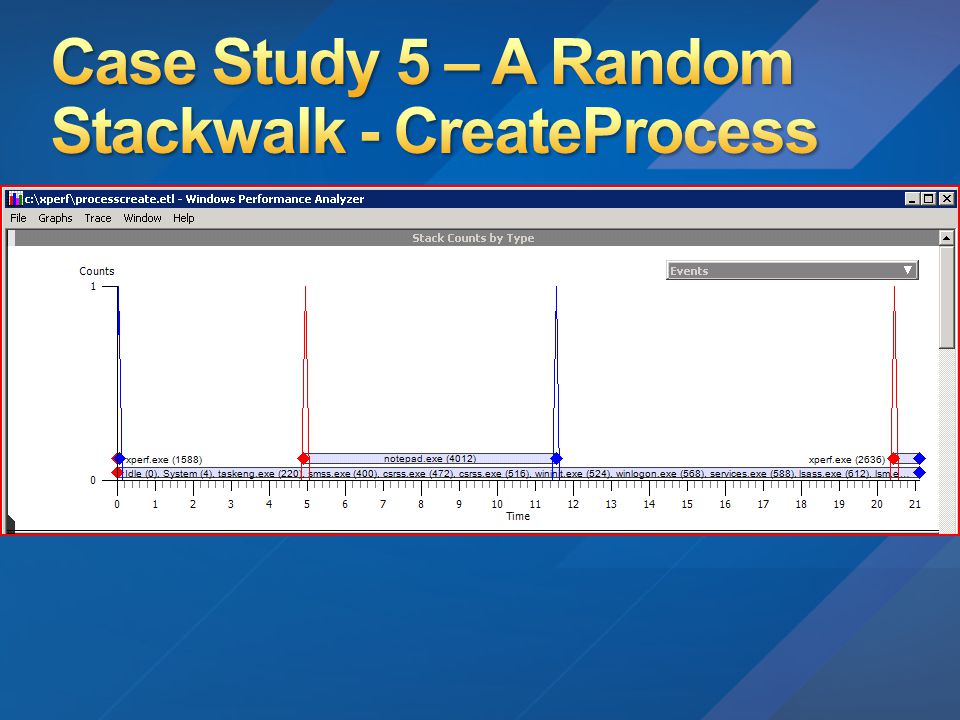
C:\xperf>xperf -on DiagEasy -stackwalk ProcessCreate+ProcessDelete C:\xperf>notepad C:\xperf>xperf -d processcreate.etl Merged Etl: processcreate.etl (shows stacks on 7sdk Stack Counts by Type)
")
43
C:\xperf>xperf -on FileIO+FILENAME -stackwalk @file.txt C:\xperf>xperf -d file.etl Merged Etl: file.etl C:\xperf>xperf file.etl (shows stacks with 08 ver, in File IO Section)
")
45
C:\xperf>xperf -on DiagEasy+REGISTRY -stackwalk @reg.txt C:\xperf>regedit C:\xperf>xperf -d reg.etl Merged Etl: reg.etl (shows stacks with 08 ver, in Registry section)
")
47
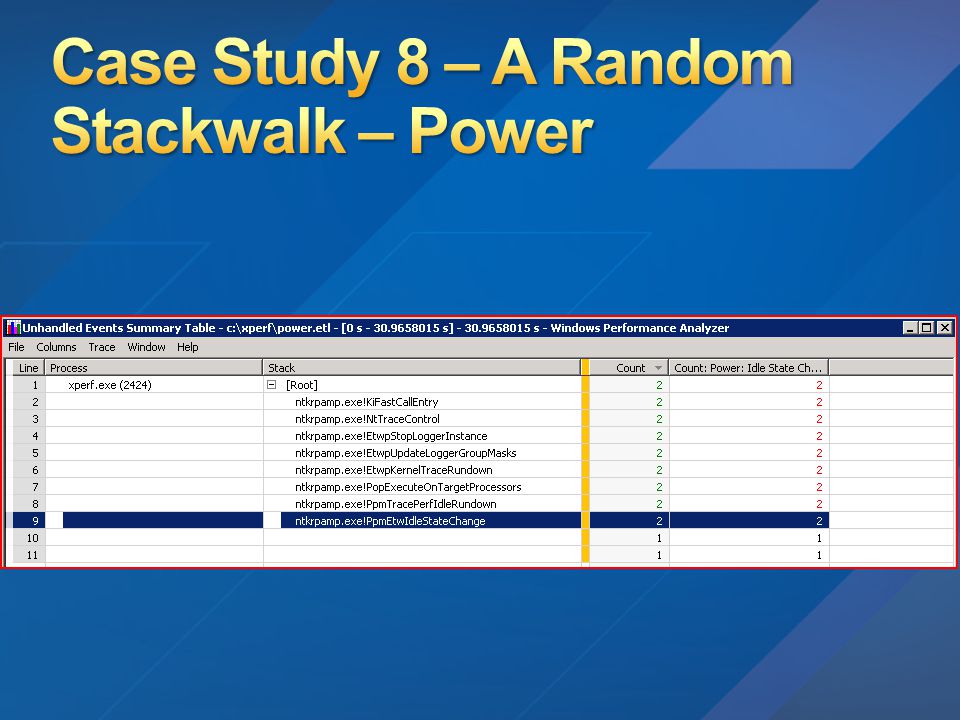
C:\xperf>xperf -on DiagEasy+POWER -stackwalk @power.txt C:\xperf>xperf -d power.etl Merged Etl: power.etl C:\xperf>xperf power.etl C:\xperf>c:\xperf7sdk\xperf power.etl (shows stacks with 7sdk Stack Counts by Type)
")
51
Xbootmgr.exe! It can trace boot, hibernate, standby, shutdown, rebootCycle performance. Heap and VirtualAlloc tracing in user mode...

52
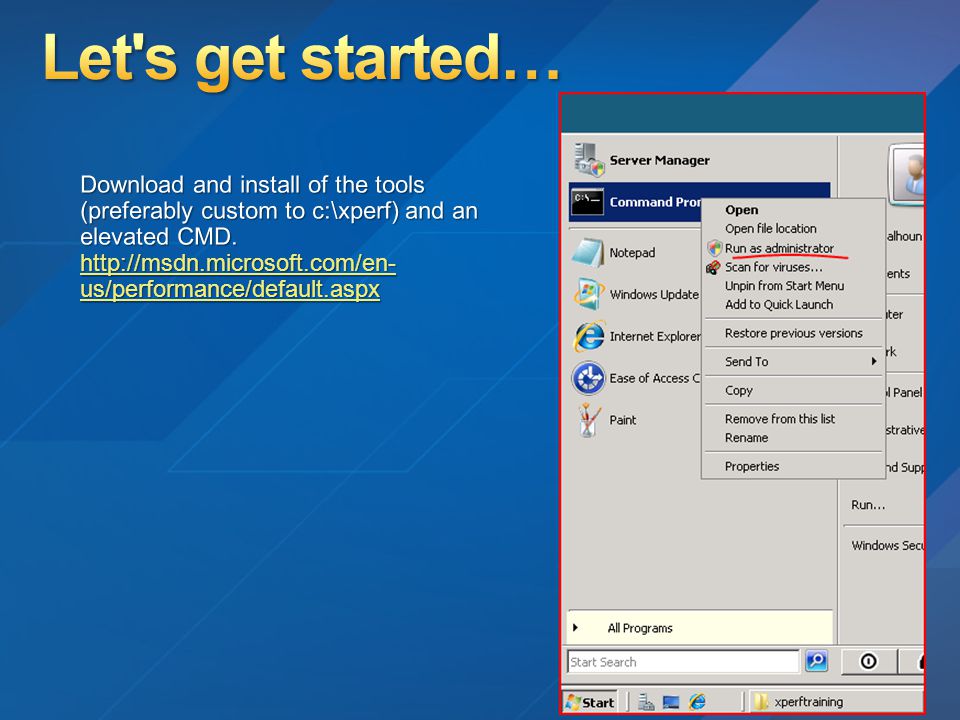
The toolkit: http://msdn.microsoft.com/en-us/performance/default.aspxhttp://msdn.microsoft.com/en-us/performance/default.aspx The forum: The Windows Performance Toolkit ForumThe Windows Performance Toolkit Forum Remember to check the Windows 7 SDK for the cool Stack Counts by Type section and other improvements!

53
Can I use Performance Analyzer on Windows XP or Windows Server 2003? Unfortunately, the answer is 'no'. While Windows XP and Windows Server 2003 do support collection of ETL traces, these OSes do not contain instrumentation for most of the events needed by Performance Analyzer (PA). You need Windows Vista or later OS to use PA. An example of crucial instrumentation added in Vista is stack walking. Performance analysis without stacks can be an extremely daunting task that only a true expert with access to source code can tackle. With the Windows Vista release, Microsoft has really taken the OS to next level in terms of system diagnosibility and a lot of the analysis based on this instrumentation isn't feasible on Windows XP/Server 2003 ETL traces.
. You need Windows Vista or later OS to use PA. An example of crucial instrumentation added in Vista is stack walking. Performance analysis without stacks can be an extremely daunting task that only a true expert with access to source code can tackle. With the Windows Vista release, Microsoft has really taken the OS to next level in terms of system diagnosibility and a lot of the analysis based on this instrumentation isn t feasible on Windows XP/Server 2003 ETL traces..")
54
How do I find out the time span of the trace my customer collected to correlate with other data? (-a tracestats)
.")
55
How to enable stackwalking on x64 systems? x64 ETW stackwalking is only supported on Windows Vista SP1, Windows Server 2008, and above, and requires setting a certain registry value (see below) to 1 and rebooting the machine ( so that Windows kernel picks it up). HKLM\System\CurrentControlSet\Control\Session Manager\Memory Management DisablePagingExecutive 1
 to 1 and rebooting the machine ( so that Windows kernel picks it up). HKLM\System\CurrentControlSet\Control\Session Manager\Memory Management DisablePagingExecutive 1.")
56
© 2009 Microsoft Corporation. All rights reserved. Microsoft, Windows, Windows Vista and other product names are or may be registered trademarks and/or trademarks in the U.S. and/or other countries. The information herein is for informational purposes only and represents the current view of Microsoft Corporation as of the date of this presentation. Because Microsoft must respond to changing market conditions, it should not be interpreted to be a commitment on the part of Microsoft, and Microsoft cannot guarantee the accuracy of any information provided after the date of this presentation. MICROSOFT MAKES NO WARRANTIES, EXPRESS, IMPLIED OR STATUTORY, AS TO THE INFORMATION IN THIS PRESENTATION.

Similar presentations