Download presentation
Presentation is loading. Please wait.

1
Modeling the MOC Ronald J Stouffer Geophysical Fluid Dynamics Laboratory NOAA The views described here are solely those of the presenter and not of GFDL/NOAA/DOC or any other agency or institution. http://www.andrill.org/iceb erg/blogs/julian/images/gr eatoceanconveyor.jpg

2
Modeling the MOC Outline Role of MOC in maintaining mean climate –Northward Heat Transport –Northward Salt transport Role of MOC in Abrupt Climate Change –Unforced –Forced Predictability

3
How well do models simulate the T, S structure in the ocean? AR4 ensemble mean error Temperature IPCC WGI Chapter 8 -2.5 +2.5

4
AR4 ensemble mean error Salinity 90N 90S -0.20.2-0.40.4 IPCC WGI Chapter 8 Suppl. Material EQ PSU +1.0

5
Role of MOC in Heat Transport

6
Impact of MOC on Climate (SAT) AOGCMs EMICs MOC “on” minus “off” o C Conclusion – MOC warms NH, locally large values, MOC cools SH
 AOGCMs EMICs MOC on minus off o C Conclusion – MOC warms NH, locally large values, MOC cools SH")
7
Impact of MOC on Climate Zonally averaged Precipitation differences (mm/day) Red lines control Blue lines difference Dashed – EMICs Solid - AOGCMs Conclusion – MOC on => ITCZ toward north
 Red lines control Blue lines difference Dashed – EMICs Solid - AOGCMs Conclusion – MOC on => ITCZ toward north")
8
Impact of MOC on Climate Salinity MOC “on” minus “off” (PSU)
")
9
Role of MOC in maintaining mean climate North Atlantic saltier than without MOC –Rest of world ocean surface more fresh Northern Hemisphere warmer than without –Particularly the N Atlantic –Role of atmosphere mixing heat

10
Ocean MOC Role in Abrupt Climate Changes Unforced –Hall and Stouffer Nature Forced –Idealized (Hosing ) - Stouffer et al. JoC 2006

11
Transient An Anomalous Event (Unforced)
")
12
Maximum Negative Anomaly

13
Maximum Positive Anomaly

14
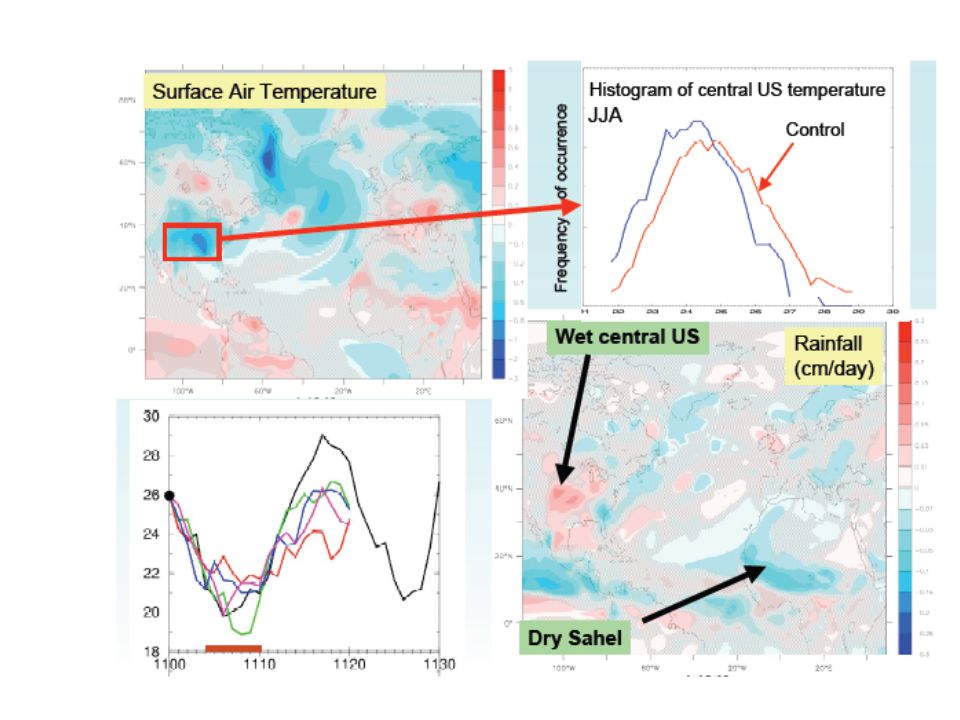
Surface Air Temperature Decadal Mean Difference

15
Surface variables/THC

16
Summary of Physical Mechanism

17
Unforced MOC variability If model if “realistic” –Can we predict this event? –Complicating GHG changes –Possible explanation of some parts of paleo- record

18
Experimental Design Manabe Climate Model “MCM” R30 AOGCM coupled model Idealized Water hosing –1 Sv for 100 years –After 100 years, stop hosing - allow recovery Case 1: Hosing 50N to 70N in Atlantic Case 2: Hosing south of 60S in Southern Ocean Compare to long control integration

19
Simulated Global MOC SH Index box NH Index box

20
Atlantic THC Response SV Years Atlantic THC does not respond in a seesaw-like manner NH Hosing – NH THC shuts down

21
SH THC Response SV Years SH Hosing – SH THC weakens. SH THC does not shut down

22
SAT Difference map SH hosing K Years 51-100 hosing minus 1-200 control

23
Surface Salinity Response 0 100 200 Years 0 100 200 Years NH SH NH SSS anomaly – Intense and confined SH SSS anomaly – Weaker and spreads PSUPSU

24
Differences in Sea Surface Salinity (PSU) Southern Freshwater Escape 25 years 100 years Hosing minus Control
 Southern Freshwater Escape 25 years 100 years Hosing minus Control")
25
Sea Surface Temperature Response 0 100 200 Years 0 100 200 Years NH SH Response more symmetrical than SSS Magnitude also becoming more similar K

26
Surface Air Temperature Response 0 100 200 Years 0 100 200 Years NH SH Response remarkably symmetrical ( first 100 yrs ) Magnitude very similar K
 Magnitude very similar K")
27
Precipitation Response 0 100 200 Years 0 100 200 Years NH SH Response very symmetric Magnitude very similar ITCZ shifts toward warmer hemisphere Cm/ day

28
Hosing Experiment Summary Symmetrical Atmospheric Response Much less symmetry in ocean Why? –Strong Circum-Antarctica winds –Northward flowing surface waters –Freshwater “escapes” into other basins Far a field impacts Less local impacts

29
MOC Predictability Unforced Changes –Are MOC predictable? –How long into future –Manifest in surface changes? Forced - GHG increase –Does MOC weaken? –How much? –Likelihood of complete shutdown?

30
Predictability Investigations just starting Perfect model experiments Use ICs from long control –Ocean ICs unchanged from control –Atmosphere ICs shifted in time by day or 2 Probably “best case” for predictability –No model errors –Ocean ICs perfectly known

31
Predictability of Atlantic Meridional Overturning Circulation (AMOC) in GFDL CM2.1 Climate Model
 in GFDL CM2.1 Climate Model")
33
Are past ocean observations good enough to constrain MOC? Past ocean observations mainly XBTs –Temperature only –Upper 700 m or so Since 2003 or so – ARGO –T, S –Upper 2 km

34
Can Observations constrain the MOC? Need ARGO and atmospheric data to constrain MOC Other research suggests this may be too pessimistic.

35
A AR4 WG1 Assessment: MOC very likely to weaken MOC shutdown very unlikely MOC and Forced Climate Change

36
Why does MOC slow down as GHG increase? Role of surface fluxes –Heat fluxes –Water fluxes

37
Design of Partially Coupled Experiments Gregory et al. 2006 GRL Run control and 1% per year CO2 increase experiment –Save out surface fluxes Use water fluxes from control in 1% run –TRAD_CH2O Use water fluxes from 1% in control –CRAD_TH2O Isolates role of heat and water fluxes

38
Summary of Partially Coupled Experiment Conclusions: 1. Heat fluxes changes always weaken MOC 2. Water fluxes changes mixed, but usually weaken MOC 3. Response to heat flux changes fairly uniform

39
Warming greatest over land and at most high northern latitudes and least over Southern Ocean and parts of the North Atlantic Ocean Weakening of MOC contributes to minimum in cooling in N Atlantic => smaller climate change => a positive impact? Surface Warming Pattern A1B, 2090-2099 relative to 1980-1999 IPCC WGI SPM

40
Summary: Ocean’s Role in Abrupt Climate Change Unforced –Possible to have large abrupt climate changes in AOGCMs Forced –Idealized Allows easy study of climate response Application to paleo-data and future climate changes –GHG increase Predictability of MOC changes

41
Questions Basic Issues –Why does the MOC exist? –How much mixing is there in the ocean? Do models have too much/too little? Impacts of mixing on the MOC What are the physical processes? –What is the role of ocean eddies? –How does MOC changes impact biology and associated changes in atmospheric pCO2?

42
Questions Variability –Are observations good enough to constrain MOC? –Are the MOC changes predictable? Time scale? Does it matter for where people live? Paleo-data tests? –What is role of MOC variability/changes in tropical Atlantic SST/hurricane changes? Future –Is future weakening of the MOC “bad”? –Interactions with Greenland/Antarctic ice melting

43
Thank you

Similar presentations
>")

 Paulo Nobre (INPE) São Paulo Summer School on Global Climate Modeling October,>")


, University of Hamburg.>")


 project.>")


, Fichefet T. (1), Huybrechts P. (2), Goosse H. (1), Driesschaert E, Loutre M.-F (1), (1) Université catholique de Louvain, Institut.>")


 By Ross Alter. What is it? “…that part of the ocean circulation which is driven by fluxes of heat and freshwater across.>")
