Download presentation
Presentation is loading. Please wait.

1
Quantitative Monitoring in Oil and Gas Reclamation: What can it do for you? Tamera Minnick Colorado Mesa University Grand Junction, Colorado

2
Oil and Gas Activity in Western North America is Extensive and Increasing

3
Challenges for Restoration in Colorado Active, Abandoned and Permitted Oil & Gas Wells Well data from Sky Truth [http://www.skytruth.org/]

4
Challenges for Restoration in Colorado (www.colorado.gov/cogcc)

5
Challenges for Restoration in western U.S. Dispersed energy development –1-16 well pads per 640 acres –Numbers of new wells/yr –Linear disturbances of roads and pipelines –Repeat disturbance Arid and Semi-arid climate Weeds Remoteness –50-100 miles from nearest towns COGCC GIS Online [http://dnrwebcomapg.state.co.us/mg2010app/]

6
Sagebrush steppe has been reduced by > 50% since before European settlement Greater sage-grouse distribution decreased by 56% and abundance by 93% Only 3% of sage-grouse habitat is federal land More than 81% of its range impacted by grazing, oil and gas development and cheatgrass Impacts of Natural Gas Development on Wildlife (after Schroeder et al. 2004. Condor 106:363-376)
.")
7
The Shrinking Sagebrush Sea by Mark Salvo of WildEarth Guardians, 2008 Impacts of Natural Gas Development on Wildlife Habitat: Sage Grouse

8
Impacts of natural gas development on mule deer habitat Direct loss of habitat through surface disturbances Indirect loss of habitat use due to increased human activity (noise, traffic) Pinedale, WY development from 2000: 700 well pads, 645 km pipeline, 444 km roads located in prime winter range habitat with one of the largest densities (19-30 deer/km2) Primarily big sagebrush and sagebrush- grassland communities No evidence that mule deer acclimated or habituated to development Tracked radio-collared deer before development (winters 1998-1999 and 1999-2000), during development (winters 2000-2001, 2001-2002, and 2002-2003) Used a GIS with 5 predictor of winter mule deer distribution: elevation, slope, aspect, road density and distance to well pad to estimate habitat use throughout area Sawyer, H., R.M. Nielson, F. Lindzey and L.L. McDonald. 2006. Winter habitat selection of mule deer before and during development of a natural gas field. Journal of Wildlife Management 70:396-403. Impacts of Natural Gas Development on Wildlife Habitat: Mule Deer

9
Bird response to roads for natural gas development Ingelfinger, F., and S. Anderson. 2004. Passerine response to roads associated with natural gas extraction in a sagebrush steppe habitat. Western North American Naturalist 64:385-395. Jonah Field and Pinedale Project Area Density of sagebrush obligates (especially Brewer’s and Sage Sparrows) reduced 39-60% within a 100m buffer around dirt roads with low traffic volumes (< 700 vehicles per day) Impacts of Natural Gas Development on Wildlife Habitat: Birds
 reduced 39-60% within a 100m buffer around dirt roads with low traffic volumes (< 700 vehicles per day) Impacts of Natural Gas Development on Wildlife Habitat: Birds.")
10
International Energy Agency “Golden Rules” to usher in “Golden Era of Natural Gas” level of environmental performance and public acceptance that can maintain or earn the industry a “social license to operate “Reclamation and rehabilitation of oil and gas exploration and production activities is a key part of the process of ensuring continued access to oil and natural gas resources in the United States.” -Comprehensive Reclamation Strategy for Oil & Gas Exploration and Production Operations by Heather N. Smith, University of Denver, Capstone Project for Master of Applied Science, March 11, 2009 UINTA BASIN HOOKLESS CACTUS, http://www.cnhp.colostate.edu

11
From COGCC website

13
Chenowith, D., D. Holland, G. Jacob, L. Kruckenberg, J. Rizza, and B. Whiteley. 2010. The economic benefits of completing reclamation successfully the first time for oil and gas sites. Proceedings of the 19 th High Altitude Revegetation Workshop. March 2-4, 2010, Ft. Collins, CO.

14
(Palmer and Filoso, Science 2009) Reclamation of Disturbed Lands Returns Ecosystem Function and Ecosystem Services
 Reclamation of Disturbed Lands Returns Ecosystem Function and Ecosystem Services")
15
89 studies (< 5 – 300 years) Categories from Millenium Ecosystem Assessment Supporting – nutrient cycling and primary production Provisioning – timber, fish, food crops Regulating – climate, water supply, soil characteristics Rey Benayas, J.M., A.C. Newton, A. Diaz, and J.M. Bullock. 2009. Enhancement of biodiversity and ecosystem services by ecological restoration: A meta-analysis. Science 325:1121-1124. Reclamation Enhances Biodiversity and Ecosystem Services

16
Resistance to change in the first place Resilience to initial conditions after a perturbation No resilience if a threshold has been passed – new stable state (Laycock 1991) State and Transition models (Laycock 1991) Biodiversity Enhances Resistance to and Resilience after Disturbance
 State and Transition models (Laycock 1991) Biodiversity Enhances Resistance to and Resilience after Disturbance")
17
CANOPY COVER OF VEGETATION FUNCTIONAL GROUPS ON ABANDONED GAS WELL PADS OF VARYING AGE Weeds, the 80% threshold, & “reflecting” reference area vegetation Variation extracted Axis 1: 48.41% Axis 2: 28.33% Total: 76.73% If novel species alter ecosystem functions away from desired objectives, they need to be explicitly and quantitatively evaluated Only 1 site (1976) “reflects” the composition of Reference A BRTE Sand ARTR Silt, SOM AGCR, BRIN NH4 PASM, HiJA
 reflects the composition of Reference A BRTE Sand ARTR Silt, SOM AGCR, BRIN NH4 PASM, HiJA")
18
SOIL FUNCTION ON ABANDONED GAS WELL PADS OF VARYING AGE

20
Performance-Based Standards: A performance based standard states goals and objectives to be achieved and describes methods that can be used to demonstrate whether or not products and services meet the specified goals and objectives. Best Management Practices: Contrast a prescriptive standard, which typically prescribes materials, design and construction methods frequently without stating goals and objectives. http://cstools.asme.org

21
US Executive Order 12866 in 1993 (Clinton Administration) “(8) Each agency shall identify and assess alternative forms of regulation and shall, to the extent feasible, specify performance objectives, rather than specifying the behavior or manner of compliance that regulated entities must adopt.” Retained by Presidents Bush and Obama http://www.blm.gov
 (8) Each agency shall identify and assess alternative forms of regulation and shall, to the extent feasible, specify performance objectives, rather than specifying the behavior or manner of compliance that regulated entities must adopt. Retained by Presidents Bush and Obama")
22
New Technology Performance based standards allow earlier use of new technology. The users of these standards are free to implement new technology as soon as it is demonstrated, without waiting for standards development committees to modify standards to explicitly permit use of new technology. Innovation Performance based standards encourages people to find optimum ways to meet performance criteria, which results in building the knowledge base and developing the entrepreneurial spirit, which in turn leads to economic development (more successful reclamation) Barriers to Trade Performance based standards permit the use of new or nontraditional parts and methods when their use meets the performance criteria. This widens the marketplace, no longer limiting the acceptable suppliers to those manufacturers or countries with specific resources. http://cstools.asme.org
 Barriers to Trade Performance based standards permit the use of new or nontraditional parts and methods when their use meets the performance criteria. This widens the marketplace, no longer limiting the acceptable suppliers to those manufacturers or countries with specific resources.")
23
Transparency Performance based standards that have clearly stated goals and objectives answer the question of what is to be achieved. For most prescriptive standards, the goals and objectives are implied at best and unknown at worst. For many rules in prescriptive standards, we cannot answer with certainty the question of what end function is to be achieved. Efficiency The development and maintenance of performance based standards ultimately requires less effort. While initially more difficult to establish goals and objectives, the decision for inclusion or not of various requirements is much simpler. Maintenance can be simpler as well. For example, a standard that describes the properties of acceptable materials of construction is much easier to maintain than one that lists acceptable materials by reference to various material standards. http://cstools.asme.org

24
Performance Based Bolted flanged joints shall be leak-free for the intended service. The joint shall be hydrotested at 1.5 times the design pressure without leaking, and shall be demonstrated to be able to withstand expected external forces without leakage while at design pressure and temperature. Advantage – allows users complete freedom to use any suitable products Disadvantage – testing and calculations are required for proven solutions Prescriptive Bolted flanged joints shall meet the requirements of ASME B16.5, or ASME B&PV Code Section VIII, Division 1, Appendix 2 Advantage – gives clear guidance on what is required Disadvantage – does not allow users to use suitable innovative products that may be available Example from reclamation (Colorado): “Interim reclamation shall occur no later than three (3) months on crop land or six (6) months on non-crop land after such operations unless the Director extends the time period because of conditions outside the control of the operator.”
: Interim reclamation shall occur no later than three (3) months on crop land or six (6) months on non-crop land after such operations unless the Director extends the time period because of conditions outside the control of the operator. .")
25
Establish goals for the standard: broad, qualitative statement Specify assumptions: state of equipment, state of area to be reclaimed (i.e., sodic soils) Establish objectives and performance criteria: more specific than goals, quantitative Verification: monitor and report
 Establish objectives and performance criteria: more specific than goals, quantitative Verification: monitor and report")
26
Bureau of Land Management’s Surface Operating Standards and Guidelines for Oil and Gas Exploration and Development (The Gold Book) Ch 6 Reclamation and Abandonment BMPs
 Ch 6 Reclamation and Abandonment BMPs")
27
Interim Reclamation a uniform vegetative cover has been established that reflects pre- disturbance or reference area forbs, shrubs, and grasses with total percent plant cover of at least eighty percent (80%) of pre- disturbance levels or reference areas, excluding noxious weeds. Re-seeding alone is not sufficient. a minimum four (4) photographs taken during the growing season facing each cardinal direction which document the success of the interim reclamation and one (1) photograph which documents the total cover of live perennial vegetation of adjacent or nearby undisturbed land or the reference area. Final a uniform vegetative cover has been established that reflects pre-disturbance or reference area forbs, shrubs, and grasses with total percent plant cover of at least eighty percent (80%) of pre- disturbance or reference area levels, excluding noxious weeds determined by the Director through a visual appraisal.
 photographs taken during the growing season facing each cardinal direction which document the success of the interim reclamation and one (1) photograph which documents the total cover of live perennial vegetation of adjacent or nearby undisturbed land or the reference area. Final a uniform vegetative cover has been established that reflects pre-disturbance or reference area forbs, shrubs, and grasses with total percent plant cover of at least eighty percent (80%) of pre- disturbance or reference area levels, excluding noxious weeds determined by the Director through a visual appraisal..")
28
Surface Mining Control and Reclamation Act (SMCRA) of 1977 Regulations of the Colorado Mined Land Reclamation Board for Coal Mining, 1980 http://www.archcoal.com/images/reclamation-5.jpg
 of 1977 Regulations of the Colorado Mined Land Reclamation Board for Coal Mining,")
29
Revegetation Success Criteria Depends On Post-Mining Use of Disturbed Area Regulations of the Colorado Mined Land Reclamation Board for Coal Mining, August 30, 1980

30
Ensure successful reclamation is occurring Provide information on methods to increase success in future

31
Smith, K.A., and J.C. Chambers. 1993. Comparing revegetation success on monitored and nonmonitored gas well sites in Southwestern Wyoming. USDA Forest Service, Research note INT-417. Monitoring programs for oil and gas industry are vague and vary among Federal land management agencies, regions, districts, and projects. Soil stability and vegetation Riley Ridge Natural Gas area in SW Wyoming, Exxon Corporation’s LaBarge Fogarty Creek Unit 7800-9700 ft in elevation Mountain big sagebrush or Wyoming big sagebrush and bluebunch wheatgrass 8 nonmonitored and 5 monitored well sites reclaimed in 1984, 1985 or 1986 with 13 adjacent reference sites Cover by vegetation or litter was higher in the monitored vs. nonmonitored sites, while bareground was higher in the monitored site

32
Other results There were more seeded species on monitored (3.2) vs. nonmonitored (1.3) sites Relative percent cover by desirable species was higher on the monitored (92.4%) vs nonmonitored sites (55.9%) Mean number of species was higher on monitored (9.0) vs. nonmonitored (4.6) sites, although reference sites were higher than either of these (14) There was > 5% weed cover on 1 monitored site and 4 nonmonitored sites Sites which were monitored showed better reclamation success
 sites Relative percent cover by desirable species was higher on the monitored (92.4%) vs nonmonitored sites (55.9%) Mean number of species was higher on monitored (9.0) vs. nonmonitored (4.6) sites, although reference sites were higher than either of these (14) There was > 5% weed cover on 1 monitored site and 4 nonmonitored sites Sites which were monitored showed better reclamation success.")
33
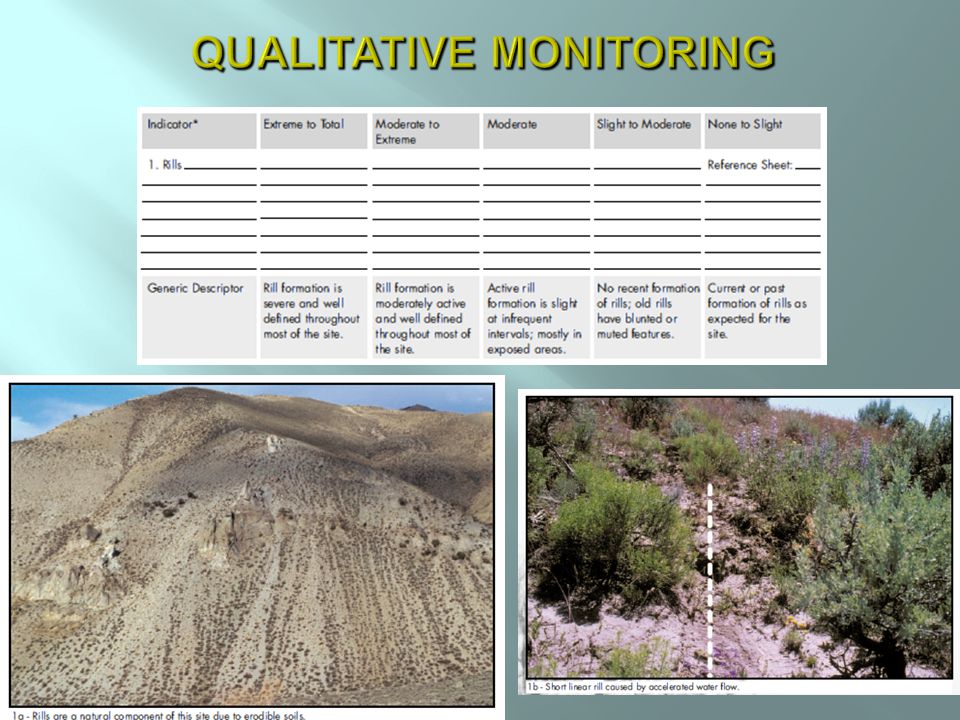
Although Qualitative Data Collection seems easier, it may actually take more training to have consistent results

38
More time to train Results less standardized among groups

42
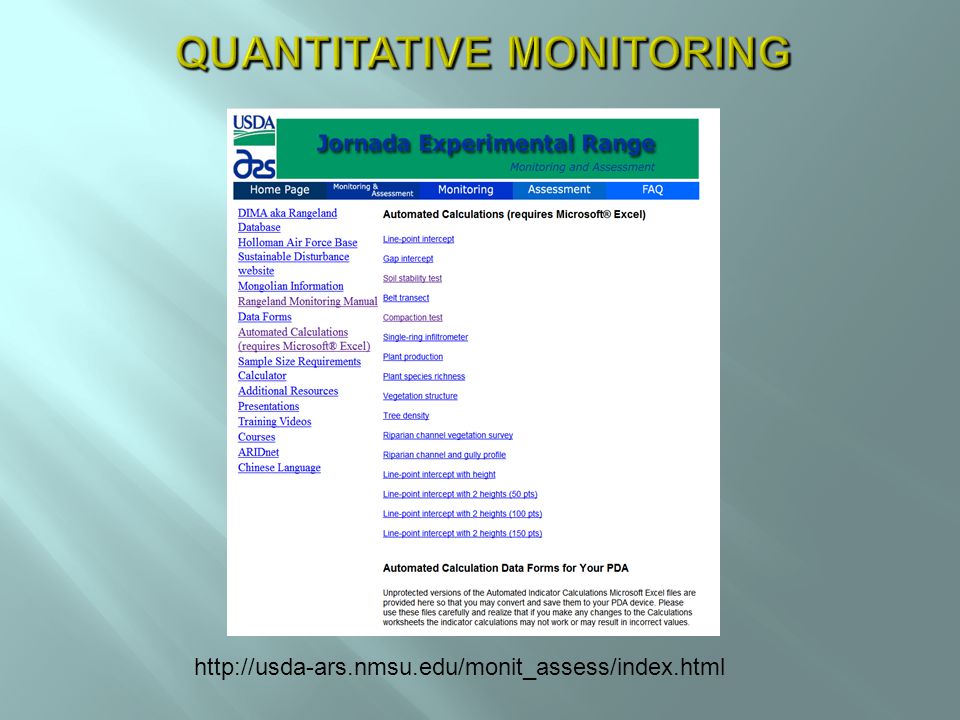
http://usda-ars.nmsu.edu/monit_assess/index.html
45
467 documents, primarily in western US, 2001-2010 185 hits on the word “monitor” Required vs. recommended Pre & post Quantitative 6 EIS/Record of Decision primarily in Wyoming Atlantic Rim, Jonah Infill, Powder River Basin, Desolation Flats Roan Plateau, CO (recommended) State Wildlife Divisions recommended Colorado, New Mexico, Wyoming
 State Wildlife Divisions recommended Colorado, New Mexico, Wyoming.")
46
Oil and gas activity in western North America is extensive and increasing These activities have impacts on wildlife and ecosystem function It is important to successfully reclaim these areas to achieve ecosystem function This may also allow industry continued access to these resources The best way to insure reclamation is through the use of Performance-Based Standards PBS requires monitoring Quantitative monitoring is preferred.

Similar presentations


 Grazing – Our Most Commonly Used Conservation Practices.>")


