Download presentation
Presentation is loading. Please wait.

1
Cancer-related beliefs and behaviour in low-, middle- and high-income countries

2
Overview Survey development and methodology Participating countries Risk factor behaviour Screening and diagnosis Cancer prevention beliefs Risk factors and prevention beliefs

3
Why do a population survey? Beliefs influence lifestyle choices, participation in screening and treatment decisions Cancer prevention programmes need to be informed by local population data to design programmes and evaluate progress Aims: Enhance collection of comparable population survey data about cancer beliefs and behaviours across countries where there are UICC member organizations Develop capacity in UICC member organizations to use such survey data to develop population-based cancer control programmes and policies and evaluate their impact

4
Survey development The UICC partnered with Roy Morgan Research Company and Gallup International Technical advisory group to advise on survey development and reporting: Dr Melanie Wakefield, Australia Dr Sharon Campbell, Canada Dr Michael Stefanek, USA Dr Jane Wardle, Britain Dr Hein de Vries, Netherlands

5
Survey methodology Data collection commenced in October 2007 The same survey questions were asked, regardless of administration method, in the language/s spoken by the majority of each country’s population Randomly selected population sample Administered face to face or by phone, depending on the country’s infrastructure Often as part of Gallup affiliate omnibus survey to defray costs For the information presented in the subsequent slides, the margin of error is ± 1.32%

6
Standard set of questions Personal characteristics (age, sex, employment status, occupation, religion, personal cancer experience, family cancer experience) Risk factor behaviour (smoking, alcohol use, physical activity, sun protection, body mass index) Screening participation Beliefs about treatment Beliefs about risk factors for cancer
 Risk factor behaviour (smoking, alcohol use, physical activity, sun protection, body mass index) Screening participation Beliefs about treatment Beliefs about risk factors for cancer")
7
First 29 countries participating in survey Australia (1272) Austria (920) Bolivia (1296) Canada (1070) China (1000) Czech Republic (500) Dominican Republic (500) Georgia (1000) Greece (500) Guatemala (500) Indonesia (1081) Israel (992) Kenya (500) Lebanon (500) Mexico (518) New Zealand (858) Nigeria (5021) Panama (502) Peru (1206) Philippines (1000) Romania (947) Serbia (1004) Spain (1000) Turkey (2019) Ukraine (1137) United Kingdom (691) United States of America (855) Uruguay (500) Venezuela (1036)
 Austria (920) Bolivia (1296) Canada (1070) China (1000) Czech Republic (500) Dominican Republic (500) Georgia (1000) Greece (500) Guatemala (500) Indonesia (1081) Israel (992) Kenya (500) Lebanon (500) Mexico (518) New Zealand (858) Nigeria (5021) Panama (502) Peru (1206) Philippines (1000) Romania (947) Serbia (1004) Spain (1000) Turkey (2019) Ukraine (1137) United Kingdom (691) United States of America (855) Uruguay (500) Venezuela (1036)")
8
Categorization of these countries: World Bank income groups CategoryIncluded countries Low income (N=5521) Kenya Nigeria Middle income (N=15746) Bolivia China Dominican Republic Georgia Guatemala Indonesia Lebanon Mexico Panama Peru Philippines Romania Ukraine Serbia Turkey Venezuela Uruguay High income (N=8658) Australia Austria Canada Czech Republic Greece Israel New Zealand Spain UK USA
 Kenya Nigeria Middle income (N=15746) Bolivia China Dominican Republic Georgia Guatemala Indonesia Lebanon Mexico Panama Peru Philippines Romania Ukraine Serbia Turkey Venezuela Uruguay High income (N=8658) Australia Austria Canada Czech Republic Greece Israel New Zealand Spain UK USA")
9
12 additional countries (awaiting data) Albania Algeria Belgium Ethiopia Finland Germany Ghana India Italy Ivory Coast Pakistan Switzerland
 Albania Algeria Belgium Ethiopia Finland Germany Ghana India Italy Ivory Coast Pakistan Switzerland")
10
Categorization of all 41 countries: World Bank income groups CategoryIncluded countriesAdditional countries Low income (N=5521) Kenya Nigeria Ethiopia Ghana India Ivory Coast Pakistan Middle income (N=15746) Bolivia China Dominican Rep. Georgia Guatemala Indonesia Lebanon Mexico Panama Peru Philippines Romania Ukraine Serbia Turkey Venezuela Uruguay Albania Algeria High income (N=8658) Australia Austria Canada Czech Republic Greece Israel New Zealand Spain UK USA Belgium Finland Germany Italy Switzerland
 Australia Austria Canada Czech Republic Greece Israel New Zealand Spain UK USA Belgium Finland Germany Italy Switzerland.")
11
Risk factor behaviour Smoking status Alcohol consumption Level of physical activity Weight Sun exposure

12
Prevalence of tobacco use Tobacco use was determined by asking “In the last 12 months have you used any tobacco products…” If respondents indicated that they had used cigarettes, roll your own tobacco, pipe, cigars, chewing tobacco, snuff or bidis they were classified as a tobacco user If respondents replied “no, none” they were classified as not being a tobacco user As illustrated in the next figure, there was a large difference in the prevalence of tobacco users in low-income countries in comparison to tobacco users in middle- and high-income countries

13
Prevalence of tobacco use

14
Tobacco use was determined by asking “In the last 12 months have you used any tobacco products…” If respondents indicated that they had used cigarettes, roll-your- own tobacco, pipe, cigars, chewing tobacco, snuff or bidis they were classified as a tobacco user If respondents replied “no, none” they were classified as not using tobacco As illustrated in the next figure, across income categories, tobacco use is more prevalent amongst males than females This gender difference is most pronounced in the low-income category, where males are 11 times more likely than females to use tobacco Prevalence of tobacco use

16
Alcohol consumption Alcohol consumption was determined by asking “In the last 12 months have you had an alcoholic drink of any kind? If yes, about how often do you have an alcoholic drink?” If respondents replied “most days” or “5 or 6 days a week” they were classified as a frequent consumer If they replied “3 or 4 days a week” or “once a week” they were classified as a moderate consumer If respondents replied “2 or 3 times a month” “once a month” “less often” or “rarely” they were classified as an occasional consumer Individuals who responded “no, never, or don’t drink” were classified as never consuming alcohol. The majority of respondents in low-income countries do not drink alcohol Respondents in high-income countries were nearly three times more likely to identify that they were frequent alcohol consumers

17
Alcohol consumption

18
Vigorous physical activity Physical activity was assessed by asking “How often do you do hard physical or vigorous activity…” in three contexts: work; home; or at a gym, sports place or somewhere else Based on National Physical Activity Guidelines for Australians, a recommended level of physical activity was engaging in activity “most days”, “5 or 6 days a week” Less than recommended was engaging in physical activity “3 or 4 days a week” “once a week”, “2 or 3 times a month”, “once a month”, “less often”, “rarely” or “never” In low- and high-income countries, more physical activity was occurring at home than at work or at a gym Those in high-income countries appear to engage in higher overall physical activity than others

19
Vigorous physical activity

20
Body mass index Estimates of height and weight were used to calculate BMI Respondents were then classified as being either of an acceptable/healthy weight or as overweight/obese based on WHO weight recommendations Those in middle-income countries were the only group where the majority of respondents were of a healthy weight Note: Question not asked of respondents in Austria and Israel

21
Body mass index

22
Sun exposure Sun exposure was determined by asking, “In the last 12 months have you been sunburnt? By sunburnt I mean any reddening of the skin after being outside in the sun?” As illustrated in the figure, the majority of respondents did not report being sunburnt in the last 12 months. However, a greater percentage of those in high-income countries reported being sunburnt than others

23
Sun exposure

24
Screening and diagnosis Cancer screening Individual and immediate family cancer diagnosis Beliefs about a cure for cancer following diagnosis Expectations about medical treatment decision-making

25
Cancer screening Individuals were asked “Have you ever had a cancer screening test, blood test, or some other test for cancer?” If respondents replied yes, they were asked, “Which, if any, of the following cancer tests have you had? Bowel or colon cancer check; Skin cancer check; Lung cancer check; (if female) pap test or pap smear; (if female) mammogram or breast x-ray; (if male) prostate check; other check” In low- and middle-income countries, over 80% of respondents reported not being screened for cancer Those in high-income countries were 4.9 times more likely (and middle-income respondents were 1.7 times more likely) to report being screened for cancer than those in low-income countries
 pap test or pap smear; (if female) mammogram or breast x-ray; (if male) prostate check; other check In low- and middle-income countries, over 80% of respondents reported not being screened for cancer Those in high-income countries were 4.9 times more likely (and middle-income respondents were 1.7 times more likely) to report being screened for cancer than those in low-income countries.")
26
Cancer screening

27
Previous cancer screening Individuals were asked “Have you ever had a cancer screening test, blood test, or some other test for cancer?” If respondents replied yes they were asked “Which, if any, of the following cancer tests have you had? Bowel or colon cancer check; Skin cancer check; Lung cancer check; (if female) pap test or pap smear; (if female) mammogram or breast x-ray; (if male) prostate check; other check” In low-income countries, screening experience did not vary by age, but it increased with age in other countries In high-income countries, 65% of respondents aged 40+ reported previous screening for cancer, compared with 30% and 11% respectively of those in middle- and low-income countries
 pap test or pap smear; (if female) mammogram or breast x-ray; (if male) prostate check; other check In low-income countries, screening experience did not vary by age, but it increased with age in other countries In high-income countries, 65% of respondents aged 40+ reported previous screening for cancer, compared with 30% and 11% respectively of those in middle- and low-income countries.")
28
Previous cancer screening

29
Males were asked “Have you ever had a cancer screening test, blood test, or some other test for cancer?” If respondents replied yes, they were asked, “Which, if any, of the following cancer tests have you had?Bowel or colon cancer check; Skin cancer check; Lung cancer check; prostate check; other check” Within low- and middle-income countries, over 85% of males reported not being previously screened for cancer In high-income countries, 56% of males had not been previously screened

30
Previous cancer screening

31
Males were asked “Have you ever had a cancer screening test, blood test, or some other test for cancer?” If respondents replied yes they were asked, “Which, if any, of the following cancer tests have you had? Bowel or colon cancer check; Skin cancer check; Lung cancer check; prostate check; other check” In the middle-income category, over one third of men aged 60+ reported screening, compared with over two-thirds of men aged 60+ in high income countries Screening increased with age in both middle- and high-income countries, but not in low-income countries

32
Previous cancer screening

33
Females were asked “Have you ever had a cancer screening test, blood test, or some other test for cancer?” If respondents replied yes they were asked “Which, if any, of the following cancer tests have you had? Bowel or colon cancer check; Skin cancer check; Lung cancer check; pap test or pap smear; mammogram or breast x-ray; other check” Only within the high-income category did the majority of females report being previously screened for cancer Previous cancer screening

35
Females were asked “Have you ever had a cancer screening test, blood test, or some other test for cancer?” If respondents replied yes they were asked “Which, if any, of the following cancer tests have you had? Bowel or colon cancer check; Skin cancer check; Lung cancer check; pap test or pap smear; mammogram or breast x-ray; other check” Screening gradually increases with age in middle-income countries but not in low-income countries In high-income countries, screening rates doubled between the age categories of 18-29 years and 40-49 years Previous cancer screening

37
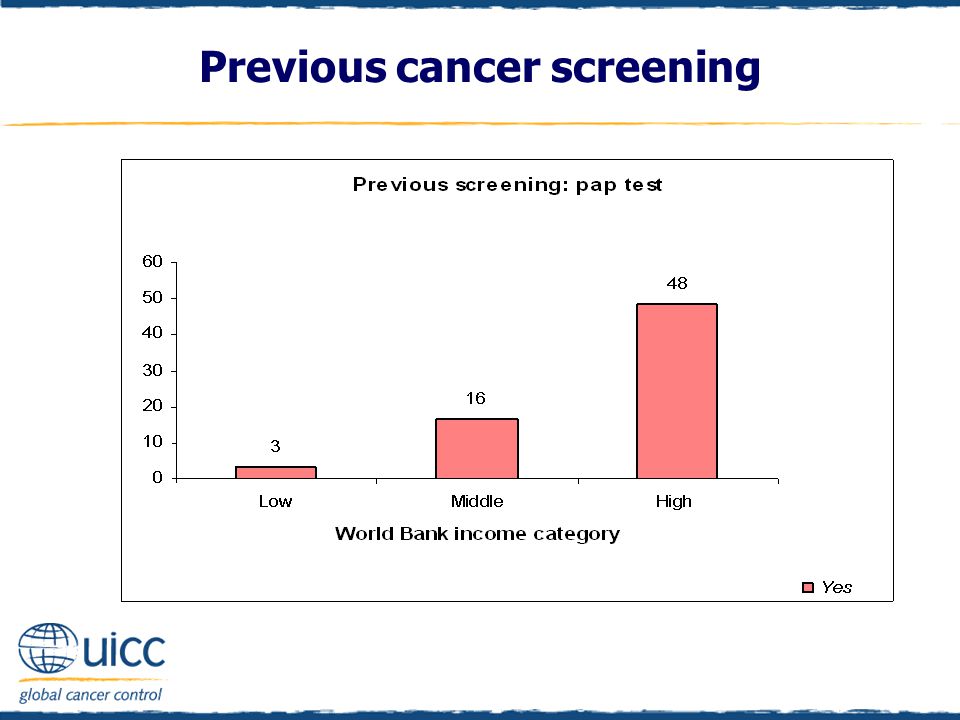
Females were asked “Have you ever had a cancer screening test, blood test, or some other test for cancer?” If respondents replied yes they were asked if they had previously had a pap test or pap smear In high-income countries, 48% of women reported having a pap smear, compared with 16% and 3% respectively in middle- and low-income countries Women in high-income countries are 16 times more likely (and women in middle-income countries are 5.3 times more likely) to report having had a pap test than women in low-income countries Previous cancer screening
 to report having had a pap test than women in low-income countries Previous cancer screening")
39
Females were asked “Have you ever had a cancer screening test, blood test, or some other test for cancer?” If respondents replied yes, they were asked if they had previously had a pap test or pap smear Less than 5% of each age group of women in the low-income countries reported having had a pap test In high-income countries, there was a sharp increase in the number of women reporting a previous pap test after the age of 30, in comparison to women aged 18-29 This trend was less marked, but still apparent, in middle-income countries Previous cancer screening

41
Females were asked “Have you ever had a cancer screening test, blood test, or some other test for cancer?” If respondents replied yes, they were asked if they had previously had a mammogram or breast x-ray Women from high-income countries were 8.8 times more likely than women from low-income countries to have reported having a mammogram Additionally, women in middle-income countries were twice as likely to have had a mammogram than women in low-income countries Previous cancer screening

43
Females were asked “Have you ever had a cancer screening test, blood test, or some other test for cancer?” If respondents replied yes, they were asked if they had previously had a mammogram or breast x-ray In high-income countries, two-thirds of women aged 50+ report having had a mammogram, as do half of those aged 40-49 years Mammograms are infrequent in low-income countries, whereas in middle-income countries, just under one-quarter of those aged 50+ report having had one Previous cancer screening

45
Cancer diagnosis Individuals were asked “Have you ever been diagnosed with cancer?” and responded either “Yes”, “No”, “Don’t know” or “Refused” (to respond) In high-income countries, 10% had been diagnosed with cancer, in comparison to 1% of other respondents A further 7% of respondents in low-income countries did not know if they had been diagnosed with cancer
 In high-income countries, 10% had been diagnosed with cancer, in comparison to 1% of other respondents A further 7% of respondents in low-income countries did not know if they had been diagnosed with cancer")
46
Cancer diagnosis

47
Individuals were asked “Has anyone in your immediate family ever been diagnosed with cancer?” and responded either “Yes”, “No”, “Don’t know” or “Refused” (to respond) In low- and middle-income countries, the majority did not report a diagnosis in their immediate family In contrast, half of high-income respondents indicated that an immediate family member had been diagnosed with cancer Cancer diagnosis
 In low- and middle-income countries, the majority did not report a diagnosis in their immediate family In contrast, half of high-income respondents indicated that an immediate family member had been diagnosed with cancer Cancer diagnosis")
49
Beliefs about a cancer cure To assess beliefs about a cure for cancer, individuals were asked, “Some people believe once a person has cancer not much can be done to cure it - do you agree or disagree with that?” Individuals then indicated agreement, disagreement or whether they were undecided Items were reverse scored for reporting More of those in high-income countries believed much could be done to cure cancer than those in middle- and low-income countries When they become available, cancer screening programmes in low- and middle-income countries will need to overcome these low expectations of the success of cancer treatment, which serve as a barrier to screening participation

50
Beliefs about a cancer cure

51
Medical treatment decision expectations Respondents were asked “When making a decision about what medical treatment to have, what is your preference?” Response categories were: “The doctor should make the decisions using all that is known about treatment” “The doctor should make the decisions but strongly consider your needs and priorities” “The doctor and you should make the decisions together on an equal basis” “You should make the decisions, but would strongly consider the doctor’s opinion” “You should make the decisions using all you know or learn about the treatments” “Can’t say”

52
Respondents were asked “When making a decision about what medical treatment to have, what is your preference?” The two “You should make…” categories were combined for scoring and reporting Most respondents in low-income countries preferred the doctor to make the decisions based on treatment knowledge Those in middle-income countries had a more even spread of views about the relative responsibilities of the doctor or the patient in treatment decisions However, for respondents in high-income countries, decision- making that allows for more self-determination was preferred Medical treatment decision expectations

54
Cancer prevention beliefs Most important health issues Perceptions of cancer causes and risks: Drinking tap water from this area Chewing tobacco Drinking alcohol Not eating vegetables Not eating fruit A lack of cereals or wholegrains Eating fatty foods Eating red meat Being stressed Smoking cigarettes A lack of exercise Being overweight Using mobile/cell phones Exposing your skin to the sun Exposure to air pollution Infection with viruses/bacteria

55
Important health issues Respondents were asked “Which three health issues do you consider most important?” The majority of those in middle- and high-income countries identified cancer as an important health issue In low-income countries, AIDS was the most frequently cited important health issue Thirty seven percent of those in high-income countries also identified heart disease as an important health issue

56
Important health issues

57
Perceived cancer risk Respondents were asked to indicate if they believed drinking tap water from their area increases a person’s risk of cancer or not The majority of respondents in all countries believed that drinking tap water was not a risk 28% of low-income respondents indicated that they “cannot say” if drinking tap water in their area increases a person’s risk of cancer or not

58
Perceived cancer risk

59
Respondents were asked to indicate if they believed smoking cigarettes increases a person’s risk of cancer or not Ninety percent of those in middle-income and 94% of those in high-income countries believed that smoking cigarettes increased the risk of cancer In low-income countries, 69% believed that smoking cigarettes increased the risk of cancer, but nearly one-quarter could not say, suggesting that public education appears needed in low- income countries Perceived cancer risk

61
Respondents were asked to indicate if they believed chewing tobacco increases a person’s risk of cancer or not The majority of respondents believed that chewing tobacco increases the risk of cancer However, 31% of those in middle-income countries did not believe that chewing tobacco increases the risk of cancer Further, 27% of those in low-income countries could not say if chewing tobacco increases the risk of cancer.

62
Perceived cancer risk

63
Respondents were asked to indicate if they believed drinking alcohol increases a person’s risk of cancer or not As the income status of countries increased, there was an increasing percentage of people who thought that alcohol did not elevate cancer risk Perceived cancer risk

65
Respondents were asked to indicate if they believed not eating vegetables increases a person’s risk of cancer or not As the income status of countries increased, there was an increasing percentage of people who thought that not eating vegetables elevated cancer risk Perceived cancer risk

67
Respondents were asked to indicate if they believed not eating fruit increases a person’s risk of cancer or not As the income status of countries increased, there was an increasing percentage of people who thought that not eating fruit elevated cancer risk

68
Perceived cancer risk

69
Respondents were asked to indicate if they believed a lack of cereals and wholegrains increases a person’s risk of cancer or not As the income status of countries increased, there was an increasing percentage of people who thought that a lack of cereals and grains elevated cancer risk Perceived cancer risk

71
Respondents were asked to indicate if they believed eating fatty foods increases a person’s risk of cancer or not As the income status of countries increased, there was an increasing percentage of people who thought that eating fatty foods elevated cancer risk Perceived cancer risk

73
Respondents were asked to indicate if they believed eating red meat increases a person’s risk of cancer or not In comparison to those in low-income countries, a greater percentage of those in middle- and high-income countries thought eating red meat elevated cancer risk A higher percentage in all countries thought eating red meat did not elevate cancer risk Perceived cancer risk

75
Respondents were asked to indicate if they believed a lack of exercise increases a person’s risk of cancer or not As the income status of countries increased, there was an increasing percentage of people who thought that a lack of exercise elevated cancer risk Perceived cancer risk

77
Respondents were asked to indicate if they believed being overweight increases a person’s risk of cancer or not As the income status of countries increased, there was an increasing percentage of people who thought that being overweight elevated cancer risk Perceived cancer risk

79
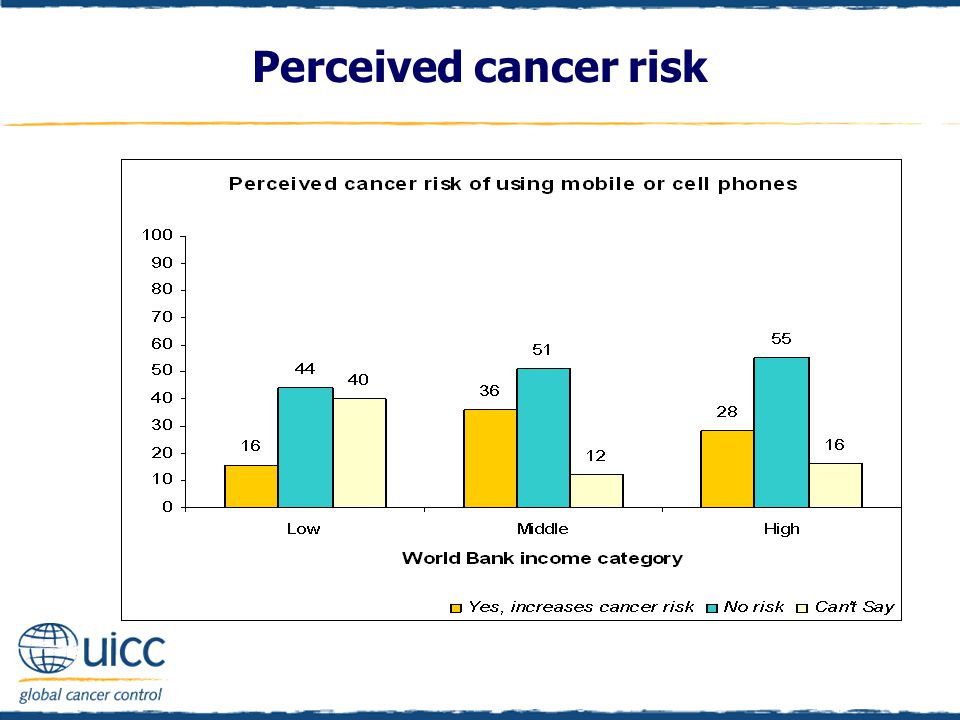
Respondents were asked to indicate if they believed using a mobile phone increases a person’s risk of cancer or not As the income status of countries increased, there was an increasing percentage of people who thought that using mobile or cell phones did not elevate cancer risk Perceived cancer risk

81
Respondents were asked to indicate if they believed exposing your skin to the sun increases a person’s risk of cancer or not As the income status of countries increased, there was an increasing percentage of people who thought that exposing your skin to the sun elevated cancer risk Perceived cancer risk

83
Respondents were asked to indicate if they believed exposure to air pollution increases a person’s risk of cancer or not Those in middle- and high-income countries were more likely than those in low-income countries to think that air pollution elevated cancer risk Perceived cancer risk

85
Respondents were asked to indicate if they believed infection with viruses or bacteria increases a person’s risk of cancer or not Those in middle- and high-income countries were more likely than those in low-income countries to think that infection with viruses or bacteria elevated cancer risk Perceived cancer risk

87
Respondents were asked to indicate if they believed being stressed increases a person’s risk of cancer or not Those in middle- and high-income countries were more likely than those in low-income countries to think that being stressed elevated cancer risk Perceived cancer risk

89
Tobacco use and perceived cancer risk of smoking cigarettes Tobacco use and perceived cancer risk of chewing tobacco Alcohol consumption and perceived cancer risk of drinking alcohol Sunburn in the last 12 months and perceived cancer risk of sun exposure Body mass index and perceived cancer risk of being overweight Level of physical activity and perceived cancer risk of a lack of exercise Cancer risk factors and prevention beliefs

90
In all countries, a smaller percentage of tobacco users thought cigarettes elevated cancer risk, compared with those who did not consume tobacco This relative difference narrowed between those who did and did not consume tobacco as the income level of countries increased Cancer risk factors and prevention beliefs

92
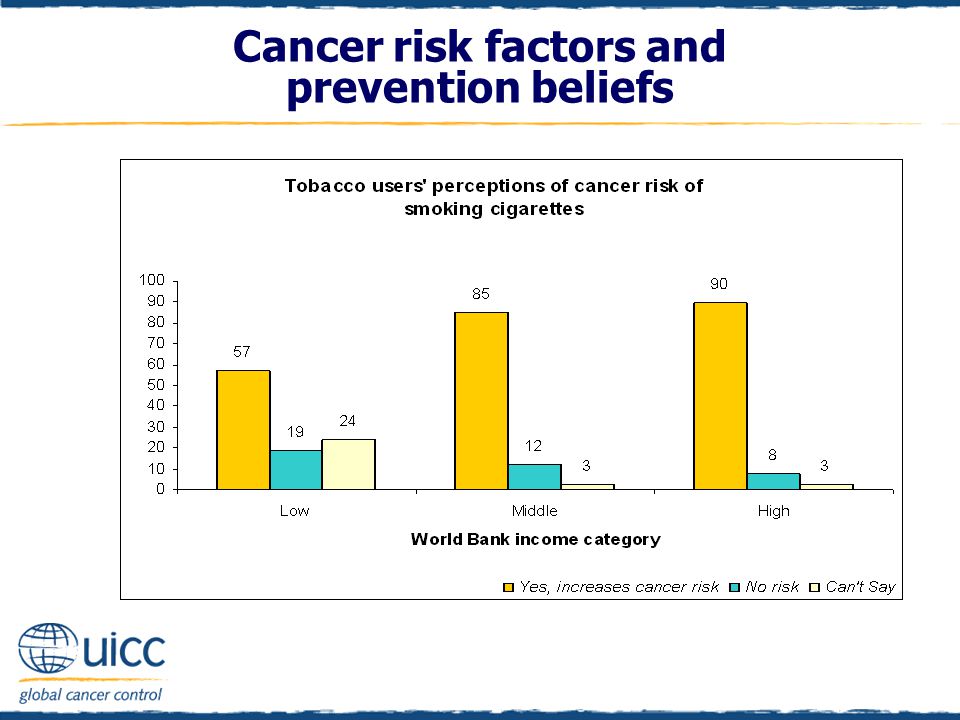
As income status increased, there was an increasing percentage of tobacco users who believed that smoking cigarettes increases cancer risk Twenty-four percent of low-income country tobacco users could not say if smoking cigarettes increases the risk of cancer or not Cancer risk factors and prevention beliefs

94
In all countries, a smaller percentage of tobacco users thought chewing tobacco elevated cancer risk, compared with those who did not consume tobacco Over one-third of middle-income tobacco users believed that chewing tobacco was not a cancer risk in comparison to 12% of tobacco users in high-income countries and 19% of tobacco users in low-income countries Cancer risk factors and prevention beliefs

96
In high-income countries, tobacco users were more likely than low- or middle-income tobacco users to believe that chewing tobacco increases the risk of cancer Over one quarter of tobacco users in low-income countries indicated that they “can’t say” whether chewing tobacco increases a person’s cancer risk Cancer risk factors and prevention beliefs

98
Within each income category, those who more often drank alcohol were less likely to perceive that alcohol increased cancer risk Of note, 52% of frequent drinkers in high-income countries and 49% of frequent drinkers in middle-income countries believed there was no cancer risk associated with drinking alcohol Cancer risk factors and prevention beliefs

100
As income status increased, the percentage of frequent drinkers who believed that there was no cancer risk associated with drinking alcohol increased In addition, in the low-income category 45% of frequent drinkers could not say whether drinking alcohol increases a person’s risk of cancer Cancer risk factors and prevention beliefs

102
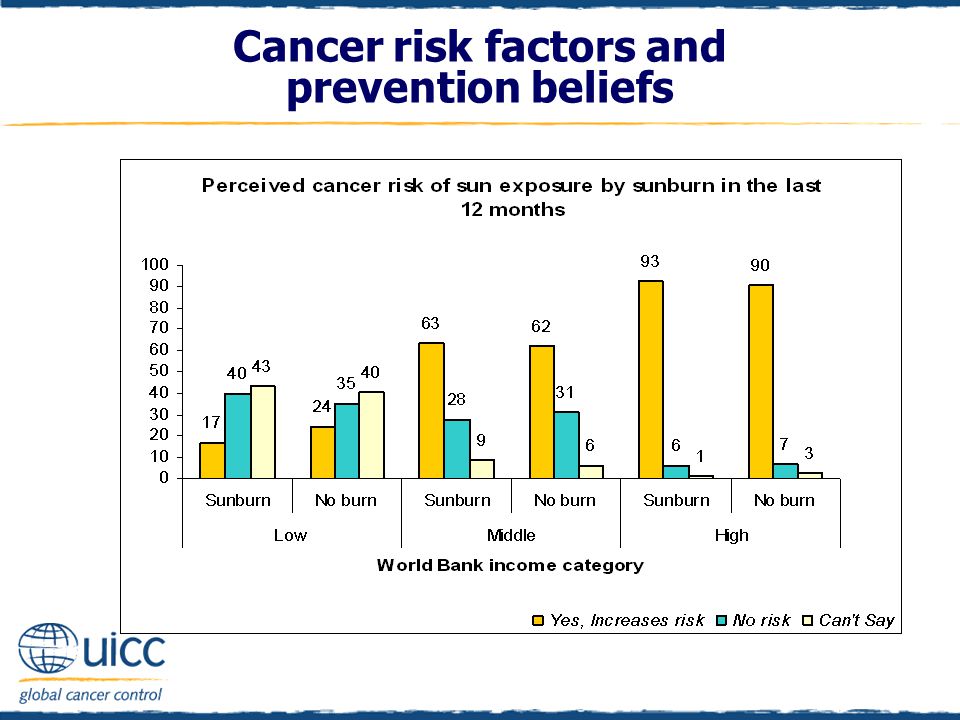
As the income status of countries increased, there was an increasing percentage of people who thought that exposing one’s skin to the sun elevated cancer risk Cancer risk factors and prevention beliefs

104
In all countries, individuals who did and did not report being sunburnt had similar perceptions of the cancer risk associated with exposing one’s skin to the sun Cancer risk factors and prevention beliefs

106
As income status increased, an increasing percentage of respondents believed that being overweight increases the risk of cancer High- and middle-income overweight/obese respondents were over 3 times more likely to perceive being overweight as increasing the risk of cancer than overweight/obese individuals from low-income countries Cancer risk factors and prevention beliefs

108
Overweight/obese respondents from high- and middle-income countries were over 3 times more likely to perceive being overweight as increasing the risk of cancer than overweight/obese individuals from low-income countries Cancer risk factors and prevention beliefs

110
Further enquiries? Unit-record-level data is available for further data analysis by the UICC member organization, provided it is not sold on to any third party. Visit www.cancervic.org.au/uicc for more detailed graphs on all the data items by World Bank income category or email UICCpopulationsurvey@cancervic.org.auwww.cancervic.org.au/uicc UICCpopulationsurvey@cancervic.org.au Future analyses will be posted to this website in the coming months

Similar presentations


 strives to create innovative partnerships that empower low-income Californians to increase.>")
>")


 Tuberculosis (TB) and Life Styles NFHS-3, 2005-06.>")


 having a regular doctor.>")