Download presentation
Presentation is loading. Please wait.

1
M. Zareinejad

2
Methodology for investigating relationships between sensations in the psychological domain and stimuli in the physical domain Central to experimental psychology

3
Determine specifications for a haptics application based on the human capability of perception and action Design and construct an appropriate haptic interface Develop adequate software library including haptic rendering algorithms

4
Sensory threshold” is a central idea Absolute threshold -Sensitivity -Smallest amount of stimulus energy required to produce a sensation Difference threshold -Resolving power -The smallest amount of stimulus energy change to produce a sensation or that can be reliably discriminated The smallest amount of stimulus energy change to produce a sensation or that can be reliably discriminated

5
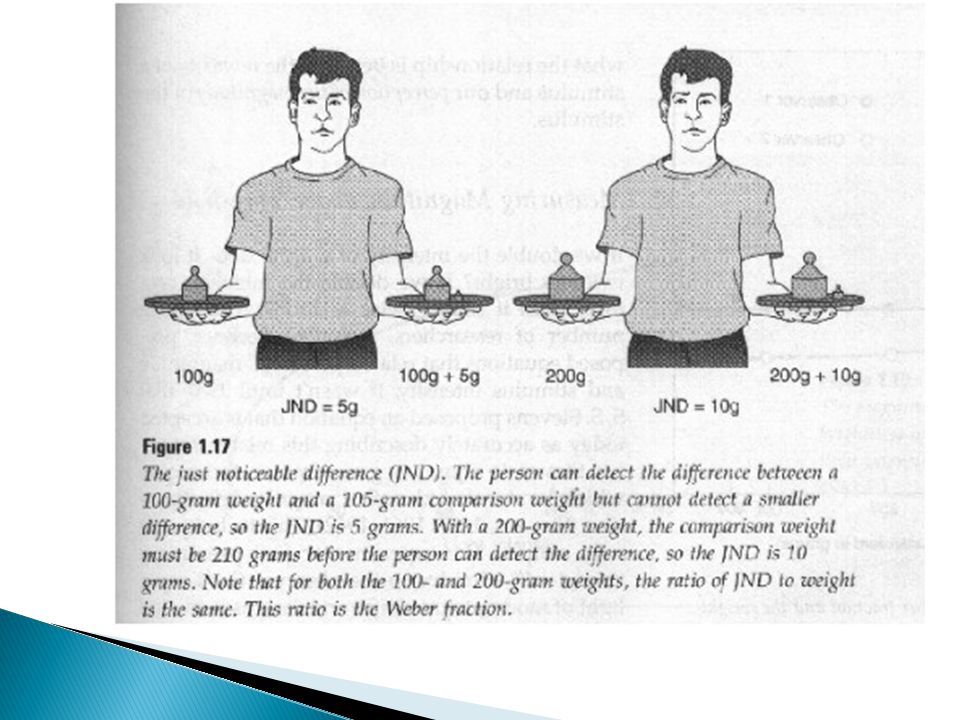
Difference threshold -Amount of chance in the stimulus required to produce a just noticeable difference (JND) in the sensation
 in the sensation")
7
The amount of change in a stimulus that creates a perceptible increment in sensation Example -Stimulus intensity = 10 units -Goes up to 12 units before observer notices a change -Therefore, JND = 2 units at that stimulus level

8
A function from stimulus intensity to probability to perceive the stimulus Usually a S-shaped ogive (cumulative normal distribution)
 ")
9
Presenting one stimulus at a time The stimulus is very weak Possible responses: “Yes, I see it.” / “No, I don’t see it.” Absolute thresholdDifference threshold Method of constant stimuli Method of limits Method of adjustment not used Presenting two stimuli at a time: –Standard: fixed, easily detectable –Comparison: either more or less intense than the standard Possible responses: “Comparison is stronger.” / “Comparison is weaker.”

10
Absolute threshold location Repeat same 5-9 stimuli Randomly present ~100x Ask feel it? yes/no Proportion of “yes’s” computed for each stimulus level Fit curve to get psychometric function (usually s-shaped) Threshold = 0.5
 Threshold = 0.5.")
11
1. Select a range of light intensities from certainly invisible to certainly visible 2. Pick a few (4-7) points uniformly in this intensity range; this will be the constant stimulus set WeakStrong Light intensity
 points uniformly in this intensity range; this will be the constant stimulus set WeakStrong Light intensity.")
12
3. Test each stimulus many times (20-25) in random order …
 in random order …")
13
4. Present the stimuli one at a time and ask the observer if it was visible or not Visible? YESNO

14
5. Calculate the proportion of “yes” and “no” responses at each light level +-+++---+++----++-+++---+++----+ 0%5%20%50%80%95%100%

15
6. Plot the percentages against stimulus intensity psychometric function Stimulus intensity Percentage “seen” 0% 100% 50% 75% 25%

16
Ideal FIG (Sekuler) Fixed absolute threshold Step function Actual FIG (Sekuler) Absolute threshold varies somewhat from trial to trial (due to constant fluctuations in sensitivity) Conventionally, the intensity corresponding to 50% is considered to be the threshold sigmoid function
 Fixed absolute threshold Step function Actual FIG (Sekuler) Absolute threshold varies somewhat from trial to trial (due to constant fluctuations in sensitivity) Conventionally, the intensity corresponding to 50% is considered to be the threshold sigmoid function")
17
1. Standard stimulus has a fixed intensity 2. The intensities of comparison stimuli bracket the standard Light intensity Standard stimulus: Comparison stimuli:

18
3. All pairs of standard and comparison stimuli are tested many times

19
4. For each pair, the observer judges if the comparison stimulus was stronger or weaker than the standard http://www.yorku.ca/psycho STRONGERWEAKER

20
5. For each comparison level, the percentage of “stronger” responses is calculated and results are plotted as a psychometric function Light intensity of comparison stimuli Percentage “stronger” 0% 100% 50% 75% 25%

21
When the observer cannot see a difference, he/she chooses randomly between “stronger” and “weaker”; this corresponds to 50% on the psychometric function point of subjective equivalence (PSE) Light intensity of comparison stimuli Percentage “stronger” 0% 100% 50% 75% 25% PSE
 Light intensity of comparison stimuli Percentage stronger 0% 100% 50% 75% 25% PSE")
22
By convention, the intensity at 75% is considered to be just noticeably stronger than the standard DS A comparison intensity at 25% is just noticeably weaker than the standard DW Difference threshold = the average of DS and DW Light intensity of comparison stimuli Percentage “stronger” 0% 100% 50% 75% 25% DW DS

23
1. On each trial, the observer reports if she/he could see the light or not. 2. Start with presenting a light intensity well above the expected threshold (the observer can certainly see it) 3. Decrease the intensity until the observer cannot see it 4. Threshold estimate: the intensity at which the response changes + - + + + + + - - - - Light intensity Trials Descending series: start from above the expected threshold and decrease intensity Ascending series: start from below the expected threshold and increase intensity threshold estimate
 3. Decrease the intensity until the observer cannot see it 4. Threshold estimate: the intensity at which the response changes Light intensity Trials Descending series: start from above the expected threshold and decrease intensity Ascending series: start from below the expected threshold and increase intensity threshold estimate.")
24
Ascending and descending series may yield different results use both Even in the same direction, there is variability in the threshold (inner noise, etc) average many measurements Measured threshold corresponds to 50% point in a psychometric function (method of constant stimuli) + - + + + + + - - - - - + + + + + - - - - Light intensity Trials pure-tone audiometry
 average many measurements Measured threshold corresponds to 50% point in a psychometric function (method of constant stimuli) Light intensity Trials pure-tone audiometry")
25
Linear relationship between differential threshold and stimulus intensity For example: to feel different, 2 heavy weights must differ more than two light weights

31
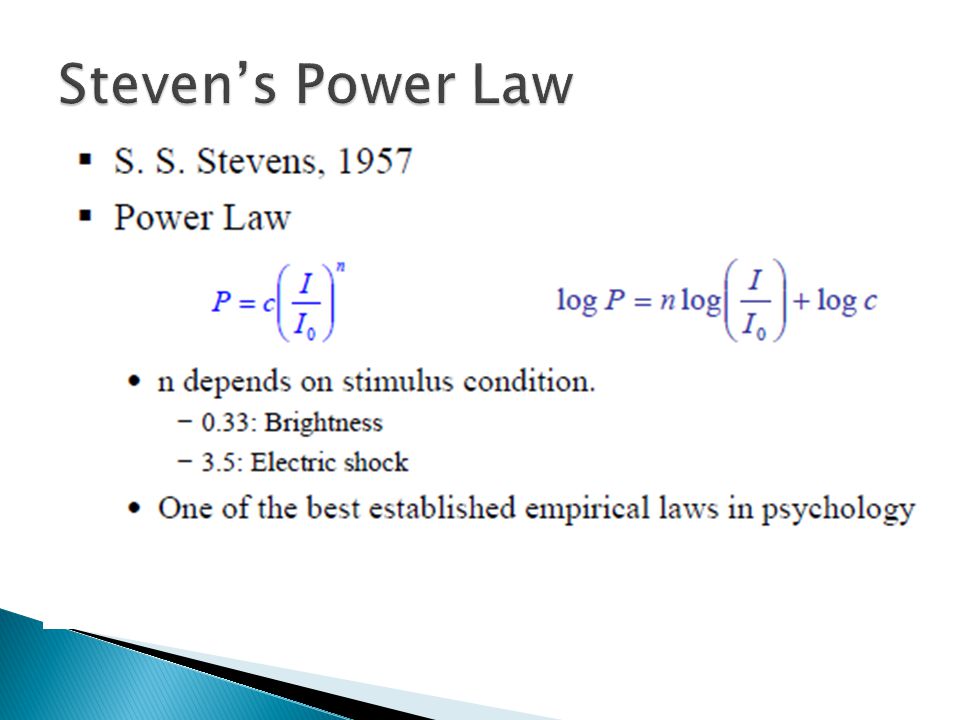
ContinuumExponent (a)Stimulus condition Loudness 0.67 Sound pressure of 3000 Hz tone Vibration 0.95 Amplitude of 60 Hz on finger Brightness 0.33 5° target in dark Lightness 1.2 Reflectance of gray papers Visual length 1 Projected line Visual area 0.7 Projected square Taste 1.4 Salt Smell 0.6 Heptane Cold 1 Metal contact on arm Tactual roughness 1.5 Rubbing emery cloths Tactual hardness 0.8 Squeezing rubber Heaviness 1.45 Lifted weights Viscosity 0.42 Stirring silicone fluids Electric shock 3.5 Current through fingers Vocal effort 1.1 Vocal sound pressure Duration 1.1 White noise stimuli
Stimulus condition Loudness 0.67 Sound pressure of 3000 Hz tone Vibration 0.95 Amplitude of 60 Hz on finger Brightness ° target in dark Lightness 1.2 Reflectance of gray papers Visual length 1 Projected line Visual area 0.7 Projected square Taste 1.4 Salt Smell 0.6 Heptane Cold 1 Metal contact on arm Tactual roughness 1.5 Rubbing emery cloths Tactual hardness 0.8 Squeezing rubber Heaviness 1.45 Lifted weights Viscosity 0.42 Stirring silicone fluids Electric shock 3.5 Current through fingers Vocal effort 1.1 Vocal sound pressure Duration 1.1 White noise stimuli")
Similar presentations


: Thresholds and Sensory Adaptation Mr. McCormick A.P. Psychology.>")


>")


 to the ear. Sound has two main attributes:>")


