Download presentation
Presentation is loading. Please wait.

1
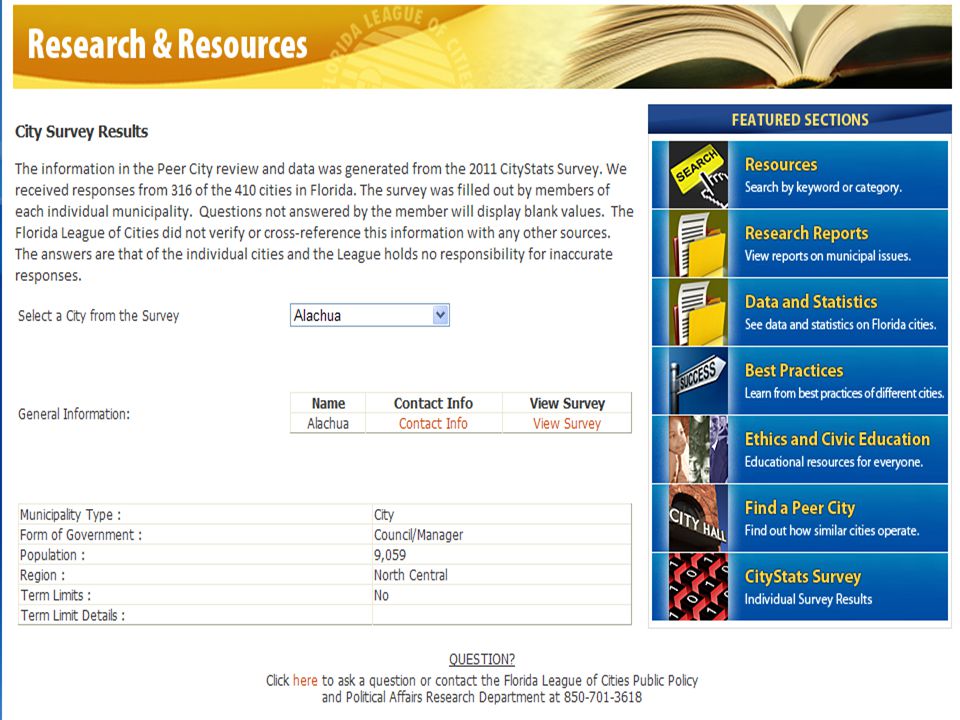
Where Does Your City Stack Up? 2011 CityStats Results FLC Research & Resource Library *This information was generated from the 2011 CityStats Survey. The League received responses from 317 of the 410 cities in Florida. The survey was filled out by members of each individual municipality. The Florida League of Cities did not verify or cross-reference this information with any other sources. The answers are that of the individual cities and the League holds no responsibility for inaccurate responses.

2
2011 CityStats Survey 48 question survey sent to all municipalities in Florida Questions on budgets, policies, service, utilities, and pensions. Completed by 316/410 cities Individual city profiles Find a peer city Results at a glance

3
Results Lobbyist Registration: 85% of cities do not require lobbyists to register with their municipality. A few cities that do have lobbyist registration policies are North Miami Beach, Oakland Park, and Jacksonville. Printed Legal Notices: In fiscal year 2009-2010, 281 cities in Florida spent a total of $6,240,250 on printed notices required by State Constitution. Reserve Funds: The majority of cities reported no policy for budgeting for reserves. The average reserve fund in fiscal year 2010-2011 was 21.5% of the general budget.

4
Services: In fiscal year 2009-2010 17% of Florida cities decreased city services. Employment Cuts: 276 cities in Florida reported eliminating a total of 1,951 full time positions and 397 part time positions for a total decrease of 2,300 city jobs. Septic Tanks: On average 26.4% of residents per city still use septic tanks. 33 cities reported to be 100% reliant on septic tanks as their form of waste water disposal. Economic Development Incentives: 50% of cities do not offer any economic development incentives. 38% offer expedited permitting.

5
Fire and Police Pension Plans as a percent of payroll: Average city contribution for police: 19.14% 19 cities reported contributions over 35% for police. 5 cities reported contributions over 50% for police. Average city contribution for fire: 17.08% 19 cities reported contributions over 35% for fire. 7 cities reported contributions over 50% for fire. Land Development: For many cities in Florida the majority of their developable land is currently already developed. The 2011 CityStats Survey found that the average city in Florida is currently 76.77 % developed. 80 % of cities in Florida are over 60 % developed. 48 % of cities in Florida are over 90 % developed.

6
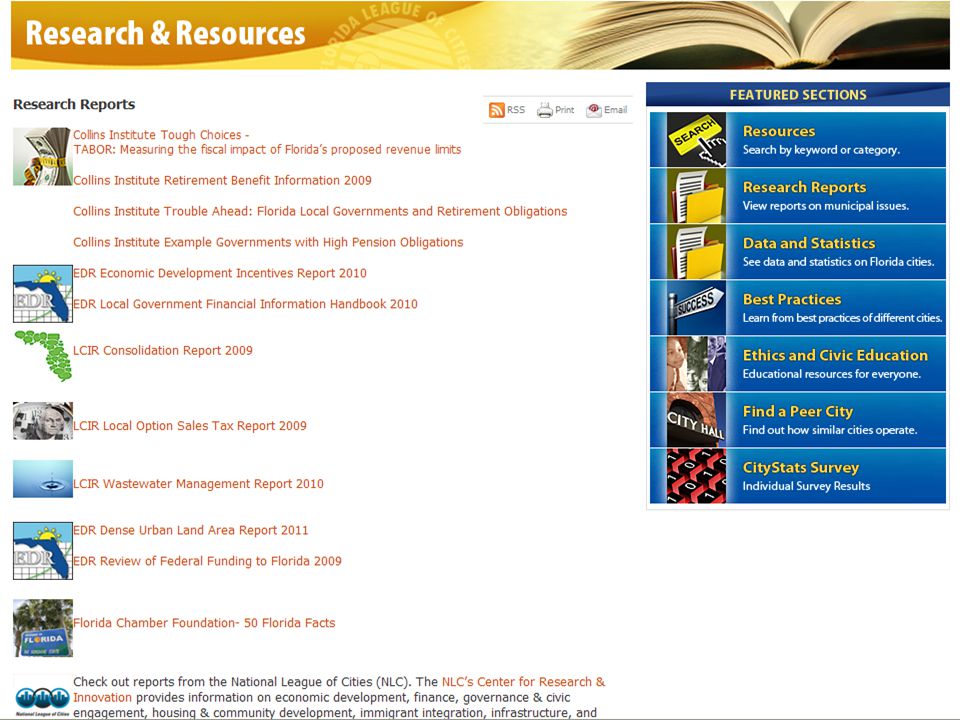
Research and Resources Library http://www.floridaleagueofcities.com/

20
LeRoy Collins Institute Revenue and Expenditure Mapping Project

21
Thank you! Remember to visit the Research and Resources Library at: www.floridaleagueofcities.com

Similar presentations


: Research from the LeRoy Collins Institute Carol S. Weissert Director of Institute Professor of Political Science.>")


 warned that gambling is growing so fast that it may.>")


, plus ($1,094,808) in State pass throughs. State Aid allocation.>")


