Download presentation
Presentation is loading. Please wait.

1
ZOUEU T. Jeremie and LOUM Georges Laboratoire d’Instrumentation Image et Spectroscopie ( L2IS ) Institute National Polytechnique Félix Houphouet-Boigny Yamoussoukro Email address: jeremie.zoueu@inphb.edu.ci Cote d’Ivoire Séminaire au LISA, 10 Novembre 2009
 Institute National Polytechnique Félix Houphouet-Boigny Yamoussoukro address: Cote d’Ivoire Séminaire au LISA, 10 Novembre")
2
Institut National Polytechnique de Yamoussoukro Séminaire au LISA, 10 Novembre 2009

5
TWAS-UNESCO (Third Word Academy of Science), Trieste, Italy ISP (International Science Programme), Uppsala, Sweden Atomic Physics Division, Lund University, Sweden Séminaire au LISA, 10 Novembre 2009
, Trieste, Italy ISP (International Science Programme), Uppsala, Sweden Atomic Physics Division, Lund University, Sweden Séminaire au LISA, 10 Novembre 2009")
6
M. Brydegaard, A. Merdosa, S. Svangberg (Atomic Physics Division, Lund University) Menan Hervé (Laboratory of Parasitology) Séminaire au LISA, 10 Novembre 2009
 Menan Hervé (Laboratory of Parasitology) Séminaire au LISA, 10 Novembre")
7
Images and Spectroscopy System Overview Malaria Parasites Diagnosis Approach Principal Component Analysis K-means clustering method Conclusion Séminaire au LISA, 10 Novembre 2009

8
Using images data for spectroscopy and diagnosis Selecting specific point or object in images for study Collecting quantitative spectra from images data Identification (or detection) of patterns Grouping points by spectral fingerprint similarities Etc. Séminaire au LISA, 10 Novembre 2009

9
Spatial dimension Spectral dimension

10
Spatial dimension: P mn is the pixel intensity for m row and n column Spectral dimension: P mn ( ) is the intensity of pixel of the coordinates m and n, for the wavelength Séminaire au LISA, 10 Novembre 2009
 is the intensity of pixel of the coordinates m and n, for the wavelength Séminaire au LISA, 10 Novembre 2009")
11
Spatial dimension Spectral dimension Ag21 Séminaire au LISA, 10 Novembre 2009

12
For each wavelength, we have: Séminaire au LISA, 10 Novembre 2009 Class 1 Class 3 Class 2 Clusterin g

13
Achieving spectroscopic images by transforming ordinary images into spectroscopic images data Case of absorbance images : P a =-Log(P t -P b )/(P ref -P b ) P a is an absorption image P t is transmitted image P b is baseline image P ref is reference image Idem for reflection and scattering Séminaire au LISA, 10 Novembre 2009
/(P ref -P b ) P a is an absorption image P t is transmitted image P b is baseline image P ref is reference image Idem for reflection and scattering Séminaire au LISA, 10 Novembre 2009")
16
Light Source Sample Spectrally sensitive detector Séminaire au LISA, 10 Novembre 2009

21
Malaria is cause by a intracellular protozoa parasite called plasmodium When the parasites proliferate into the erythrocytes, the infected RBCs bind to vascular endothelium (cytoadherence) and to the non- infected RBCs (rosetting). This block the blood flow and leads to high fever, unconsciousness, coma and … Séminaire au LISA, 10 Novembre 2009

23
There are four types of plasmodium: Plasmodium falciparum Plasmodium ovale Plasmodium vivax and plasmodium malaria Séminaire au LISA, 10 Novembre 2009

24
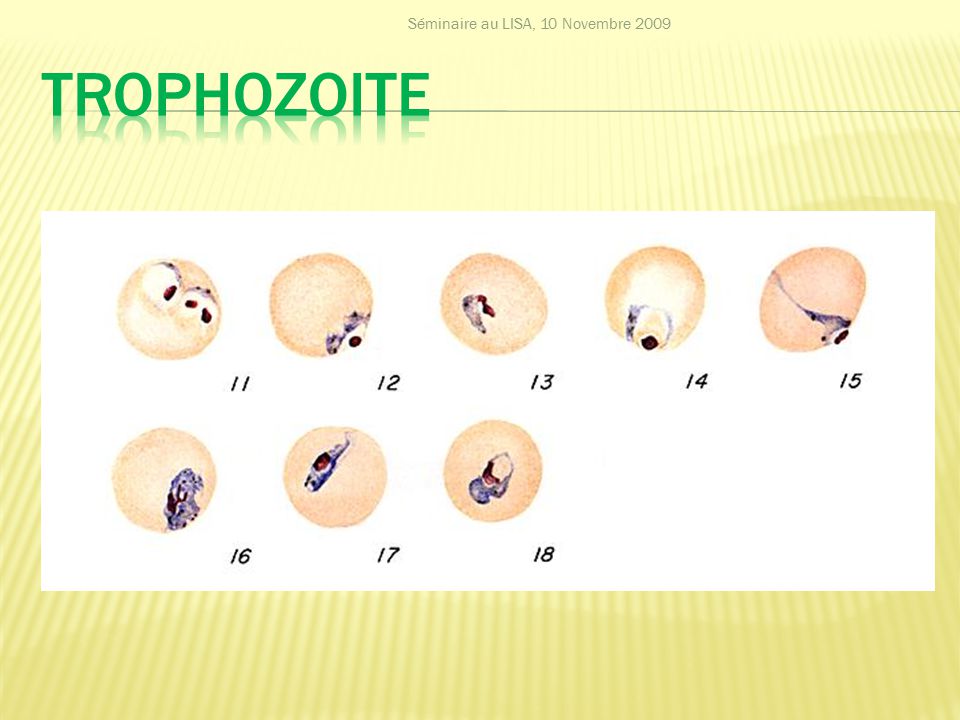
The dangerous and more common (98%) one in Ivory Coast and many African countries is plasmodium falciparum. The plasmodium falciparum can show about four shapes: Plasmodium falciparum ring Plasmodium falciparum trophozoite Plasmodium falciparum gametocyte Plasmodium falciparum shizont Séminaire au LISA, 10 Novembre 2009

29
Diagnosis: - Cheap equipment - Gain of time and no need of expertise by using not marked RBCs - Make the thin and thick blood smear more sensitive - Automatization of the parasites density and parasite type measurements Drug-target interaction: - Drug target determination - Parasite survival strategy determination Séminaire au LISA, 10 Novembre 2009

41
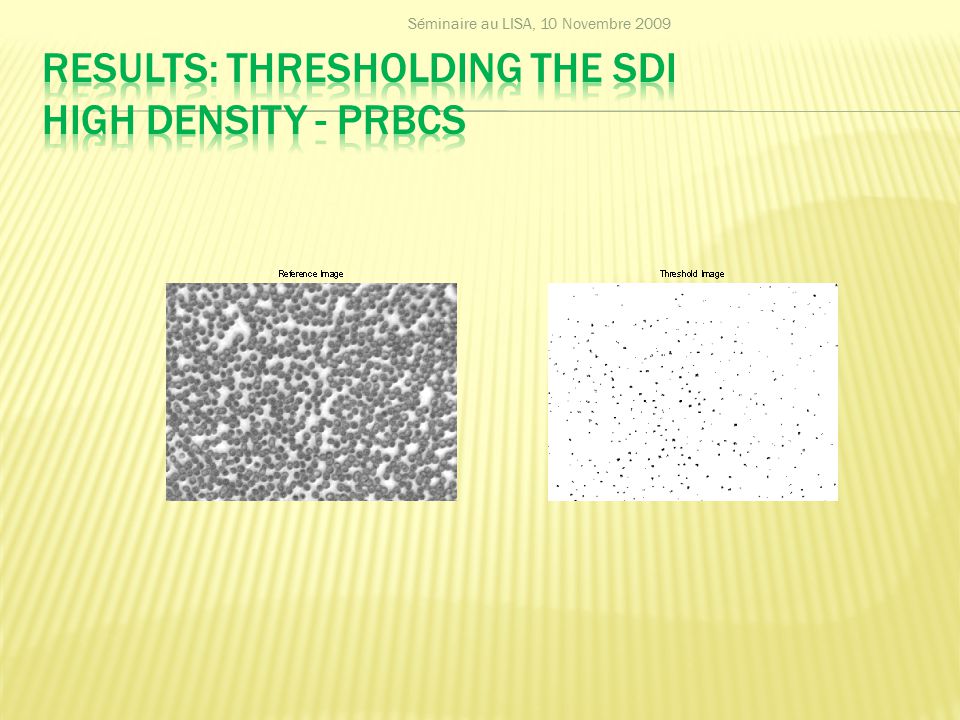
We choose a voxel V0 of interest We divide all the voxels of the image by V0 We calculate the standard deviation of each voxels We build an image of the standard deviation values We applied a threshold to the standard deviation image (SDI) Séminaire au LISA, 10 Novembre 2009
 Séminaire au LISA, 10 Novembre 2009")
45
We consider our type data Séminaire au LISA, 10 Novembre 2009

46
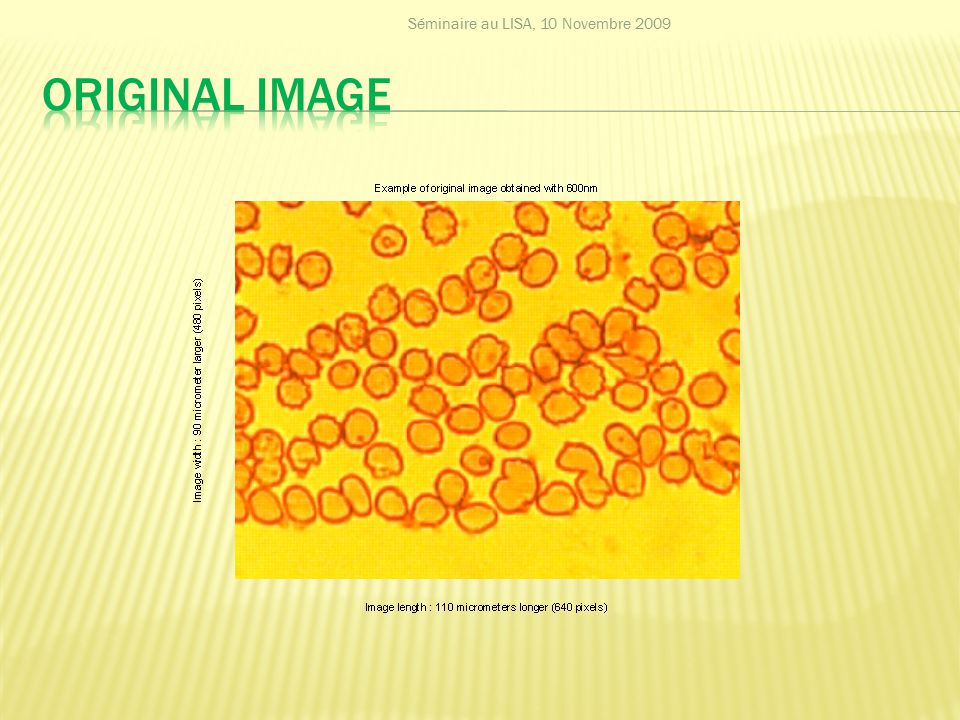
9 images taken from 360nm to 1100nm range Pre-processed images Quantitative absorption extracted PCA applied to the images to reduce the dimension K-means to cluster the pixels of the images Séminaire au LISA, 10 Novembre 2009

53
Multispectral Imaging can be used as diagnosis and spectroscopy tool PCA can be used as correlation tool to add information from each spectral channel for malaria diagnosis and study K-means can be used to cluster the molecular functions in the image Quantitative spectra can be used to determine contrast function Séminaire au LISA, 10 Novembre 2009

Similar presentations


, G.Witt(2), J.Gumbel(3), M.Khaplanov(3), R.Werner(1), J.Hedin(3),>")


