Download presentation
Presentation is loading. Please wait.

1
THE MARKET FOR RETIREMENT PRODUCTS IN CHILE: A REVIEW (*) Guillermo Martínez Barros Augusto Iglesias Palau * PrimAmérica Consultores – October 2003
 Guillermo Martínez Barros Augusto Iglesias Palau * PrimAmérica Consultores – October 2003")
2
Source: PrimAmérica Consultores

3
Source: SAFP-SVS

5
Return of Pension Funds = 7% PW Initial Pension / Deferred Annuity Pension = 1 /1

6
(1) Excluding the first pension payment. Source: SAFP
 Excluding the first pension payment. Source: SAFP")
7
(1) Excluding the first pension payment. Source: SAFP
 Excluding the first pension payment. Source: SAFP")
8
(1) Excluding the first pension payment. (2) Does not include transitory disability pensions. (3) Correspond to pensions to mothers of offspring from a non-marital relationship, and the parents of the member. Source: SAFP
 Correspond to pensions to mothers of offspring from a non-marital relationship, and the parents of the member. Source: SAFP.")
9
Life Insurance Companies

10
Source: SVS

11
Number of Insurance Companies in the Annuities Market Source: S.V.S. Annuities Statistics

12
(*) Measured on the basis of Premium Source: PrimAmérica Consultores
 Measured on the basis of Premium Source: PrimAmérica Consultores")
13
Annuities Market Concentration (%) % of Market Source : S.V.S. Annuities Statistics
 % of Market Source : S.V.S. Annuities Statistics")
14
Annuities Market Concentration (%) Source : S.V.S. Annuities Statistics
 Source : S.V.S. Annuities Statistics")
15
Source: PrimAmérica Consultores

16
Source: SVS

17
Profits of Insurance Companies

18
ROE & ROA of LICOs

19
Evolution of the Chilean Annuities Market

20
The Evolution of Annuity Sales Source: S.V.S. Annuities Statistics US$ 000s

21
Annuities Sales Growth Rates (%) Source: S.V.S. Annuities Statistics %
 Source: S.V.S. Annuities Statistics %")
22
Number of Annuity Policies and Average Premium Source: S.V.S. Annuities Statistics

23
New Annuities Average Pension Source: S.V.S. Annuities Statistics.

24
Capital per Unit of Pension The capital per unit of pension is a measure of the lump-sum savings needed to finance a lifetime pension of one unit per month. The most important inputs in determining the capital required to purchase a unit of pension are: –the interest rate, –the life expectancy of the person or group of people that will receive the pensions, and –the expenses the company expects to incur in meeting the obligations under the policy. The average ratio of capital per unit of pension has fluctuated between 150 and 175, averaging around 160 over the last twelve years.

25
Capital per Unit of Pension Source: S.V.S. Annuities Statistics.

26
Underwriting Losses The minimum technical reserve calculation rules issued by the Insurance Superintendency’ effectively mean that every new policy sold gives rise to an underwriting loss of around 117% of premium. As such, for every US$100 received as single premium from the client, the insurance company is obliged to set up a technical reserve of US$117; the imbalance between assets received (premium) and liabilities assumed (pensions to pay) is covered by a reduction in accounting equity, with this this differential being shown as a technical loss in the income statement.
 and liabilities assumed (pensions to pay) is covered by a reduction in accounting equity, with this this differential being shown as a technical loss in the income statement..")
27
Underwriting Losses as % of Premium Source: F.E.C.U. (% of Premium)
")
28
TYPES OF ANNUITY PRODUCTS

29
Types of Annuity Products There are four types of annuity product: i) Old Age Pensions ii) Early Retirement Pension iii) Disability Pensions (total and partial) iv) Survivorship Pensions Of these four types of annuities, the largest share corresponds to early retirement, which in 2001 accounted for 74% of all annuity sales (US$962 million), followed by old age pensions with 15% (US$192 million).
 Old Age Pensions ii) Early Retirement Pension iii) Disability Pensions (total and partial) iv) Survivorship Pensions Of these four types of annuities, the largest share corresponds to early retirement, which in 2001 accounted for 74% of all annuity sales (US$962 million), followed by old age pensions with 15% (US$192 million).")
30
Annuity Sales by Type of Product US$ Millions Source: S.V.S. Annuities Statistics

31
Annuity Sales by Type of Product (US$ Millions) Source: S.V.S. Annuities Statistics.
 Source: S.V.S. Annuities Statistics.")
32
Composition of Annuity Sales by Type of Product (%) % Source: S.V.S. Annuities Statistics
 % Source: S.V.S. Annuities Statistics")
33
Composition of Annuity Sales by Type of Product (%) Source: S.V.S. Annuities Statistics.
 Source: S.V.S. Annuities Statistics.")
34
US$ New Annuities Average Pension by Type of Product Type of Product (US$/month) Source S.V.S. Annuities Statistics

35
New Annuities Average Pension by Type of Product Type of Product (US$/month)
")
36
MUS$ Annuities Average Premium by Type of Product Type of Product (MUS$/policy) Source S.V.S. Annuities Statistics

37
Annuities Average Premium by Type of Product Type of Product (US$/policy)
")
38
Capital per Unit of Pension by Type of Product Source S.V.S. Annuities Statistics

39
Capital per Unit of Pension by Type of Product TOTAL Early Retirement Year Old Age 1991 1992 1993 1994 1995 152.71 146.86 147.70 151.25 150.96 173.76 171.11 169.87 176.82 177.88 163.44 155.40 154.17 164.49 162.83 Survivorship 131.02 133.03 126.14 126.08 125.20 166.08 165.75 162.40 169.77 171.22 Disability 1996145.62171.73159.76120.11160.55 1997147.58173.24162.29122.32162.52 1998137.15157.90151.75134.12149.50 1999149.71170.6161.75119.35159.91 2000147.06168.82165.70120.38146.63 2001150.59172.52156.61119.90165.26

40
ANNUITIES DISTRIBUTION AND COMMISSIONS

41
Annuities Sales by Distribution Channel in 2002 Source S.V.S.Annuities Statistics.

42
Annuities Direct Intermediation Cost (% of Immediate Lump-sum Premium) Source : S.V.S. Annuities Statistics (% Gross Written Premium)
.")
43
ANNUITIES INTEREST RATES

44
% The Evolution of Annuity Rates The Evolution of Annuity Rates (%) Source: S.V.S. Annuities Statistics.

45
% The Evolution Annuity Rates by Type of Product Type of Product (%) Source: S.V.S. Annuities Statistics.

46
Source: S.V.S. Annuities Statistics The Evolution of Annuity Rates by Type of Product (%)
")
47
Annuity Rates, Commissions and Premium At the market level, there seems to be a clear trade-off between the technical interest rate and commissions: companies that pay higher interest rates tend to pay lower commissions to brokers and agents, and viceversa. On the other hand, there also seems to be a positive correlation between level of premium and the interest rate paid on annuities.

48
Annuity Rates v/s Commission (December 2001) Source: S.V.S. Annuities Statistics BICE OHIO AGF ALLIANZ CHILENA CIGNA CONSORCIO CONSTRUCCION CN LIFE VIDA CORP ING CRUZ DEL SUR EUROAMERICA INTERRENTA ISE PRINCIPAL RTANAC METLIFE VITALIS PROMEDIO 5,0%5,1%5,2%5,3%5,4%5,5%5,6%5,7% Interest Rate (%) 2,00% 2,50% 3,00% 3,50% 4,00% Commission (%)
 2,00% 2,50% 3,00% 3,50% 4,00% Commission (%).")
49
Annuity Rates v/s Premium (December 2001) Source: S.V.S. Annuities Statistics (Dic 2002). BICE OHIO AGF ALLIANZ CHILENA CIGNA CONSORCIO CONSTRUCCION CN LIFE VIDA CORP ING CRUZ DEL SUR EUROAMERICA INTERRENTA ISE PRINCIPAL RTANAC METLIFE VITALIS PROMEDIO 5,0%5,1%5,2%5,3%5,4%5,5%5,6%5,7% Interest Rate (%) 20 30 40 50 60 70 80 Premium (MUS$)
. BICE OHIO AGF ALLIANZ CHILENA CIGNA CONSORCIO CONSTRUCCION CN LIFE VIDA CORP ING CRUZ DEL SUR EUROAMERICA INTERRENTA ISE PRINCIPAL RTANAC METLIFE VITALIS PROMEDIO 5,0%5,1%5,2%5,3%5,4%5,5%5,6%5,7% Interest Rate (%) Premium (MUS$).")
50
ANNUITIES ADMINISTRATION COST

51
Annuities Administration Cost (%) (% Technical Reserves) % Source: S.V.S. Insurance Yearbook
 (% Technical Reserves) % Source: S.V.S. Insurance Yearbook")
52
Annuities Administration Cost (%) Source : S.V.S. Insurance Yearbook
 Source : S.V.S. Insurance Yearbook")
53
ANNUITY SPREADS

54
Annuities Theoretical Net Spread Evolution (%) % (*) Includes 5 largest companies.
 % (*) Includes 5 largest companies.")
55
Annuities Theoretical Net Spread Evolution (%) (*) The commission as percentage of on premium has been translated to interest rate by dividing it by 11, the estimated duration of an average annuity. (**)Includes largest Companies. (***) Average PRC-20.
Includes largest Companies. (***) Average PRC-20..")
56
Annuities Actual Net Spread Evolution (%) % (*) Includes 5 largest companies.
 % (*) Includes 5 largest companies.")
57
Annuities Actual Net Spread Evolution (%) (*) The commission as percentage of on premium has been translated to interest rate by dividing it by 11, the estimated duration of an average annuity. (**) Includes 5 largest companies.
 Includes 5 largest companies..")
58
INVESTMENTS AND OTHER INFORMATION ABOUT LIFE INSURANCE COMPANIES

59
The Evolution Investments in the Life Insurance Market Source: S.V.S. Insurance Yearbook US$ millions

60
Shareholders’ Equity in the Life Insurance Market Source: S.V.S. Insurance Yearbook US$ millions

61
Technical Reserves US$ millions Source: S.V.S. Insurance Yearbook

62
Ratio of Liabilities to Equity in the Life Insurance Market Source: S.V.S. Insurance Yearbook. N° Times Equity

63
Total Sales in Life Insurance Market Source: S.V.S. Fecus US$ millions

64
Composition of Sales (December 2002) Source: S.V.S. Fecus
 Source: S.V.S. Fecus")
65
Evolution of Profits in the Life Insurance Market Source: S.V.S. Fecus US$ millions

66
Evolution of Stock Market (IPSA) (% Change in Year) % Source:Bolsa de Comercio.
 (% Change in Year) % Source:Bolsa de Comercio.")
67
IPSA Evolution (%) Source: Bolsa de Comercio
 Source: Bolsa de Comercio")
68
Identifying the Risks in the Market for Retirement Products A.Risks for the Retirees –Longevity risk

69
Identifying the Risks in the Market for Retirement Products A.Risks for the Retirees –Longevity risk

70
Identifying the Risks in the Market for Retirement Products A.Risks for the Retirees –Longevity risk

71
Identifying the Risks in the Market for Retirement Products A.Risks for the Retirees –Return on Investment

72
Identifying the Risks in the Market for Retirement Products A.Risks for the Retirees –Purchasing Power Risk

73
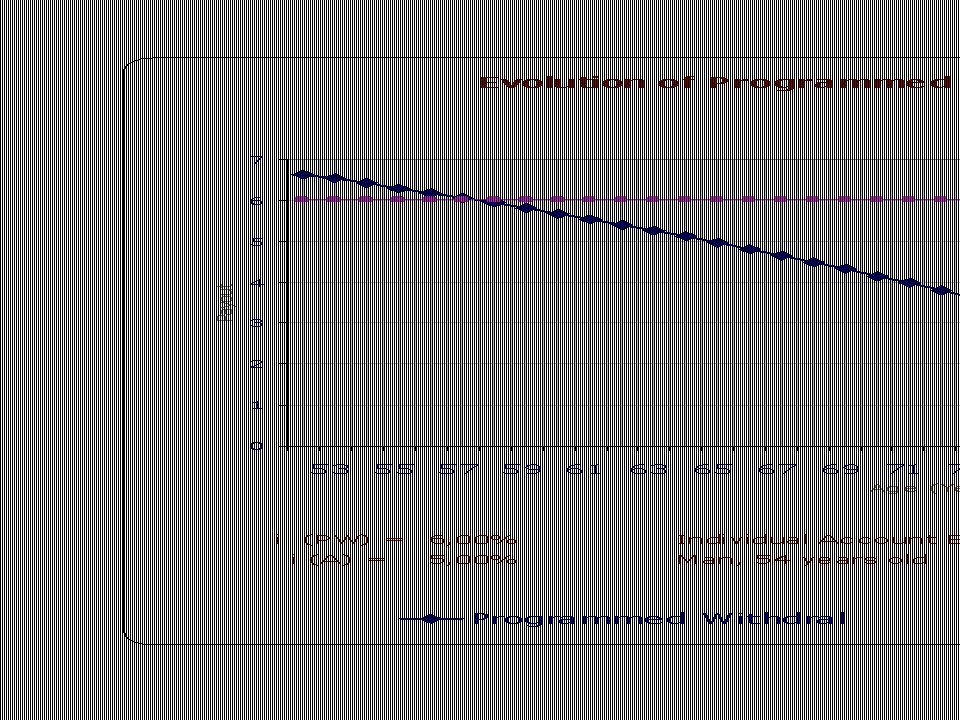
Identifying the Risks in the Market for Retirement Products A.Risks for the Retirees –Bequests and Beneficiaries benefits Proyección de los retiros programados y herencias

74
Identifying the Risks in the Market for Retirement Products A.Risks for the Retirees –Bequests and Beneficiaries benefits

75
Identifying the Risks in the Market for Retirement Products B.Risks for the Providers (especially for insurers) –Longevity Source: INE CELADE. Mortality Tables, 1950 – 2050 (Interpolation)
.")
76
Identifying the Risks in the Market for Retirement Products B.Risks for the Providers (especially for insurers) –Longevity Mortality FactorCapital Required (1)Ratio 50%187.47113.11 75%175.61105.96 100%165.73100 125%158.5195.64 (1) This is an actuarial calculation which depends on the life expectancy of the family group and the discount rate applied in the exercise. An Interest of 5% was used in these computations for a single man age 54 with the RV85 Mortality Table.

77
Identifying the Risks in the Market for Retirement Products B.Risks for the Providers (especially for insurers) –Rate of return on investments
 –Rate of return on investments")
78
Identifying the Risks in the Market for Retirement Products B.Risks for the Providers (especially for insurers) –Asset / Liability management
 –Asset / Liability management")
79
Identifying the Risks in the Market for Retirement Products B.Risks for the Providers (especially for insurers) Market Risk (%)
 Market Risk (%)")
80
Identifying the Risks in the Market for Retirement Products B.Risks for the Providers (especially for insurers) –Concentration Risk
 –Concentration Risk")
81
Identifying the Risks in the Market for Retirement Products B.Risks for the Providers (especially for insurers) –Administrative Efficiency
 –Administrative Efficiency")
82
Identifying the Risks in the Market for Retirement Products C.Risks for the Government –Minimum Pension Guarantee

83
Identifying the Risks in the Market for Retirement Products C.Risks for the Government –Special annuity guarantee

84
Identifying the Risks in the Market for Retirement Products C.Risks for the Government –Special annuity guarantee

85
Identifying the Risks in the Market for Retirement Products C.Risks for the Government –Special annuity guarantee

86
Identifying the Risks in the Market for Retirement Products C.Risks for the Government –Special annuity guarantee

87
Coping with the Risks: Internal Risk Management by Providers A.The availability of Financial Instruments for risk management 1.Current Diversification of Investment Portfolio (LICO and AFP)
")
88
Coping with the Risks: Internal Risk Management by Providers B.Risk Management capacity and strategies adopted by the providers 1. Term (duration) mismatch in LICOs.
 mismatch in LICOs..")
89
Coping with Risks: Qualitative and Quantitative Regulations on Insurance B.Solvency and Quantitative Regulation Liabilities (actuarial and financial)
")
Similar presentations