Download presentation
Presentation is loading. Please wait.

1
P LAN S AFE P LAN S AFE NCHRP 8-44(02): T RANSPORTATION S AFETY P LANNING : F ORECASTING THE S AFETY I MPACTS IN S OCIO - D EMOGRAPHIC C HANGES AND S AFETY C OUNTERMEASURES Ida van Schalkwyk Oregon State University idavan@engr.oregonstate.edu In cooperation with Dr. Simon Washington @ UC Berkeley Daehyun You @ ASU September 11 th, 2009 Oregon Transportation Summit in Portland, OR

2
O VERVIEW The need NCHRP 8-44 Overview of NCHRP 8-44(2) Value When and how it can be used What is PLANSAFE Overview PLANSAFE Analysis PLANSAFE GIS PLANSAFE Census The PLANSAFE Software September 11 th, 2009 Oregon Transportation Summit in Portland, OR
 Value When and how it can be used What is PLANSAFE Overview PLANSAFE Analysis PLANSAFE GIS PLANSAFE Census The PLANSAFE Software September 11 th, 2009 Oregon Transportation Summit in Portland, OR")
3
O VERVIEW OF NCHRP 8-44(2) Need & Project Objectives
 Need & Project Objectives")
4
T HE N EED How do we incorporate safety into the long range transportation planning process? Decision- Making Process Safety September 11 th, 2009 Oregon Transportation Summit in Portland, OR

5
NCHRP 8-44(02) O BJECTIVES Forecast Safety A robust, defensible, and accurate analytical set of algorithms to forecast the safety impacts of engineering and behavioral countermeasure investments at the planning-level Software Tool User-friendly software, compatible to the extent possible with planning-level data inputs, to incorporate the analytical procedures for forecasting safety Guidance materials to accompany the analytical procedures and software September 11 th, 2009 Oregon Transportation Summit in Portland, OR
 O BJECTIVES Forecast Safety A robust, defensible, and accurate analytical set of algorithms to forecast the safety impacts of engineering and behavioral countermeasure investments at the planning-level Software Tool User-friendly software, compatible to the extent possible with planning-level data inputs, to incorporate the analytical procedures for forecasting safety Guidance materials to accompany the analytical procedures and software September 11 th, 2009 Oregon Transportation Summit in Portland, OR")
6
W HAT IS P LANSAFE ? Background to the software tool

7
Changes at the area-level Effect on safety? E.g. increase population density Impact on fatal & disabling injury crash severity? Estimate effect of Socio-demographic changes Network related changes (volumes, large scale projects) Engineering & behavioral countermeasures @ planning level on crashes @ the planning level U SING P LAN S AFE September 11 th, 2009 Oregon Transportation Summit in Portland, OR
 Engineering & behavioral planning level on the planning level U SING P LAN S AFE September 11 th, 2009 Oregon Transportation Summit in Portland, OR.")
8
Measure/estimate area- wide effects on crashes Compare scenarios – Growth – Network changes – Future forecasts (demand models) – Area-wide countermeasure implementation U SING P LAN S AFE P LANNING LEVEL CRASH ESTIMATION September 11 th, 2009 Oregon Transportation Summit in Portland, OR
 – Area-wide countermeasure implementation U SING P LAN S AFE P LANNING LEVEL CRASH ESTIMATION September 11 th, 2009 Oregon Transportation Summit in Portland, OR")
9
T HE P LAN S AFE S OFTWARE P ACKAGE Tools within P LAN S AFE

10
T HE S OFTWARE P ACKAGE PLANSAFE GIS Tool PLANSAFE Census Tool INPUT DATA -GIS Shape Files (Polygon/Line/Point) - Census Data INPUT DATA -GIS Shape Files (Polygon/Line/Point) - Census Data PLANSAFE Main Tool FORECAST SAFETY with/without countermeasure or different development scenarios at the planning level FORECAST SAFETY with/without countermeasure or different development scenarios at the planning level Dataset preparation Analysis/ Prediction September 11 th, 2009 Oregon Transportation Summit in Portland, OR
 - Census Data INPUT DATA -GIS Shape Files (Polygon/Line/Point) - Census Data PLANSAFE Main Tool FORECAST SAFETY with/without countermeasure or different development scenarios at the planning level FORECAST SAFETY with/without countermeasure or different development scenarios at the planning level Dataset preparation Analysis/ Prediction September 11 th, 2009 Oregon Transportation Summit in Portland, OR")
11
P LAN S AFE M AIN A NALYSIS T OOL What can the P LAN S AFE main analysis tool do?

12
C OMPARE C RASH O UTCOMES FOR D IFFERENT G ROWTH S CENARIOS Future Transportation Supply/Demand PLANSAFE GIS Tool Future Census Information a) Either import future transportation demand model information OR b) Apply growth factor to target area to account for future growth September 11 th, 2009 Oregon Transportation Summit in Portland, OR
 Either import future transportation demand model information OR b) Apply growth factor to target area to account for future growth September 11 th, 2009 Oregon Transportation Summit in Portland, OR")
13
A ND /O R – E VALUATE I MPACT OF C OUNTERMEASURE @ F UTURE P OINT IN T IME P LAN S AFE includes Countermeasure Effect Resource Table – STEP 1: Prepare Data – STEP 2: Identify Target Area – STEP 3: Select the countermeasure From resource table (drop down menu); or Add your own – STEP 4: Results! @ P LANNING L EVEL September 11 th, 2009 Oregon Transportation Summit in Portland, OR

14
E XAMPLE OF INFORMATION IN P LAN S AFE C OUNTERMEASURE R ESOURCE T ABLE September 11 th, 2009 Oregon Transportation Summit in Portland, OR

15
P REDICTIVE C APABILITIES B UILT -I N SPF S KABCO crashes (All crashes) KA crashes (Fatal & Incapacitating Injury Crashes) KAB crashes (Fatal, Incapacitating & Non- Incapacitating Crashes) Bicycle crashes Pedestrian crashes Deer crashes (some regions experience high proportions of deer/animal crashes) P LAN S AFE assess the goodness-of-fit of the built-in and provided models Automatically select the best fitting model Calibrate automatically Provides results B UT : YOU CAN ADD YOUR OWN S AFETY P ERFORMANCE F UNCTIONS September 11 th, 2009 Oregon Transportation Summit in Portland, OR
 KA crashes (Fatal & Incapacitating Injury Crashes) KAB crashes (Fatal, Incapacitating & Non- Incapacitating Crashes) Bicycle crashes Pedestrian crashes Deer crashes (some regions experience high proportions of deer/animal crashes) P LAN S AFE assess the goodness-of-fit of the built-in and provided models Automatically select the best fitting model Calibrate automatically Provides results B UT : YOU CAN ADD YOUR OWN S AFETY P ERFORMANCE F UNCTIONS September 11 th, 2009 Oregon Transportation Summit in Portland, OR")
16
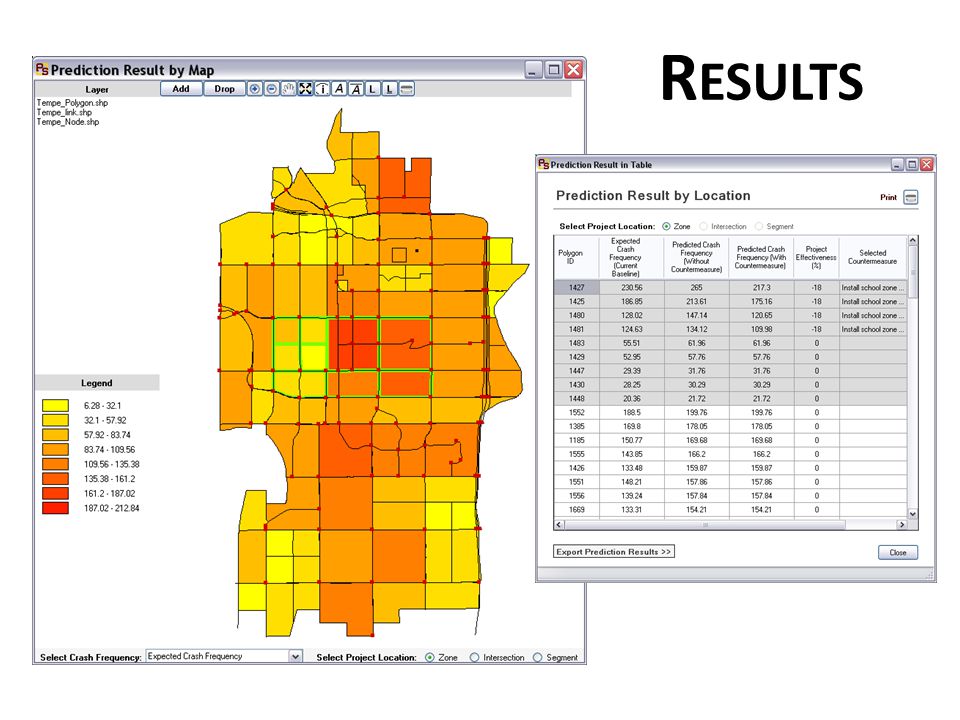
R ESULTS

18
S UPPLEMENTAL T OOLS Helping you get the data ready for the P LAN S AFE Analysis Tool INPUT DATA Roadway information (TDM, HPMS etc.) Crash data (GIS) Socio- demographics (census, local surveys) Other local data
 Crash data (GIS) Socio- demographics (census, local surveys) Other local data")
19
P LAN S AFE GIS T OOL P LAN S AFE Supplemental Tool

20
P LAN S AFE GIS T OOL ROAD NETWORK : functional class, AADT, length CRASH DATA : severity, special users, collision types (has to be geocoded!) SOCIO- DEMOGRAPHICS : population, children, working adults, population density Assigned in GIS to Study Areas (census block groups, TAZs, etc.)
 SOCIO- DEMOGRAPHICS : population, children, working adults, population density Assigned in GIS to Study Areas (census block groups, TAZs, etc.)")
21
Makes data preparation in ArcGIS super easy Point-in-Polygon Aggregation Tool Calculates the number of points in each polygon Total number of crashes/polygon Total number of intersections/polygon Line-in-Polygon Aggregation Tool Calculates the values of line features, which fall in each polygon Total AADT/polygon Total roadway length/polygon End-node Integration Tool Creates an intersection point file P LAN S AFE GIS T OOL TAZ boundaries are often major roadways Geospatial differences: roadways and boundaries don’t line up and if they do – where do they belong? Crashes occur on roadways that form boundaries – where do they belong? Agencies usually don’t have an intersection GIS layer

22
P LAN S AFE C ENSUS T OOL P LAN S AFE Supplemental Tool

23
P LAN S AFE C ENSUS T OOL Analysis by TAZs Tool imports BG data Provide polygon to polygon intersect output from ArcGIS to Tool Tool generates socio- demographic variables for predictive analysis in P LAN S AFE Main Tool Analysis by BGs Tool imports BG data Tool generates socio- demographic variables for predictive analysis in P LAN S AFE Main Tool Analysi s by tract or county Absolutely NOT recommended

24
W HEN W ILL P LAN S AFE BE A VAILABLE ? NCHRP 8-44(2) is wrapping up the project (product delivery will likely be within the next month) Project Report and Product Submittal to NCHRP panel Standard TRB process to release for public use
 is wrapping up the project (product delivery will likely be within the next month) Project Report and Product Submittal to NCHRP panel Standard TRB process to release for public use.")
25
K EY C ONTACTS TRB/ NCHRP – Rick Pain: rpain@nas.edu, (202)334-2964rpain@nas.edu – Chuck Niessner: cniessne@nas.edu, (202) 334- 1431cniessne@nas.edu NCHRP 8-44(2) – Principal Investigator: Simon Washington, simon.washington@berkeley.edu, 510 643-1770 simon.washington@berkeley.edu – Predictive Modeling & Software Tool: Ida van Schalkwyk, idavan@engr.oregonstate.eduidavan@engr.oregonstate.edu
 334- NCHRP 8-44(2) – Principal Investigator: Simon Washington, – Predictive Modeling & Software Tool: Ida van Schalkwyk,")
26
T HE E ND – O R J UST THE B EGINNING …

27
Q UESTIONS ?

Similar presentations


 Evans, Tom Rossi Cambridge Systematics, Inc. May 8, 2011.>")


: Traffic Analysis – Non-site traffic forecast Understand why estimating non-site traffic forecast is necessary Know three principal.>")

 Development of Synthetic Trip Tables Development of.>")

 T E L U M Interactive Software for Integrated Land Use and Transportation Modeling.>")
