Download presentation
Presentation is loading. Please wait.

1
Publication Bias Emily E. Tanner-Smith
Associate Editor, Methods Coordinating Group Research Assistant Professor, Vanderbilt University Campbell Collaboration Colloquium Copenhagen, Denmark May 29th, 2012

2
Outline What is publication bias Avoiding publication bias
Methods for detecting publication bias Detecting publication bias in Stata Summary & recommendations

3
Publication Bias Publication bias refers to bias that occurs when research found in the published literature is systematically unrepresentative of the population of studies (Rothstein et al., 2005) Publication bias is often referred to as the file drawer problem where: “…journals are filled with the 5% of studies that show Type I errors, while the file drawers back at the lab are filled with the 95% of the studies that show non-significant (e.g. p < 0.05) results” (Rosenthal, 1979)
 Publication bias is often referred to as the file drawer problem where: …journals are filled with the 5% of studies that show Type I errors, while the file drawers back at the lab are filled with the 95% of the studies that show non-significant (e.g. p < 0.05) results (Rosenthal, 1979)")
4
Reporting Biases Source: Sterne et al. (Eds.) (2008: 298)
Types of Reporting Biases Definition Publication bias The publication or non-publication of research findings, depending on the nature and direction of results Time lag bias The rapid or delayed publication of research findings, depending on the nature and direction of results Multiple publication bias The multiple or singular publication of research findings, depending on the nature and direction of results Location bias The publication of research findings in journals with different ease of access or levels of indexing in standard databases, depending on the nature and direction of results Citation bias The citation or non-citation publication of research findings, depending on the nature and direction of results Language bias The publication of research findings in a particular language, depending on the nature and direction of results Outcome reporting bias The selective reporting of some outcomes but not others, depending on the nature and direction of results Source: Sterne et al. (Eds.) (2008: 298)
 (2008: 298)")
5
Why Publication Bias Matters
Systematic reviews and meta-analyses are often used to inform policy and practice Omitting unpublished studies from a review could yield a biased estimate of an intervention effect Biased results could lead decision-makers to adopt practices that may ultimately cause harm, increase adverse events, or prevent treatment of life-threatening diseases or disorders

6
Avoiding Publication Bias
As Primary Researchers: Ethical imperative for primary researchers to publish null/negative findings Prospective registration of trials As Systematic Reviewers/Meta-analysts: Prospective meta-analysis of studies identified prior to reporting of study results Extensive grey literature searching Transparent assessment of possible bias

7
Avoiding Publication Bias: Grey Literature Searching
An ounce of prevention is worth a pound of cure… Conference proceedings Technical reports (research, governmental agencies) Organization websites Dissertations, theses Contact with primary researchers
 Organization websites. Dissertations, theses. Contact with primary researchers.")
8
Avoiding Publication Bias: Grey Literature Searching
Databases Australian Education Index Current Controlled Trials Index to Theses PAIS Archive Bib of Nordic Criminology Directory of OA Journals INASP PAIS International British Education Index Dissertation Abstracts ISI Conf Proceedings Index PolicyFile Canadian Eval Society DissOnline LILACS Latin American Project Cork CBCA Education DrugScope DrugData NTIS PsycArticles CERUK EconLit NCJRS Abstracts Database PsycEXTRA Child Welfare Info Gateway Educ Research Global NLM Gateway Social Care Online ClinicalTrials.gov ERIC NARCIS SSRN eLibrary CORDIS Library HINARI NBBF Theses Canada CRD HMIC NY Acad of Med TRID CrimDOC HUD User Database Open Grey WHO Trials

9
Detecting Publication Bias
Methods for detecting publication bias assume: Large n studies are likely to get published regardless of results due to time and money investments Small n studies with the largest effects are most likely to be reported, many will never be published or will be difficult to locate Medium n studies will have some modest significant effects that are reported, others may never be published

10
Funnel Plots Exploratory tool used to visually assess the possibility of publication bias in a meta-analysis Scatter plot of effect size (x-axis) against some measure of study size (y-axis) x-axis: use logged values of effect sizes for binary data, e.g., ln(OR), ln(RR) y-axis: the standard error of the effect size is generally recommended (see Sterne et al., 2005 for a review of additional y-axis options) Not recommended in very small meta-analyses (e.g., n < 10)
 against some measure of study size (y-axis) x-axis: use logged values of effect sizes for binary data, e.g., ln(OR), ln(RR) y-axis: the standard error of the effect size is generally recommended (see Sterne et al., 2005 for a review of additional y-axis options) Not recommended in very small meta-analyses (e.g., n < 10)")
11
Funnel Plots Precision of estimates increases as the sample size of a study increases Estimates from small n studies (i.e., less precise, larger standard errors) will show more variability in the effect size estimates, thus a wider scatter on the plot Estimates from larger n studies will show less variability in effect size estimates, thus have a narrower scatter on the plot If publication bias is present, we would expect null or ‘negative’ findings from small n studies to be suppressed (i.e., missing from the plot)
 will show more variability in the effect size estimates, thus a wider scatter on the plot. Estimates from larger n studies will show less variability in effect size estimates, thus have a narrower scatter on the plot. If publication bias is present, we would expect null or ‘negative’ findings from small n studies to be suppressed (i.e., missing from the plot)")
12
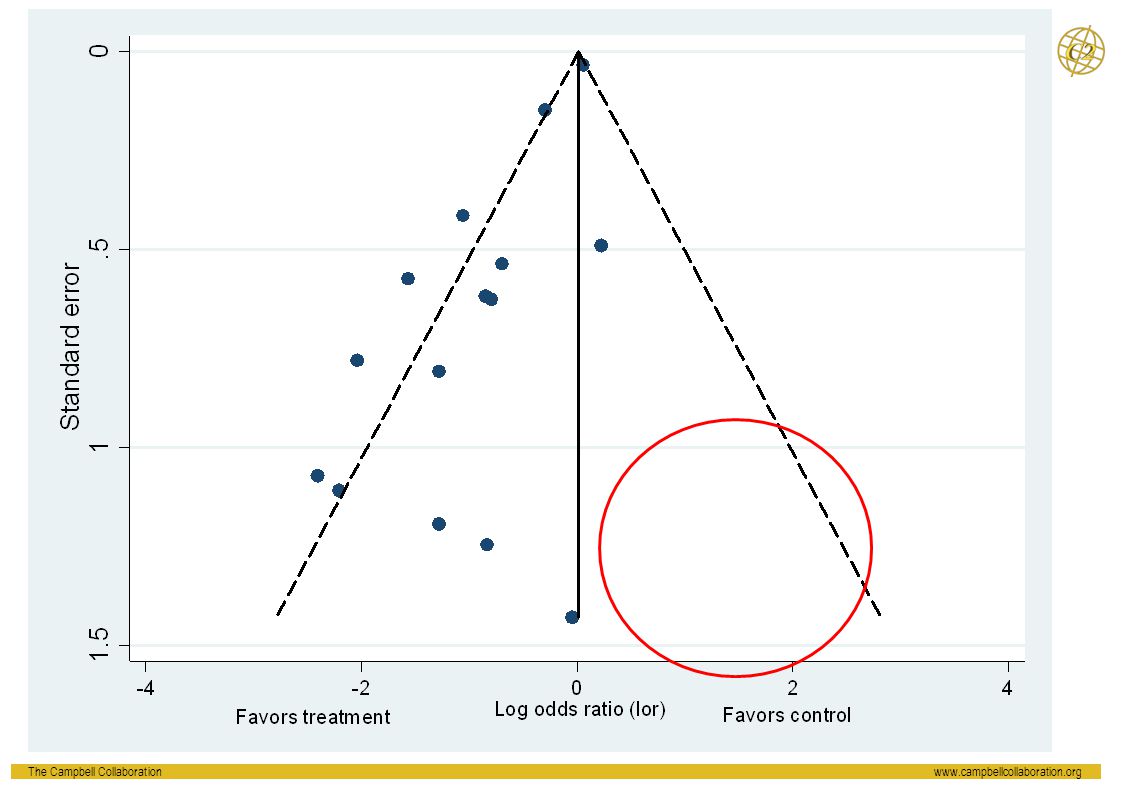
Asymmetry in small n studies provides evidence of possible bias
Note x & y axes Centered around FE mean Pseudo 95% confidence limits Asymmetry in small n studies provides evidence of possible bias

13
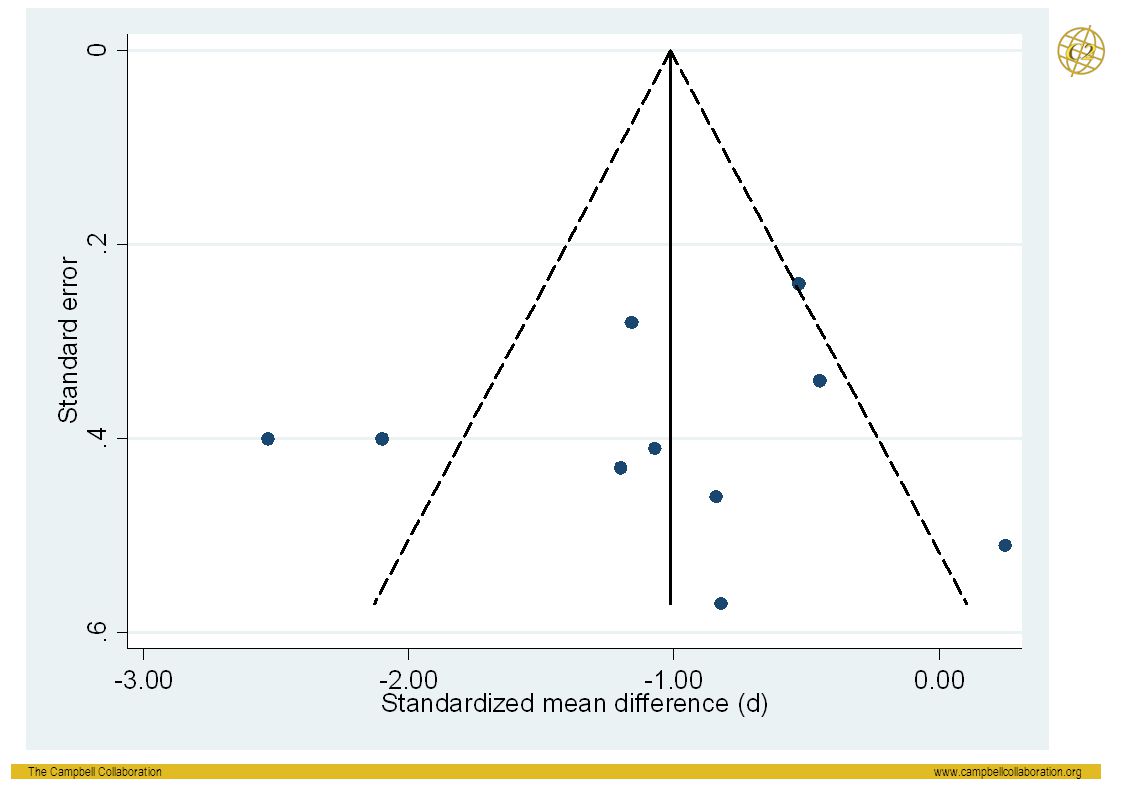
Symmetric funnel plots indicate a possible absence of bias

14
Symmetry difficult to assess with <10 studies

15
Interpreting Funnel Plots
Asymmetry could be due to factors other than publication bias, e.g., poor methodological quality (smaller studies with lower quality may have exaggerated treatment effects) Other reporting biases Artefactual variation Chance True heterogeneity Assessing funnel plot symmetry relies entirely on subjective visual judgment
 Other reporting biases. Artefactual variation. Chance. True heterogeneity. Assessing funnel plot symmetry relies entirely on subjective visual judgment.")
16
Contour Enhanced Funnel Plots
Funnel plot with additional contour lines associated with ‘milestones’ of statistical significance: p = .001, .01, .05, etc. If studies are missing in areas of statistical non-significance, publication bias may be present If studies are missing in areas of statistical significance, asymmetry may be due to factors other than publication bias If there are no studies in areas of statistical significance, publication bias may be present Can help distinguish funnel plot asymmetry due to publication bias versus other factors (Peters et al., 2008)
")
18
Asymmetry may be due to factors other than publication bias

19
Tests for Funnel Plot Asymmetry
Several regression tests are available to test for funnel plot asymmetry Attempt to overcome subjectivity of visual funnel plot inspection Framed as tests for “small study effects”, or the tendency for smaller n studies to show greater effects than larger n studies; i.e., effects aren’t necessarily a result of bias

20
Egger Test Recommended test for mean difference effect sizes (d, g)
Weighted regression of the effect size on standard error β0 = 0 indicates a symmetric funnel plot β0 > 0 shows less precise (i.e., smaller n) studies yield bigger effects Can be extended to include p predictors hypothesized to potentially explain funnel plot asymmetry (see Sterne et al., 2001)
 studies yield bigger effects. Can be extended to include p predictors hypothesized to potentially explain funnel plot asymmetry (see Sterne et al., 2001)")
22
Fail to reject the null hypothesis of no small study effects (b = -1
Fail to reject the null hypothesis of no small study effects (b = -1.14; p = .667) No evidence of “small study bias”
 No evidence of small study bias")
23
Egger Test Limitations
Low power unless there is severe bias and large n Inflated Type I error with large treatment effects, rare event data, or equal sample sizes across studies Inflated Type I error with log odds ratio effect sizes

24
Peters Test Modified Egger test that for use with log odds ratio effect sizes Weighted regression of ES on 1/total sample size

26
Reject the null hypothesis of no small study effects
(b= ;p=.002) Possible evidence of “small study bias”
 Possible evidence of small study bias")
27
Tests for Funnel Plot Asymmetry
Other recommended tests for use with the log odds ratio effect size: Harbord test (Harbord et al., 2006) if τ2 < .10 Rücker test (Rücker et al., 2008) Numerous other tests available (see Sterne et al., 2008 for a review)
 if τ2 < .10. Rücker test (Rücker et al., 2008) Numerous other tests available (see Sterne et al., 2008 for a review)")
28
Other Methods Selection modeling (Hedges & Vevea, 2005)
Incorporate biasing selection mechanism into your model to get an adjusted mean effect size estimate Selection model is rarely known; do sensitivity analysis with alternative selection models Relatively complex to implement, performs poorly with small number of studies

29
Other Methods Trim and fill analysis (Duval & Tweedie, 2000)
Iteratively trims (removes) smaller studies causing asymmetry Uses trimmed plot to re-estimate the mean effect size Fills (replaces) omitted studies and mirror-images Provides an estimate of the number of missing (filled) studies and a new estimate of the mean effect size Major limitations include: misinterpretation of results, assumption of a symmetric funnel plot, poor performance in the presence of heterogeneity
 smaller studies causing asymmetry. Uses trimmed plot to re-estimate the mean effect size. Fills (replaces) omitted studies and mirror-images. Provides an estimate of the number of missing (filled) studies and a new estimate of the mean effect size. Major limitations include: misinterpretation of results, assumption of a symmetric funnel plot, poor performance in the presence of heterogeneity.")
30
Other Methods Sensitivity testing Cumulative meta-analysis
Comparing fixed- and random-effects estimates Cumulative meta-analysis Typically used to update pooled effect size estimate with each new study cumulatively over time Can use as an alternative to update pooled effect size estimate with each study in order of largest to smallest sample size If pooled effect size does not shift with the addition of small n studies, provides some evidence against publication bias

31
Other Methods Failsafe N (Rosenthal 1979)
Number of additional null studies that would be needed to increase the p-value to above .05 Ad hoc rule of thumb that failsafe N less than 5n + 10, results may not be robust to publication bias Several variations of the failsafe N Numerous limitations (not recommended for use); see Becker (2005)
; see Becker (2005)")
32
Detecting Publication Bias in Stata
Several user-written commands are available that automate the most commonly used methods to detect publication bias Method Stata ado-file Funnel plots metafunnel Contour enhanced funnel plots confunnel Egger, Peters, Harbord tests metabias Cumulative meta-analysis metacum Trim and fill analysis metatrim

33
Summary & Recommendations
Publication bias deserves careful consideration in systematic reviews and meta-analyses, given their potentially large impact on policy and practice Narrative and non-systematic reviews are subject to all the same potential biases as systematic reviews and meta-analyses Yet publication bias is rarely if ever acknowledged in narrative reviews Meta-analyses have the benefit of being able to empirically assess the possibility of publication bias and its potential impact on review findings

34
Summary & Recommendations
Reporting biases occur when the nature and direction of research findings influence their dissemination and availability The reality of reporting biases means systematic reviewers must conduct comprehensive literature searches in attempt to locate all eligible studies Protocols and reviews should be explicit and transparent about methods used to assess publication bias

35
Summary & Recommendations
Funnel plots Always examine & report funnel plots when you have 10 or more studies with some variability in standard errors across studies Always consider publication bias as only one possible source of funnel plot asymmetry

36
Summary & Recommendations
Regression tests For continuously measured intervention effects (d, g): Egger test For log odds ratio effect sizes: Peters, Harbord, or Rücker test if τ2 < .10 For log odds ratio effect sizes: Rücker test if τ2 > .10 Acknowledge low power of statistical tests Other sensitivity tests Comparing FE vs. RE estimates, trim & fill analysis, cumulative meta-analysis, selection modeling
: Egger test. For log odds ratio effect sizes: Peters, Harbord, or Rücker test if τ2 < .10. For log odds ratio effect sizes: Rücker test if τ2 > .10. Acknowledge low power of statistical tests. Other sensitivity tests. Comparing FE vs. RE estimates, trim & fill analysis, cumulative meta-analysis, selection modeling.")
37
Summary & Recommendations
What if you find possible evidence of publication or small study bias? “Solution” will vary; requires thoughtful consideration by the reviewers Reconsider search strategy, grey literature inclusion Identify plausible explanations (e.g., study quality, other study characteristics) Explore potential explanations with subgroup and moderator analyses Explicitly acknowledge all potential biases when discussing the findings of the review
 Explore potential explanations with subgroup and moderator analyses. Explicitly acknowledge all potential biases when discussing the findings of the review.")
38
Recommended Reading Duval, S. J., & Tweedie, R. L. (2000). A non-parametric ‘trim and fill’ method of accounting for publication bias in meta-analysis. Journal of the American Statistical Association, 95, Egger, M., Davey Smith, G., Schneider, M., & Minder, C. (1997). Bias in meta-analysis detected by a simple, graphical test. British Medical Journal, 315, Hammerstrøm, K., Wade, A., Jørgensen, A. K. (2010). Searching for studies: A guide to information retrieval for Campbell systematic reviews. Campbell Systematic Review, Supplement 1. Harbord, R. M., Egger, M., & Sterne, J. A. C. (2006). A modified test for small-study effects in meta-analyses of controlled trials with binary endpoints. Statistics in Medicine, 25, Peters, J. L., Sutton, A. J., Jones, D. R., Abrams, K. R., & Rushton, L. (2008). Contour-enhanced meta-analysis funnel plots help distinguish publication bias from other causes of asymmetry. Journal of Clinical Epidemiology, 61,
. A non-parametric ‘trim and fill’ method of accounting for publication bias in meta-analysis. Journal of the American Statistical Association, 95, Egger, M., Davey Smith, G., Schneider, M., & Minder, C. (1997). Bias in meta-analysis detected by a simple, graphical test. British Medical Journal, 315, Hammerstrøm, K., Wade, A., Jørgensen, A. K. (2010). Searching for studies: A guide to information retrieval for Campbell systematic reviews. Campbell Systematic Review, Supplement 1. Harbord, R. M., Egger, M., & Sterne, J. A. C. (2006). A modified test for small-study effects in meta-analyses of controlled trials with binary endpoints. Statistics in Medicine, 25, Peters, J. L., Sutton, A. J., Jones, D. R., Abrams, K. R., & Rushton, L. (2008). Contour-enhanced meta-analysis funnel plots help distinguish publication bias from other causes of asymmetry. Journal of Clinical Epidemiology, 61,")
39
Recommended Reading Rosenthal, R. (1979). The ‘file-drawer problem’ and tolerance for null results. Psychological Bulletin, 86, Rothstein, H. R., Sutton, A. J., & Borenstein, M. L. (Eds). (2005). Publication bias in meta-analysis: Prevention, assessment and adjustments. Hoboken, NJ: Wiley. Rücker, G., Schwarzer, G., & Carpenter, J. (2008). Arcsine test for publication bias in meta-analyses with binary outcomes. Statistics in Medicine, 27, Sterne, J. A., & Egger, M. (2001). Funnel plots for detecting bias in meta-analysis: Guidelines on choice of axis. Journal of Clinical Epidemiology, 54, Sterne, J. A. C., Egger, M., & Moher, D. (Eds.) (2008). Chapter 10: Addressing reporting biases. In J. P. T. Higgins & S. Green (Eds.), Cochrane handbook for systematic reviews of interventions, pp. 297 – 333. Chichester, UK: Wiley. Sterne, J. A. C., et al. (2011). Recommendations for examining and interpreting funnel plot asymmetry in meta-analyses of randomised controlled trials. BMJ, 343, d4002.
. (2005). Publication bias in meta-analysis: Prevention, assessment and adjustments. Hoboken, NJ: Wiley. Rücker, G., Schwarzer, G., & Carpenter, J. (2008). Arcsine test for publication bias in meta-analyses with binary outcomes. Statistics in Medicine, 27, Sterne, J. A., & Egger, M. (2001). Funnel plots for detecting bias in meta-analysis: Guidelines on choice of axis. Journal of Clinical Epidemiology, 54, Sterne, J. A. C., Egger, M., & Moher, D. (Eds.) (2008). Chapter 10: Addressing reporting biases. In J. P. T. Higgins & S. Green (Eds.), Cochrane handbook for systematic reviews of interventions, pp. 297 – 333. Chichester, UK: Wiley. Sterne, J. A. C., et al. (2011). Recommendations for examining and interpreting funnel plot asymmetry in meta-analyses of randomised controlled trials. BMJ, 343, d4002.")
40
E-mail: info@c2admin.org
P.O. Box 7004 St. Olavs plass 0130 Oslo, Norway

Similar presentations


 www.ahrq.gov.>")


 346-2445, © Stevens 2006.>")


