Download presentation
Presentation is loading. Please wait.

1
OPPORTUNITIES FOR ADVANCING SMALL BUSINESSES IN SMALL & RURAL COMMUNITIES Dr. Nancy Miller Colorado State University Business Retention and Expansion Symposium May 30, 2012

2
OVERVIEW General state of small business (US) Small midwestern communities research findings from Studies 1,2, and 3 Identified opportunities for business growth and development Future application-based research directions Discussion
 Small midwestern communities research findings from Studies 1,2, and 3 Identified opportunities for business growth and development Future application-based research directions Discussion")
3
Definition Small businesses, according to the U.S. Small Business Association are independent businesses having fewer than 500 employees Our definition is perhaps a micro business in that we frequently look at independent businesses having fewer than 20 employees with annual sales less than $5 Million or $1 Million. Most have annual sales less than $500,000.

4
Represent 99.7 percent of all employer firms. Employ about half of all private sector employees. Pay 43 percent of total U.S. private payroll. Have generated 65 percent of net new jobs over the past 17 years. Hire 43 percent of high tech workers (scientists, engineers, computer programmers, and others). Are 52 percent home-based and 2 percent franchises. Made up 97.5 percent of all identified exporters and produced 31 percent of export value in FY 2008. Produce 16.5 times more patents per employee than large patenting firms. Overall State of Small Business (US)
. Are 52 percent home-based and 2 percent franchises. Made up 97.5 percent of all identified exporters and produced 31 percent of export value in FY Produce 16.5 times more patents per employee than large patenting firms. Overall State of Small Business (US).")
5
Small businesses with 20-499 employees are leading the charge in increasing private-sector employment. From the second quarter of 2010 to the first quarter of 2011 (the latest firm size data available), private-sector employment rose and these larger small businesses represented over 50 percent of the growth. Small businesses with fewer than 20 employees represented only 12 percent of the employment growth over this time period.
, private-sector employment rose and these larger small businesses represented over 50 percent of the growth. Small businesses with fewer than 20 employees represented only 12 percent of the employment growth over this time period..")
6
Additional Information Seven out of 10 new employer firms survive at least 2 years, half at least 5 years, a third at least 10 years, and a quarter stay in business 15 years or more. Small businesses rely heavily upon owner investment and bank credit, averaging about $80,000 a year for young firms.

7
SMALL MIDWESTERN COMMUNITIES RESEARCH FINDINGS Examples Study 1 Study 2 Study 3

8
8 “The biggest problem facing small businesses is not being small, it is being lonely” (Pyke & Sengenberger, 1992, p. 11).
..")
9
Barriers to Survival and Growth Outshopping & Outsourcing Distances and isolation The US has a whole has an average population density of 95.7 people/square mile, the Midwest states we study have 37.1 people per square mile. (Europe has 298.5) Lack of interstate roads, adequate train systems for movement of people and goods through these remote areas. Working multiple jobs to Creative enough income to stay in place Generate insurance coverage Supplement the small business that may be informal rather than a formal business. Informal involves licit but unregulated work by individuals who do not comply with standard business reporting practices (www.fieldus.org)
 Lack of interstate roads, adequate train systems for movement of people and goods through these remote areas. Working multiple jobs to Creative enough income to stay in place Generate insurance coverage Supplement the small business that may be informal rather than a formal business. Informal involves licit but unregulated work by individuals who do not comply with standard business reporting practices (")
10
ACRA 2009 10 Small Community – Triple Jeopardy Fewer people Fewer dollars Fewer purchases

11
Small Community Situation Small Community Erosion of: Public Infrastructure Community Business Base Skilled Workers Young Families Nationally Nebraska, Kansa, Iowa ranked very low in growth of women- owned businesses (43 rd, 48 th and 49 th respectively), 2010 Census Report
, 2010 Census Report")
12
Small Midwest US Communities Research 1998-2012 3 Studies 1. Survey of Small US Businesses - US Department of Agriculture 1998-2001 2. Study of Business Networks – USDA Fund for Rural America and the National Science Foundation 19 Existing Business networks in 4 Midwest States Development of 5 new networks in 4 Midwest States 2002-2009 3. Amenities and Small Businesses in 3 Midwest States - USDA Including a closer look at women and minority business owners 2009-2012

13
1. Small Community Influences on US Entrepreneurs’ Goals, Strategies, & Success PURPOSE Examine theorized linkages between social factors within the small community and the entrepreneurs’ adoption of goals and business strategies for overall business success. Determine if economic-based as well institutional–based strategies have been adopted by entrepreneurs operating in small US communities. Provide information for strengthening small business success.

14
N. J. Miller Definitions Small Business – fewer than 20 employees and annual sales of less than $1M. Small Communities – 50,000 or less across 4 US Census Regions Entrepreneurs – purchased/launched the business, expected growth, and assumed high risks in management of their operation Standard Industrial Classifications agriculture, construction, transportation, wholesale, retail, F.I.R.E., commercial services, and personal services

15
N. J. Miller Institutional Theory In the economic environment where the product or service is exchanged, there are community norms or rules that require conformance if the organization is to receive support and achieve legitimacy. Concept of LEGITIMACY – acts of an entity are appropriate within a socially constructed system of beliefs (Suchman, 1995) Concept of LOCALITY - “Within a localized business community, firm interactions build a collective capacity for entrepreneurship.” (Johannisson et. al, 2002) “Paradoxically, the enduring competitive advantages in a global economy lie increasingly in local things – knowledge, relationships, and motivation that distant rivals cannot match.” (Porter, 1998)
 Concept of LOCALITY - Within a localized business community, firm interactions build a collective capacity for entrepreneurship. (Johannisson et. al, 2002) Paradoxically, the enduring competitive advantages in a global economy lie increasingly in local things – knowledge, relationships, and motivation that distant rivals cannot match. (Porter, 1998).")
16
N. J. Miller Variables - Example Study As perceived by small business operators: Evidence of Legitimacy = degree of community concern for the business (continuous) Long-Range Goals (suggested five+ categories) Achievement of Goals (continuous) Business Strategies -importance of fourteen (continuous) (Mulford, Schrader, & Hansen, 1988, Miller & Besser 2000) Overall Business Success (continuous)
 Long-Range Goals (suggested five+ categories) Achievement of Goals (continuous) Business Strategies -importance of fourteen (continuous) (Mulford, Schrader, & Hansen, 1988, Miller & Besser 2000) Overall Business Success (continuous).")
17
N. J. Miller Method Stratified systematic random sampling – 1,350 Steps Completed 818 telephone interviews (61% response rate) 809 sent a follow-up mail survey (yield of 505 responses) Elimination of agricultural SIC – inadequate formulation of responses to business strategy questions Further stratification of entrepreneurs from business owners N=205 Questionnaire/Survey items were 5 point Likert-like scales Analyses = descriptive, factor analysis, ANOVA, simple and multiple regression, SEM <.05 Level of Significance =.70 or higher
 809 sent a follow-up mail survey (yield of 505 responses) Elimination of agricultural SIC – inadequate formulation of responses to business strategy questions Further stratification of entrepreneurs from business owners N=205 Questionnaire/Survey items were 5 point Likert-like scales Analyses = descriptive, factor analysis, ANOVA, simple and multiple regression, SEM <.05 Level of Significance =.70 or higher.")
18
N. J. Miller Entrepreneur Characteristics (from a study of N=205) Retail & Service Firms = 110 (53.7%) 95 or (46.3%) in construction, FIRE, manufacture, wholesale, transportation, mining Gender = Males 57% Females 43% Caucasian 95% Age = M 49 years Marital Status = 83% married Child < 18 yrs = 60% none, 30% 1-2 children Education = 61% some post high school education Employees = 32% none, 53% fewer than 4 employees Annual sales for 1999 = $224,900
 Retail & Service Firms = 110 (53.7%) 95 or (46.3%) in construction, FIRE, manufacture, wholesale, transportation, mining Gender = Males 57% Females 43% Caucasian 95% Age = M 49 years Marital Status = 83% married Child < 18 yrs = 60% none, 30% 1-2 children Education = 61% some post high school education Employees = 32% none, 53% fewer than 4 employees Annual sales for 1999 = $224,900.")
19
N. J. Miller Entrepreneur Characteristics Lived in Community = M 20 years Size of Community = M 2.2 1. < 2,500 = 30% 2. 2,500 – 4,999 = 17.6% 3. 5,000 – 9,999 = 19% 4. 10,000 – 50,000 = 33.4% Started business = 67% (22% purchased) Owned the business = M 12 years (half owned less than 10 years) Age of the business = M 17 years Census Regions = Northeast 26.9%, North Central 27.3% South 14.5%, West 31.3%
 Owned the business = M 12 years (half owned less than 10 years) Age of the business = M 17 years Census Regions = Northeast 26.9%, North Central 27.3% South 14.5%, West 31.3%.")
20
N. J. Miller Entrepreneur Characteristics 81% successful in achieving their goals (M=4) 81% successful their overall business (M = 4.18) 93.6% were satisfied with their type of work (M = 4.57) Perceived community concern for their business: 53.4% disagreed, 38.7% agreed 7.8% neutral (M = 3.16)
 81% successful their overall business (M = 4.18) 93.6% were satisfied with their type of work (M = 4.57) Perceived community concern for their business: 53.4% disagreed, 38.7% agreed 7.8% neutral (M = 3.16).")
21
N. J. Miller Prevalent Business Strategies The importance of: Offering quality products and services Developing a good business image Developing managerial skill Training employees Strategy Scale: on all 14 strategies =.70 (M = 3.7)
.")
22
N. J. Miller Most Important Long-Range Goal Maintain a positive reputation with customers (39%) Make a profit (28.3%) Provide a valuable service to the community (12.2% Provide a sense of personal accomplishment (11.2%) Grow or expand (9.3%)
 Make a profit (28.3%) Provide a valuable service to the community (12.2% Provide a sense of personal accomplishment (11.2%) Grow or expand (9.3%).")
23
N. J. Miller Small-Sized Rural Businesses’ Planning Strategies It is important in the small community to: 1. Offer quality products or services 2. Maintain a good business image 3. Develop your own professional skills as a business manager 4. Cooperate with other local businesses 5. Train your employees

24
Overall, a mixed method design used. Phase I Phase II 2. Study of Business Networks

25
Fund for Rural America – USDA and National Science Foundation Business Networks & Rural Community Economic Vitality Summary 1. Multi- Year project ($450,000) Jan. 2002 – 2005 3 Phases involving data collection from existing business networks creation of new business networks development & distribution of outreach materials 2. Project funded by NSF 2005- 2009 Examine the new networks’ development
 Jan – Phases involving data collection from existing business networks creation of new business networks development & distribution of outreach materials 2. Project funded by NSF Examine the new networks’ development.")
26
ACRA 2009 26 Problem: Small businesses in small communities disappearing or failing to thrive

27
Operational Definitions Small Community – less than 10,000 in population, agriculture base, non-adjacent Small Business – less than 20 employees, less than $5M in annual revenue. Networks: groups of businesses joined in voluntary formal organizations ( i.e. the networks contain officers, by-laws, dues, regular meetings) of indefinite duration having as one primary goal the enhancement of business success.
 of indefinite duration having as one primary goal the enhancement of business success..")
28
Sampling in Phase 1: Telephone interviews with 1122 network members of 29 networks Information supplied by the network director Compiled at the network level Averages or percentages from network members Answers from directors Quantitative Qualitative

29
Sampling Strategy 797 Potential Networks 78 Selected Networks 29 Networks Agreed to Study 2,071 members 1,122 completed interviews Sub-sample of Small Businesses n=377

30
Characteristics of the 29 Networks State – 11 in IA, 7 in OH, 6 in NE, 5 in MN Industries – 4 agriculture, 2 construction, 2 FIRE, 3 manufacturing, 3 retail, 2 business services, 2 personal services, 1 home-based business Communities - majority <10,000 population Age - 3 50 yrs, 3 >100 yrs All 29 networks represented in the subsample of 377

31
Small Business Owner Characteristics 13.97 years as owner (average age of business 32 years) Started the business (57.1%) Sole proprietorships (48%) or corporations (47.5%) Employees averaged 4.59 (16% no employees) Revenue $480,035 for 2002 Rated their business success 7.19 (10 pt. scale) 61% intend to expand in the future Membership 13 yrs (out of 14) – joined early
 61% intend to expand in the future Membership 13 yrs (out of 14) – joined early.")
33
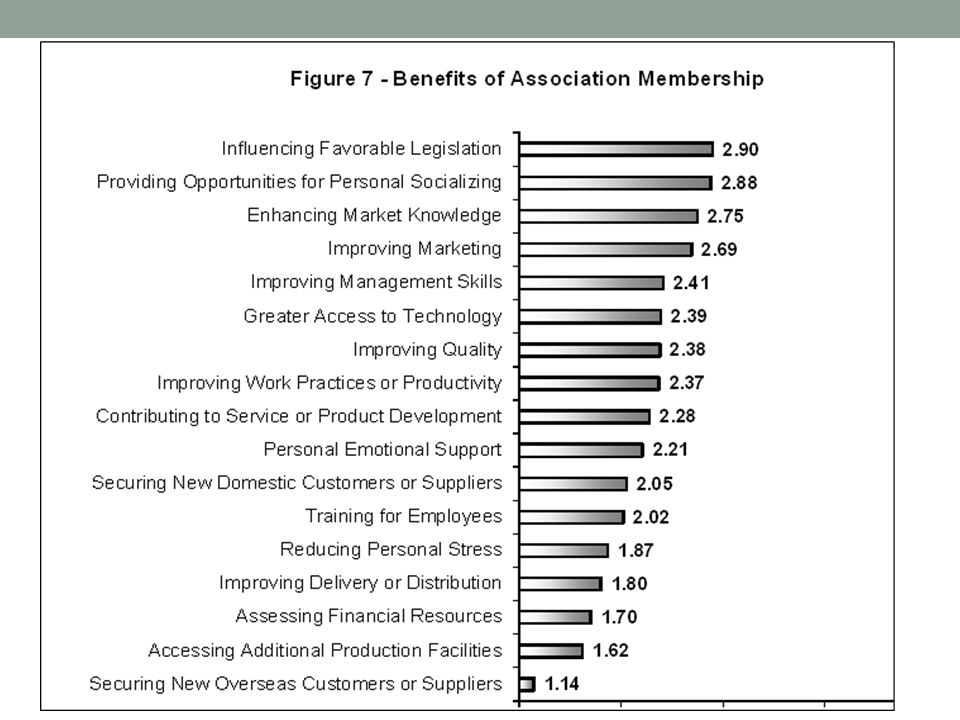
High Performing Networks Higher status members More trust, commitment, shared vision among members Greater frequency of communication among members A newsletter Greater resource flows between members Both high trust and low trust Higher instrumental motivation Accomplishments and Influencing public Greater variation in length of membership More members

34
Keys to Creating and Sustaining High Performing Business Networks 1. Create and utilize mechanisms to develop trust and shared vision among members Ground rules, awards for exemplary sharing, sanctions, role models among high status members, opportunities to work together Selective recruitment of new members

35
Keys to Creating and Sustaining High Performing Business Associations 2. Effective communication mechanisms, especially a newsletter Workshops on internet usage Association internet bulletin board Special rewards for newsletter contributions, outsourcing, sponsors

36
Keys to Creating and Sustaining High Performing Business Associations 3. Mechanisms and/or structures to facilitate resource flows Regular visits to each others’ business An easy to use referral system Workshops and programs to facilitate and inspire cooperative arrangements Time and opportunity for sharing information, both formal and informal

37
Keys to Creating and Sustaining High Performing Business Associations 4. Effective public relations and lobbying for member interests 5. Attract and retain prestigious members (they bring status and clout)
.")
38
Keys to Creating and Sustaining High Performing Business Associations 6. Programs to help businesses be more successful 7. Information to members about the contribution the association makes to their business and personal success

39
The Study of Business Networks and Rural Community Economic Vitality Phase 2: Intended to learn what successful business networks do to motivate and retain membership and to use this knowledge to start new business networks

40
Theoretical Foundations Social Capital Theory: social connections, which may be characterized by norms of accepted behavior and trust, enable participants to act together in pursuit of shared objectives. Strategic Networking Theory: Focuses on the development of trusting and reciprocal relationships among business owners as a tactical stance in competitive markets. Network structures can generate the competitive advantage known as social capital (Burt, 2001). Networked businesses are embedded in social relationships with other businesses that over time can generate trust and expectations of fairness and reciprocity (Granovetter, 1985, Grabher, 1993)
. Networked businesses are embedded in social relationships with other businesses that over time can generate trust and expectations of fairness and reciprocity (Granovetter, 1985, Grabher, 1993).")
41
Potentially Important Factors Resource sharing Shared Vision Benefits to Business Advantages to Network Members Network Continuance Concepts posited in Strategic Networking and Social Networking Theory

42
Proposed Model & Hypotheses Definitions: Resources – tangible and intangible entities used by the business to compete in the market Shared Vision – individuals having shared values and motivations Strategic Planning – deliberate process of attaining and adapting to fit resources and tactics to market opportunities Advantages of Networking – resulting end-products of cooperation and collaboration Network Continuance – likely preservation of the organization through continued membership

43
“Grow Your Own Small Market” Network Iowa Newsletter & Meetings

44
Entrepreneurship Club in Atlantic, Iowa Meetings

45
Specialty Store Network in Nebraska Newsletter, Meetings, & Sharing Market/Product Info

46
Chef – Grower Network in Ohio

47
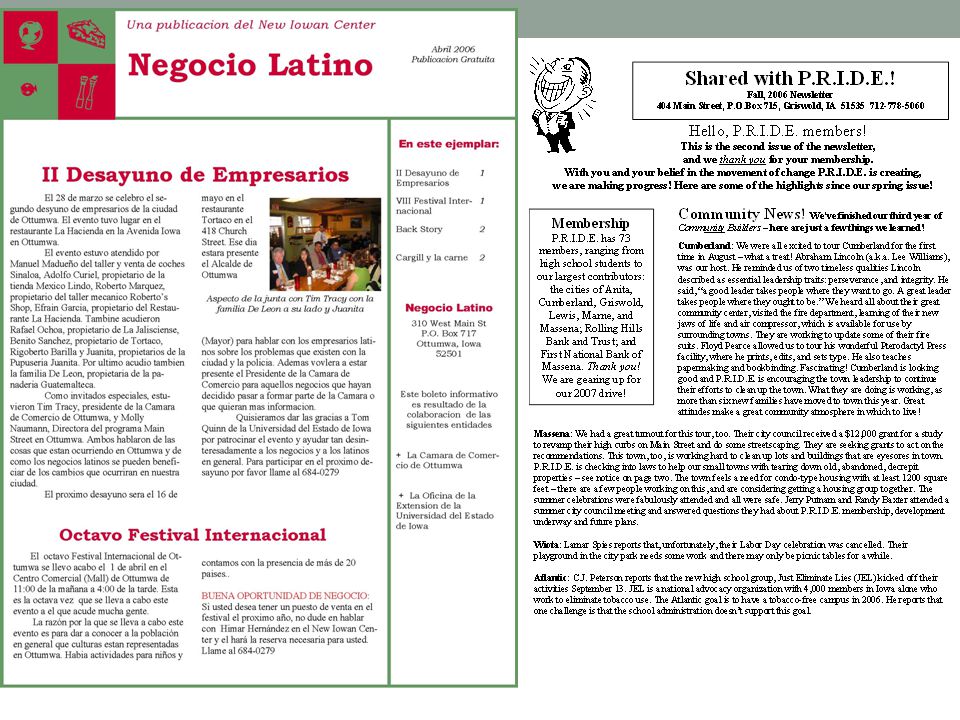
Spanish Speaking Business Association in Ottumwa, Iowa Newsletter and Meetings

48
Phase 3. Blueprint for Starting Business Networks - 6 Modules http://www.soc.iastate.edu/ruralnetworks/ 1. Why Networks? 2. Encouraging Resource and Risk Sharing – building shared vision 3. Communication 4. Recruitment of Members 5. Leadership 6. Transforming an Informal Group into a Formal Network

49
Blueprint for Starting New Business Networks http://www.soc.iastate.edu/ruralnetworks/

50
Blueprint for Starting New Business Networks http://www.soc.iastate.edu/ruralnetworks/

51
Theory Testing – Concepts & Relationships Adoption From Members Network Success Perceived Benefits From Networking Educational Activities Social Capital Network Activities Social Exchange Communication Activities Strategic Network Development Early Network Development Challenges to Member Businesses Reasons for Networking Characteristics Business Success Sharing

52
3. Amenities and Small businesses in rural Communities Focus on Women and Hispanic Business Owners Attempting to build a tool for manual indexing amenity levels for various geographic locations Recreation, Tourism, Community life, Marketplace Exchange = Rural Well-Being Recreation and tourism have been both praised and criticized as a rural development strategy Contributes to local employment… Raises housing costs

53
Recent Reports http://www.soc.iastate.edu/rural/reports.html

54
Research Methodology Data gathered from structured interviews with 1,030 small business owners living in 18 small communities located in Nebraska, Kansas, & Iowa ( 6 towns per state). Four New Destination rural towns (populations of 500 to 10,000) located in non-metropolitan counties with at least 10% Hispanic population Two towns similar to the New Destination towns in size, location, economic base and region of the state but without the influx of Hispanic population
 located in non-metropolitan counties with at least 10% Hispanic population Two towns similar to the New Destination towns in size, location, economic base and region of the state but without the influx of Hispanic population.")
55
Participants Descriptive Statistic Summary Owners – 718 males, 308 females 92% Caucasian, attempted to over sample Hispanic business owners Some Post Secondary Education (not a B.S.) Age 53.9 years with 19.2 years of business experience Men had owned their businesses significantly longer than women 20.52 years for men vs 16.11 years for women Business – Age 29.77 years (22.8% >10 years, 9.2% >5 years) Number of employees averaged 6.68 Business revenue - Males $200-300,000 vs. Females $75,000 to 100,000 Larger % of male owned businesses were inherited or purchased from a family member, whereas women started or purchased from a non-family member Types of businesses – Male and Female significantly different. Male owners were in agriculture, wholesale trade, finance/insurance, professional/scientific/technical services. Female Table 2

56
Business TypeNAICS Code Number of Businesses Percent Female National Percent Female Agriculture, Forestry, Fishing, and Hunting1198 6.5.3 Utilities221 0.1 Construction2335.73.5 Manufacturing31-3333 1.61.4 Wholesale Trade4241 1.31.7 Retail Trade44-45212 27.411.2 Transportation and Warehousing48-4910 2.31.8 Information5113 1.31.2 Finance and Insurance5296 6.52.6 Real Estate, Rental, Leasing5337 4.28.5 Professional, Scientific, and Technical Services5476 7.214.0 Administrative and support, Waste Management, Remediation Services 569.710.3 Education Services611.33.6 Health Care and Social Assistance6231 3.315.7 Arts and Entertainment and Recreation717 14.9 Accommodations and Food Services7276 10.72.4 Other Public Services81188 22.116.1 Public Administration9226.2NA Table 2: Business Products or Services Provided (N= 1023)
")
57
Example study examining the small businesses in the 18 communities Motivations measured by 10 Likert-type questions factor analyzed to create three types of motivations – Table 1 Risk Perception measured on a single item five point scale from which a High/Low bimodal variable was created (Never, Seldom, Sometimes = Low and Often, Very Often = High) Low Risk (n=709) High Risk (n=307 Significantly more women were in the low risk group than the men (75.8% of the women vs. 67.2% of the men) Question: How often are you willing to take a high (or great) risk in business related matters? 1= Never to 5=very often ( 3.00 Mean, 1.08 S.D.)
 Question: How often are you willing to take a high (or great) risk in business related matters. 1= Never to 5=very often ( 3.00 Mean, 1.08 S.D.).")
58
Table 1.Indices for Motivation Variables (N=1030) There are a variety of reasons that people decide to go into business. We’d like to understand your motivations for becoming a business owner. Please rate the following possible reasons where: 1 = not important to 5 = very important.Mean Standard Deviation Component Factor Statistic Extrinsic Motivation Factor Cronbach’s =.70., variance explained = 12.3% 1. Greater financial security for yourself and your family4.031.13.794 2. Having a chance to earn great wealth or a very high income3.021.31.689 3. To provide an income for yourself or your family4.04.93.735 Intrinsic Motivation Factor Cronbach’s =.53, variance explained =10.3 % 1. Building business your children can inherit2.611.50.559 2. Developing new ideas for products or processes2.631.42.821 3. Challenging yourself4.091.02.627 Family Motivation Factor Cronbach’s =.63, variance explained = 32.9% 1. Achieving a higher position in the family2.831.53.569 2. Having flexibility for personal or family life3.841.34.606 3. Being respected by your friends and family3.141.39.713 4. Family tradition2.601.64.667

59
Research Results Risk taking does have a significant effect on: Extrinsic Motivations Intrinsic motivations Gender held a significant effect for Extrinsic Motivation Males = 3.87 M, Females = 3.69 M Among High Risk Takers, Males are significantly higher in Extrinsic Motivation than Females

61
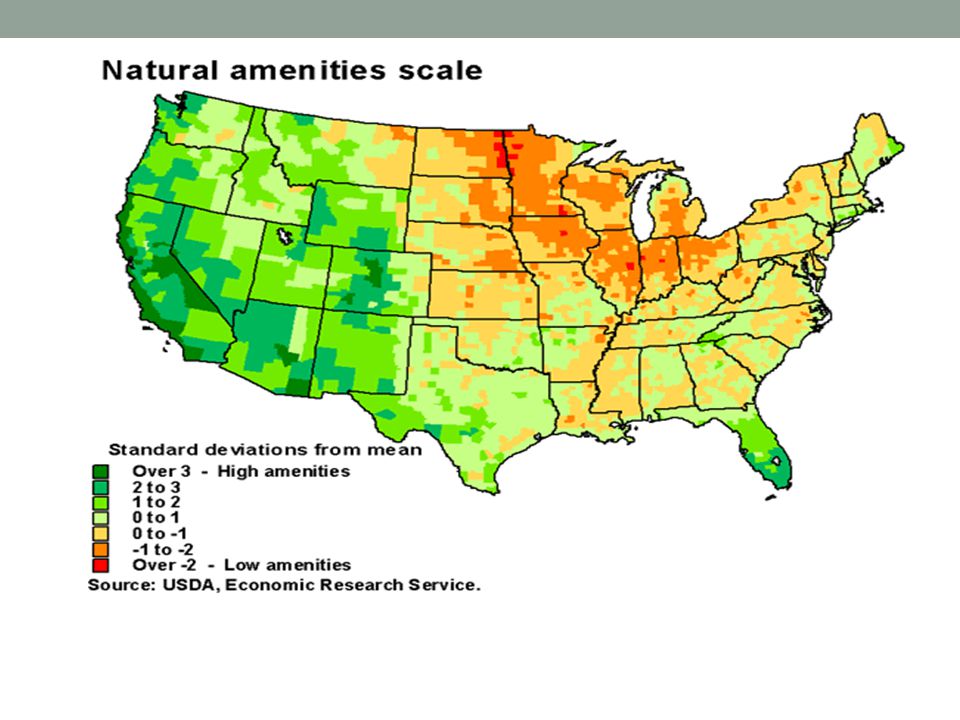
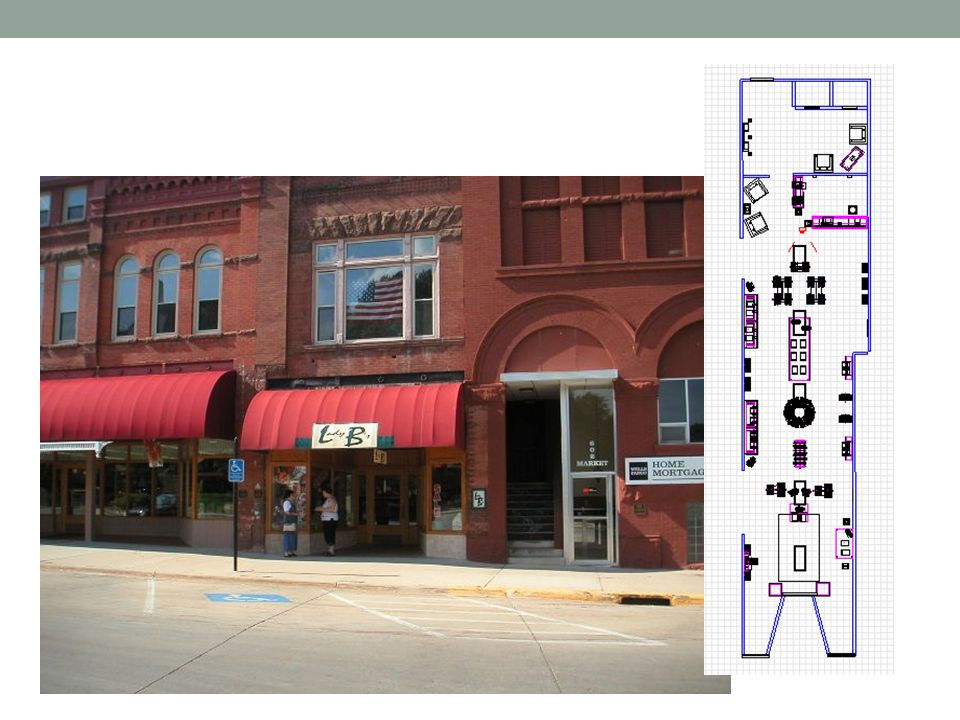
Purpose and Method The purpose of this study was to present an amenity inventory appropriate for small rural towns – with the premise there are variations in amenities among small communities not yet examined or considered. We deemed it important to measure both the quantity and the quality of the amenities. Information for the amenity inventories was gathered through interviews with key informants in the towns (parks and recreation, county extension, development, and library staff and city officials), accessing official reports, and through researchers’ observations. Researchers visited each town in the summer, talked to local residents, observed designated amenities to rate them for quality, and mapped the downtown. The information contained in the inventories can also be gathered by residents.
, accessing official reports, and through researchers’ observations. Researchers visited each town in the summer, talked to local residents, observed designated amenities to rate them for quality, and mapped the downtown. The information contained in the inventories can also be gathered by residents..")
62
Amenity Inventory - Designed to be conducted by community groups Natural Resource Amenities in the County Built Outdoor Recreational Amenities within City Limits Indoor Recreational/Entertainment/Cultural Amenities within the City Limits Public and Private Service Amenities Located within the City Limits Downtown Amenities

63
Amenities: Indoor recreational/entertainment/cultural amenities within the city limits Public aquatic centers/swimming pools 0 = no, 1 = yes Bowling establishments 0 = no, 1 = yes Pool/billiards establishments 0 = no, 1 = yes Video arcades/laser tag/bumper car establishments 0 = no,1 = yes Community playhouse 0 = no, 1 = yes Movie theater 0 = no, 1 = yes Historical museum 0 = no, 1 = yes Art gallery 0 = no, 1 = yes. Number of public/private gyms and recreation centers Number of festivals/events in 2008 Attendance at most recent event Frequency of plays in 2008 Condition of public library building 1 = poor, 5 = great Number of items in the public library circulated per resident in 2008 Number of subscribers to the local newspaper in 2008

64
Findings Expected: the New Destination towns would have experienced a revitalization of their downtowns due to Hispanic businesses operating in what were formerly empty store fronts and Hispanic residents renting downtown over-store apartments. Expected: the presence of a large Hispanic population would enhance the number and variation of festivals and other cultural events with changes apparent in downtown and outdoor/indoor recreational and cultural amenities Findings: When compared to towns of equivalent size, economic base and location in the state, the New Destination towns did not exhibit higher levels of amenities.

65
Findings Business Association membership and Amenities Towns with a higher proportion of business owners/managers who are members of community business associations have significantly higher scores for public and private service amenities than towns with fewer businesses in community associations. Membership in trade associations had an opposite finding. Greater the number of business owners/managers who belong to business associations (i.e. Chambers of Commerce, bed and breakfast…) the lower the town’s scores on indoor recreational and cultural amenities and public and private services
 the lower the town’s scores on indoor recreational and cultural amenities and public and private services.")
66
FINDINGS Summary of key pieces of information from 3 studies

67
Overview Small businesses in small communities conduct business in the economic environment as well as the institutional environment of the marketplace. Small business owners considered themselves +successful, though success was not solely defined as financial +Satisfied with they type of work - Did not believe the community held high concern for their business Majority of owners have some post high school education, were married with children, middle aged.

68
Overview (Continued) Strategies focused on Quality products/service Solid business image Continued development in management and employee training Goals supported the strategies Maintain a positive reputation/image Make a profit Networking Importance… both formally and informally Collective power in changing/supporting legislation Personal socializing Enhance market knowledge and management skills
 Strategies focused on Quality products/service Solid business image Continued development in management and employee training Goals supported the strategies Maintain a positive reputation/image Make a profit Networking Importance… both formally and informally Collective power in changing/supporting legislation Personal socializing Enhance market knowledge and management skills")
69
Identified Future or Continued Opportunities for Business Growth and Development Business Networks Growing and sustaining as competitive advantage Cooperating versus competing Amenity Assessment and Promotion Helping communities help themselves Growth of women-owned businesses offers possibilities for economic momentum and population increase Addressing gender differences in startup funding, networking…. Community matters Support from the community often not perceived Community social environment can affect the economic environment

70
Opportunities for Student Experiential Learning Exposure to small business ventures Graduate - thesis research, presentations, publications Undergraduate – application, research Small Business Owners received Feedback ideas on merchandise and physical space Merchandise budgets and planning Networking meetings, conversations, newsletters Community Partners Economic development agencies Chambers of Commerce Extension Small Business Development Centers Librarians Immigration support groups

71
Translating School Work to Real World Experiences: Small Stores in Small U.S. Communities

72
Section One: The Early Years Section Two: Changes Over the Years Section Three: It’s the Little Things Section Four: Small Business Experiences Section Five: Advice Section Six: Outlook Broken Bow Case Study Video Sections Applications to Teaching

73
Alexis Erickson Merchandising Undergraduate Student & Jennie Price Merchandising Graduate Student

75
Store Front on Main Street U.S.A. Interior

76
The Clothing Company O’Neill, Nebraska

77
Kearney Market September 27th-28th Volume 3 Issue 8 September 2006 Nebraska Apparel Store Association NASA It is time again for the Kearney Market. The group is planning to meet on September 28 following the Kearney Market. We will be meeting at the Ramada Inn in the Lotus room. The meeting will begin at 3:30 pm, end at 5:00 with dinner following the meeting. The address for the hotel is 301 Second Ave. and the phone number is (308) 234-4675. As mentioned earlier we will be hearing from guest speaker Sherri Sobotka from Rural Radio Network, CRMC Regional Account Manager, Columbus, NE– Marketing/Advertising. She specializes in advertising and will be enlightening the group on how to better market your business. Please Bring your advertising techniques and examples to share with the group. if you would like copies of the information we received from Sherri at the summer retreat, please let me know and we can bring copies to the meeting. You may reach me (Audra Soukup) at aasoukup@gmail.com or by phone: (308) 390-5754. I will be in contact the week before market to get an idea for attendance. At our previous meeting we suggested adding new members. If you know of someone that is interested or would like to make a suggestion to the group, please do so at our next meeting. Also, please be prepared to give input on attending the MAGIC Show in Las Vegas. We are looking forward to seeing everyone! RESEARCH OUTREACH Quarterly Newsletter - for member stores
 As mentioned earlier we will be hearing from guest speaker Sherri Sobotka from Rural Radio Network, CRMC Regional Account Manager, Columbus, NE– Marketing/Advertising. She specializes in advertising and will be enlightening the group on how to better market your business. Please Bring your advertising techniques and examples to share with the group. if you would like copies of the information we received from Sherri at the summer retreat, please let me know and we can bring copies to the meeting. You may reach me (Audra Soukup) at or by phone: (308) I will be in contact the week before market to get an idea for attendance. At our previous meeting we suggested adding new members. If you know of someone that is interested or would like to make a suggestion to the group, please do so at our next meeting. Also, please be prepared to give input on attending the MAGIC Show in Las Vegas. We are looking forward to seeing everyone. RESEARCH OUTREACH Quarterly Newsletter - for member stores.")
79
Research Theory Development Undergraduate Level

80
FUTURE RESEARCH Potential Directions

81
Future Directions Family owned businesses Neighboring states or regions – recent findings indicate a small business positive spillover effect rather than a siphoning – acting like cooperative teams (networking) rather than competing (US Small Business Assoc.) Minority Business Owners Non successful or less successful business owner Community amenities and small business ownership
 rather than competing (US Small Business Assoc.) Minority Business Owners Non successful or less successful business owner Community amenities and small business ownership")
82
DISCUSSION Ideas for going forward in Canada

83
N. J. Miller

84
Variables Mean Square for Extrinsic Motivation Multivariate F- value Mean Square for Intrinsic Motivation Multivariate F- value Mean Square for Family Motivation Multivariate F - value Risk Taking 3.083.87*16.7419.01**.074.79 Gender 5.406.80**.400.4542.312.25 Risk Taking X Gender.004.005.140.158.139.135 Adj R 2.012.025.001 Table 4. Effects of Gender and Risk Taking on Motivations for Operating a Small Business. Wilks’ Lambda *p<.05, **p<.01 (df = 3, N = 970) Research Results
 Research Results.")
86
Risk TakingMotivationsGenderMeanFt Low (n=324) External 2.981.55 Males3.79 Females3.60 Intrinsic.029-.424 Males2.86 Females2.91 Family 4.81.37 Males3.12 Females2.94 High (n= 646) External 8.082.54* Males3.92 Females3.71 Intrinsic.3251.59 Males3.27 Females3.14 Family 8.621.25 Males3.14 Females3.02 Table 5. Examining Differences in Motivation by Gender and Risk Taking (N= 970 ) (t = variances not assumed, p >.05)
 (t = variances not assumed, p >.05).")
Similar presentations


. Key Concepts Managerial Cognition Business Model Stakeholders The Balanced Scorecard.>")


>")
