Download presentation
Presentation is loading. Please wait.

1
Aggregate Planning IE 314: Operations Management KAMAL Lecture 7

3
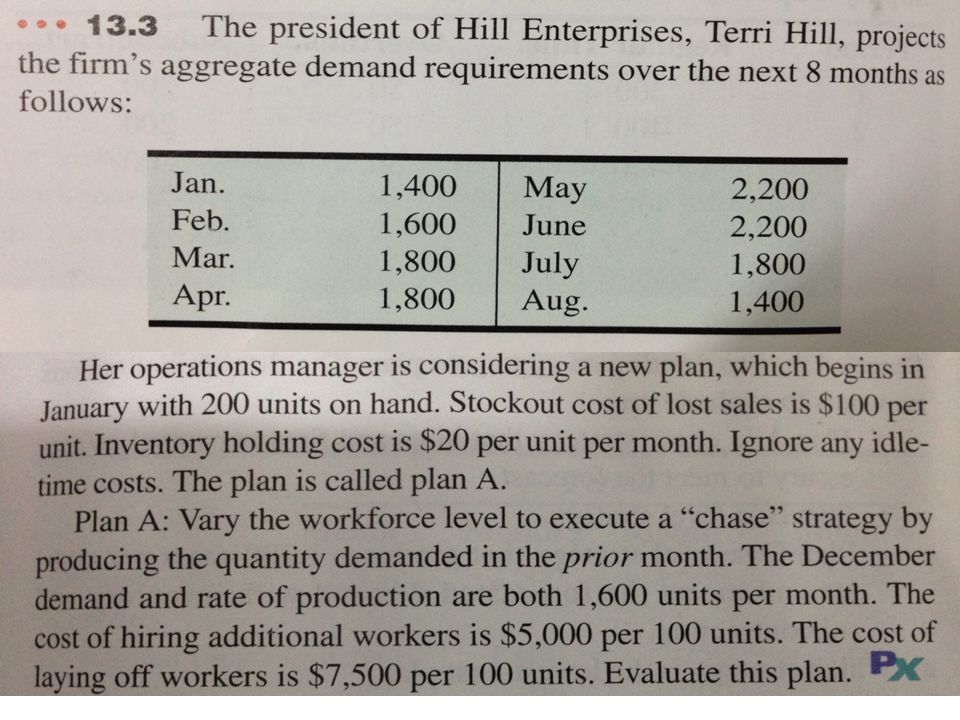
EXERCISE 13.3 13.3 (cont’d) Plan A Production (Result of PreviousInventoryStockoutHireLayoffPersonnel PeriodDemandMonth)(Units) Cost 1 (Jan)1,4001,600 400200 $15,000 (cost to go from 1,600 in Jan to 1,400 in Feb) 2 (Feb)1,6001,400 200 10,000 (cost to go from 1,400 in Feb to 1,600 in Mar) 3 (Mar)1,8001,60020010,000 4 (Apr)1,800 — 5 (May)2,2001,800 400 20,000 6 (June)2,200 — 7 (July)1,8002,200 400 30,000 8 (Aug)1,4001,800 800400 30,000 (cost to go from 1,800 in August to 1,400 in Sept) 1,800$400Total $115,000 @ $20@ $100Personnel Cost: =$36,000=$40,000
 Plan A Production (Result of PreviousInventoryStockoutHireLayoffPersonnel PeriodDemandMonth)(Units) Cost 1 (Jan)1,4001, $15,000 (cost to go from 1,600 in Jan to 1,400 in Feb) 2 (Feb)1,6001, ,000 (cost to go from 1,400 in Feb to 1,600 in Mar) 3 (Mar)1,8001, ,000 4 (Apr)1,800 — 5 (May)2,2001, ,000 6 (June)2,200 — 7 (July)1,8002, ,000 8 (Aug)1,4001, ,000 (cost to go from 1,800 in August to 1,400 in Sept) 1,800$400Total $100Personnel Cost: =$36,000=$40,000")
5
EXERCISE 13.4 Plan B PeriodDemandProductionEnding Inv.Subcon (Units)Extra Cost 0200 11,400 200—$4,000 21,6001,400 0 —— 31,8001,400 0 40030,000 41,8001,400 0 40030,000 52,2001,400 0 80060,000 62,2001,400 0 80060,000 71,8001,400 0 40030,000 81,400 0 — Total Extra Cost: $214,000
Extra Cost , —$4,000 21,6001,400 0 —— 31,8001, ,000 41,8001, ,000 52,2001, ,000 62,2001, ,000 71,8001, ,000 81,400 0 — Total Extra Cost: $214,000")
7
EXERCISE 13.5 Plan C PeriodDemandProduction*Ending Inv.Stockouts (Units)Extra Cost 0200 11,4001,775575$11,500 21,6001,775750 15,000 31,8001,775725 14,500 41,8001,775700 14,000 52,2001,775275 5,500 62,2001,775 0 150 15,000 71,8001,775 0 25 2,500 81,4001,775375 7,500 Total Extra Cost: $85,500
Extra Cost ,4001,775575$11,500 21,6001, ,000 31,8001, ,500 41,8001, ,000 52,2001, ,500 62,2001, ,000 71,8001, ,500 81,4001, ,500 Total Extra Cost: $85,500")
9
EXERCISE 13.6 Plan D Reg.O.T.End Inv.StockoutsExtra PeriodDemand(Units) Cost 0200 11,4001,600—400$8,000 21,600 —4008,000 31,8001,600—2004,000 41,8001,600——0 52,2001,600320—28044,000 62,2001,600320—28044,000 71,8001,600200—10,000 81,4001,600—2004,000 Total Extra Cost: $122,000
 Cost ,4001,600—400$8,000 21,600 —4008,000 31,8001,600—2004,000 41,8001,600——0 52,2001,600320—28044,000 62,2001,600320—28044,000 71,8001,600200—10,000 81,4001,600—2004,000 Total Extra Cost: $122,000")
10
EXERCISE 13.6 Reg.O.T.End Inv.StockoutsExtra PeriodDemand(Units) Cost 0200 11,4001,600—400$8,000 21,600 —4008,000 31,8001,600 802809,600 41,8001,60032040024,000 52,2001,60032012018,400 62,2001,600320—16032,000 71,8001,600200—10,000 81,4001,600—2004,000 Total Extra Cost: $114,000
 Cost ,4001,600—400$8,000 21,600 —4008,000 31,8001, ,600 41,8001, ,000 52,2001, ,400 62,2001,600320—16032,000 71,8001,600200—10,000 81,4001,600—2004,000 Total Extra Cost: $114,000")
11
EXERCISE 13.6 (b) Plan E PeriodDemandProduction Subcont (Units)Ending Inv.Extra Cost 0200 11,4001,600400 $8,000 21,600 400 8,000 31,8001,600200 4,000 41,8001,600 0 52,2001,600600 45,000 62,2001,600600 45,000 71,8001,600200 15,000 81,4001,600200 4,000 Total Extra Cost: $129,000
 Plan E PeriodDemandProduction Subcont (Units)Ending Inv.Extra Cost ,4001, $8,000 21, ,000 31,8001, ,000 41,8001, ,2001, ,000 62,2001, ,000 71,8001, ,000 81,4001, ,000 Total Extra Cost: $129,000")
13
Unused CapacityTotal Supply JanFebMarAprMayJun January Regular Time Over Time Sub. Contract. February Regular Time Over Time Sub. Contract. March Regular Time Over Time Sub. Contract. April Regular Time Over Time Sub. Contract. May Regular Time Over Time Sub. Contract. June Regular Time Over Time Sub. Contract. Total Demand 800 1100 200 300 100 300 150 350 100 800 20010001200125014501400 800 1100 300 150 300 350 400 800 7900 12 11 16 18.5 17

14
EXERCISE 13.16 Total Cost = 4 (800*12) + (200*16 ) + (100*17) + 5(300*16) + 2(1100*11) + (500*18.5) = 38,400 + 3,200 + 1,700 + 24,000 + 24,200 + 9,250 Total Cost = $100,750
 + (200*16 ) + (100*17) + 5(300*16) + 2(1100*11) + (500*18.5) = 38, , , , , ,250 Total Cost = $100,750")
16
150 130 150 10 20 10 50 10 150160130200230 100 135 125 128 103 131 134 131 128 Unused CapacityTotal Supply 12345 1 Regular Time Over Time Sub. Contract. 2 Regular Time Over Time Sub. Contract. 3 Regular Time Over Time Sub. Contract. 4 Regular Time Over Time Sub. Contract. 5 Regular Time Over Time Sub. Contract. Total Demand 20 150 10 50 870 150

17
EXERCISE 13.18 Total Cost = 4 (150*100) + (130*100 ) + 2(10*128) + (10*134)+ (30*131) + (20*103) + (10*125) +(50*135) = 60,000 + 13,000 + 2,560 + 1,340 + 3,930 + 2,060 + 1,250 + 6,750 Total Cost = $90,890
 + (130*100 ) + 2(10*128) + (10*134)+ (30*131) + (20*103) + (10*125) +(50*135) = 60, , , , , , , ,750 Total Cost = $90,890")
19
EXERCISE 13.20 EstimatedReg. time BillablebillableReg. Time“Overtime”OvertimeForrester MonthhoursCPAshourscosthourscosthourscost Jan 600 4640 $20,000 0 $0 0 0 Feb 500 4640 $20,000 0 $0 0 Mar 1,0004640 $20,000 320 $20,000 40 $5,000 Apr 1,2004640 $20,000 320 $20,000240$30,000 May 650 4640 $20,000 10 $625 0 $0 June 590 4640 $20,000 0 $0 0 $120,000650$40,625280$35,000 Total cost = $120,000 + $40,625 + $35,000 = $195,625

20
EXERCISE 13.22

21
Old Model Sales= Avg. passengers * Net price/seat = 80 * (140 - 25) = $9,200 New Approach Sales = 65*(80-25)+35*(190-25) = 3,575 + 5,775 = $9,350 The new model is slightly better in sales.
 = $9,200 New Approach Sales = 65*(80-25)+35*(190-25) = 3, ,775 = $9,350 The new model is slightly better in sales..")
22
HW 13.11 13.12 13.17 13.19

Similar presentations


 per 100mL of River/Estuary Water Dec 4, 2001.>")


>")