Download presentation
Presentation is loading. Please wait.

1
The Messinian Salinity Crisis Brendan Seely Ryan Shirilla

2
Outline: What is the Messinian Salinity Crisis ? What Caused It ? What Evidence Do We Have to Prove the Crisis Happened ?

3
What is the Messinian Salinity Crisis ? Messianian = geologic interval of time corresponding to dated fossils found in rock formation near Messina, Sicily Crisis = complete drying up of Mediterranean basin 5.5 Ma: Repeated flooding and dessication of the Mediterranean Sea basin over a 700,000 year span.

4
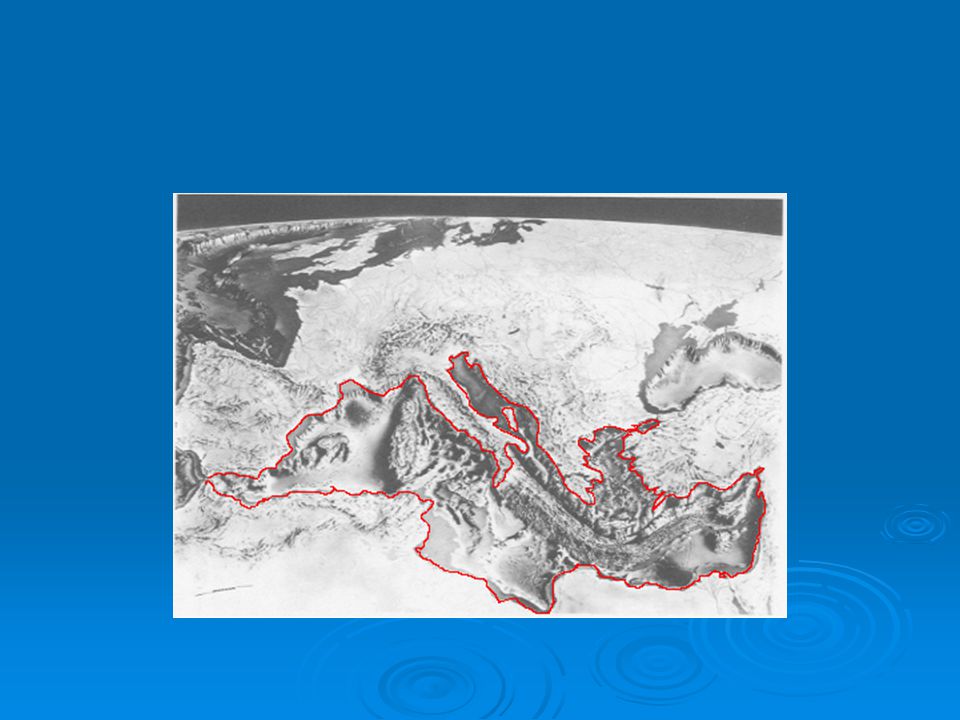
Present Day Mediterranean Sea

5
Two Periods of Evaporite Deposition: 1. 5.5 Ma – First deposition of evaporates 2. Atlantic cut off completely 3. Period of non-deposition and erosion 4. Marine transgression 5. Deep-H 2 O sedimentation 6. Cut off again – Evaporite deposition 7. Seawater refilled basin 4.8 Ma

6
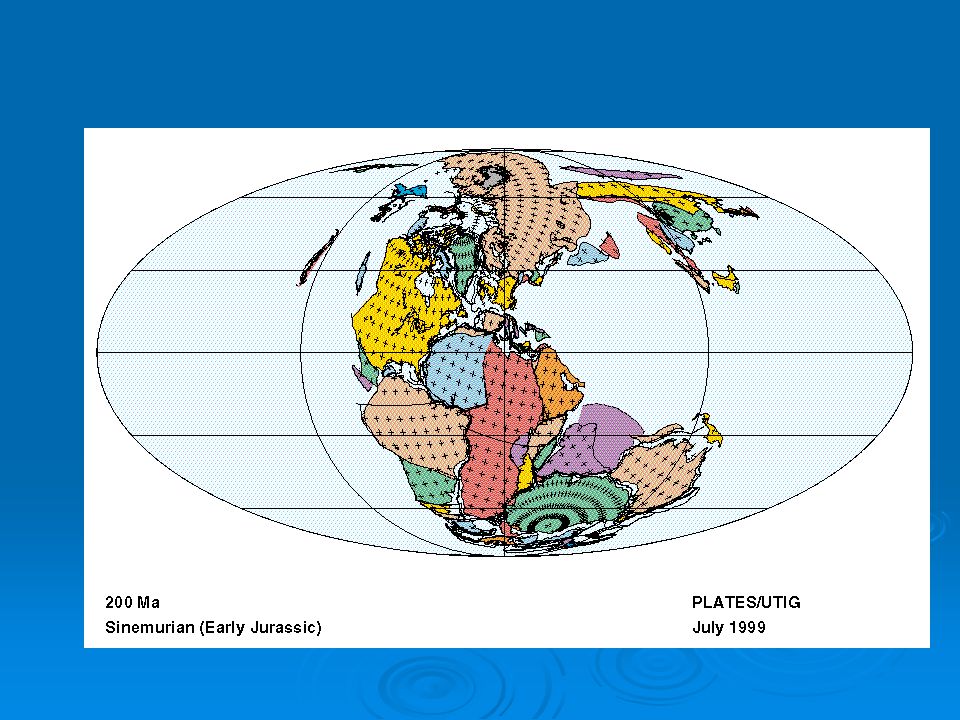
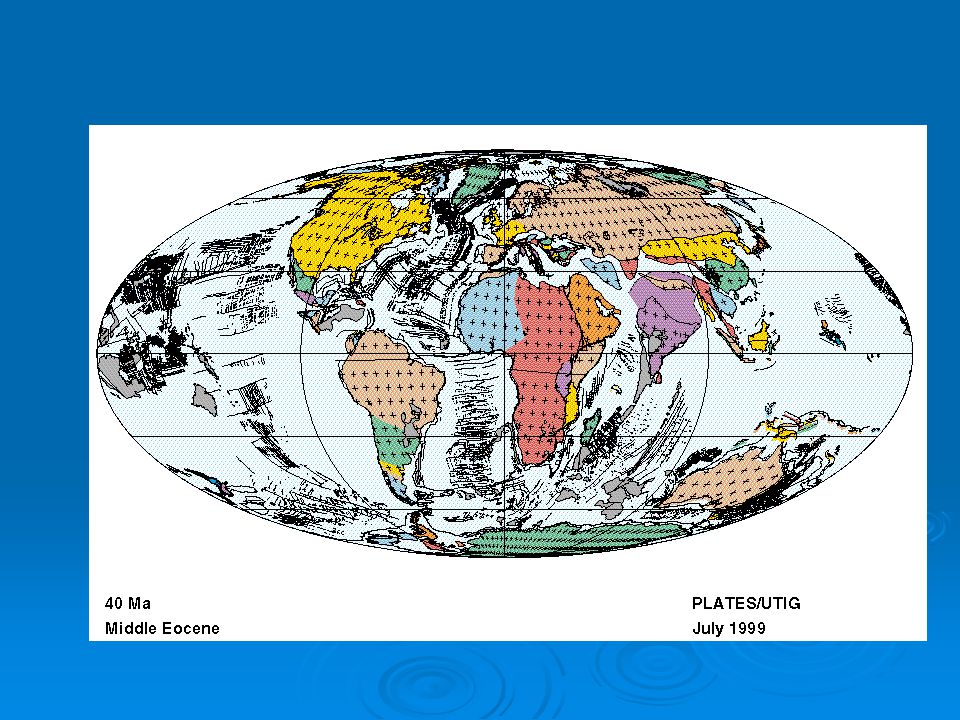
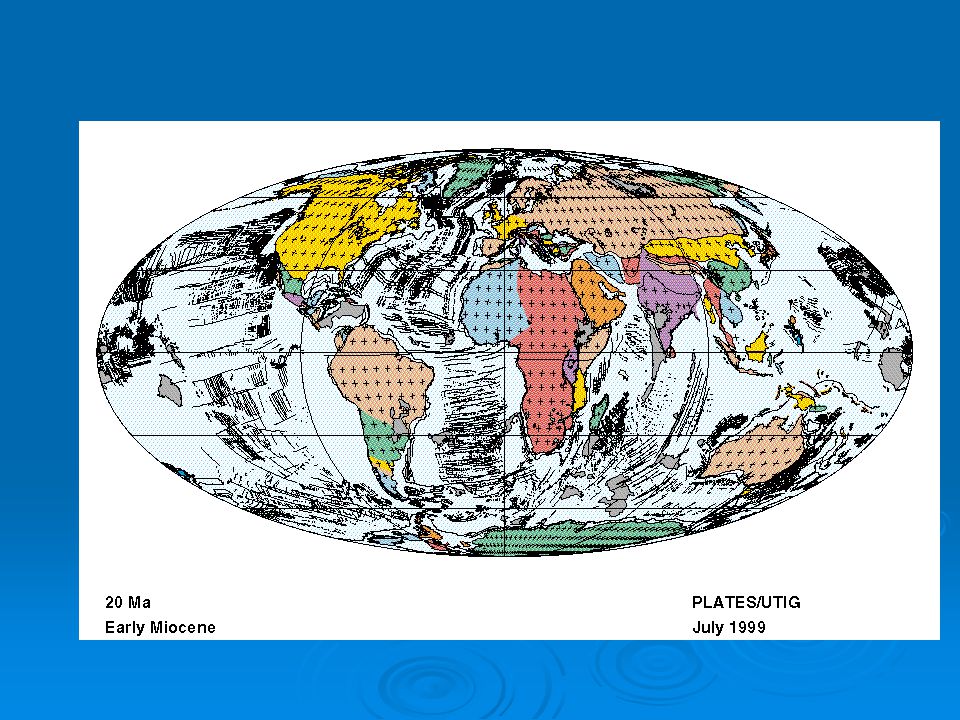
Cause: 20 Ma 1. Arabian plate impinged upon Eurasion plate blocking connection between Mediterranean and Indian ocean 2. Mediterranean totally landlocked with exception of small connection to Atlantic 3. Connection closed periodically as Africa moved closer to Europe 4. Led to drier climatic conditions in entire region

29
Cause: 5-6 Ma 1. Connection of Red Sea and Mediterranean was broken (formed) 2. Deposition of evaporates ceased in Red Sea, but developed in Mediterranean 3. Thick salts were deposited over next 700,000 yrs. 4. Combined effects of uplift in west (African plate) and fall of sea levels Flooding caused by sea level changes due to changes in glacier ice volumes in Miocene and early PlioceneFlooding caused by sea level changes due to changes in glacier ice volumes in Miocene and early Pliocene 5. Time to dry up
 and fall of sea levels Flooding caused by sea level changes due to changes in glacier ice volumes in Miocene and early PlioceneFlooding caused by sea level changes due to changes in glacier ice volumes in Miocene and early Pliocene 5. Time to dry up.")
30
Time to Dry: - Surface area of Mediterranean = 2.5 x 10 6 km 2 - Surface area of Mediterranean = 2.5 x 10 6 km 2 -Depth 1.5 km -Depth 1.5 km -Volume 3.75 x 10 6 km 3 -Volume 3.75 x 10 6 km 3 -Present rate of evaporation = 4.7 x 10 3 km 3 -Present rate of evaporation = 4.7 x 10 3 km 3 -Annual precipitation 1.2 x 10 3 km 3 -Annual precipitation 1.2 x 10 3 km 3 -River input 0.25 x 10 3 km 3 -River input 0.25 x 10 3 km 3 -Loss = 3.25 x 10 3 km 3 /yr -Loss = 3.25 x 10 3 km 3 /yr -Made up for by input from Atlantic -Made up for by input from Atlantic *without Atlantic, Mediterranean would dry up in 1,153 yrs

31
Evidence: Buried river gorges below sea level at base of Nile and Rhone deltas Late Miocene salt deposits (>1km thick, from cores)
")
32
Evidence: Salt domes (seen wherever evaporates are overlain by sediment)
")
33
“Pillar of Atlantis”

34
Evidence: DSDP Core “Pillar of Atlantis” Anhydrite and stromatolite, which is usually only seen in arid coastal flats Anhydrite and stromatolite, which is usually only seen in arid coastal flats Turned scientists on to idea of Mediterranean as a desert. Turned scientists on to idea of Mediterranean as a desert.

35
Problem: No way present volume of 3.75 x 10 6 km 3 could produce 1 km salt Salts have volume of 6.5 x 10 4 km 3 Salts have volume of 6.5 x 10 4 km 3 Over 2 x 10 6 km 2 (4/5 area of Mediterranean) = 32.5 m thick Over 2 x 10 6 km 2 (4/5 area of Mediterranean) = 32.5 m thick Therefore, Mediterranean could not have been totally cut off from Atlantic Therefore, Mediterranean could not have been totally cut off from Atlantic Huge volumes of water must have poured over (Gibraltar waterfall) for continuous deposition Huge volumes of water must have poured over (Gibraltar waterfall) for continuous deposition
 = 32.5 m thick Over 2 x 10 6 km 2 (4/5 area of Mediterranean) = 32.5 m thick Therefore, Mediterranean could not have been totally cut off from Atlantic Therefore, Mediterranean could not have been totally cut off from Atlantic Huge volumes of water must have poured over (Gibraltar waterfall) for continuous deposition Huge volumes of water must have poured over (Gibraltar waterfall) for continuous deposition")
36
Gibraltar Waterfall 100 times larger than the Victoria Falls on Zambezi River! Allowed for continuous deposition of salt water into the Mediterranean

37
Victoria Waterfall, Zimbabwe

38
More Evidence: 18 O Changes in sea level from glacier volumes recorded by benthic foraminifera in sediment from Atlantic and Pacific and compared to evaporite ages Changes in sea level from glacier volumes recorded by benthic foraminifera in sediment from Atlantic and Pacific and compared to evaporite ages

40
18 O Data From Foraminifera

41
Back to “Normal”: 4.8 Ma 4.8 Ma Whole basin refilled, normal marine conditions ensued, mud and carbonate deposition, cold deep water from Atlantic had access. Whole basin refilled, normal marine conditions ensued, mud and carbonate deposition, cold deep water from Atlantic had access. 1 Ma sill uplifted and deep supply cut off 1 Ma sill uplifted and deep supply cut off

42
History of Events:

43
Review: 5.5 Ma: Repeat dessication and flooding 1.5 km: Average depth of salt deposit (3 km max) (3 km max) 4.8 Ma: Seawater refills basin Caused: Combination of tectonic activity and glacial/interglacial periods
 (3 km max) 4.8 Ma: Seawater refills basin Caused: Combination of tectonic activity and glacial/interglacial periods")
44
THE END

Similar presentations


 There is a riverine source …BUT… salinity.>")
>")


