Download presentation
Presentation is loading. Please wait.

1
Mark Lindemann NDOR Geotechnical Engineer

2
Background on previous field testing Research – Non-nuclear field testing Cost Savings of Going Non-Nuclear Fundamentals of LWD LWD Correlation Field Implementation

3
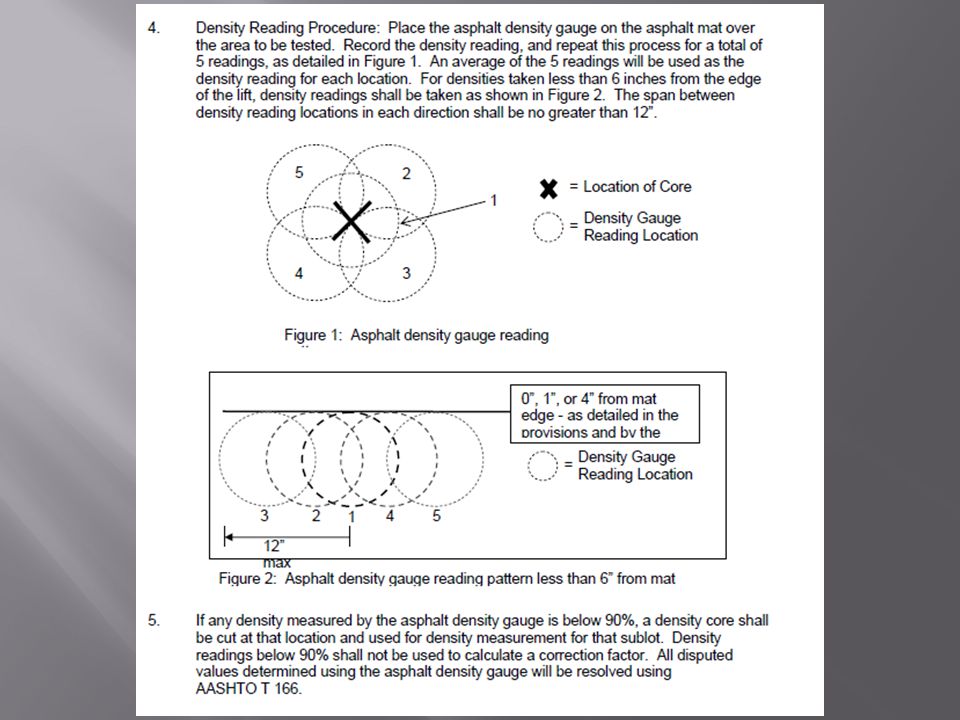
Volumemeasure Test Method

4
Nuclear Density & Moisture Gauge (NDG)
")
5
Why fix what isn’t broken? Nuclear Gauges – Regulations Licensing Storage and transport Training Costs add up Have 84 gauges needing replacement Possible Fines Approximately $250,000/ year Falls in Line with Every Day Counts Initiative Innovative Technologies

6
University of Nebraska – Dr. Yong K. Cho Non-Nuclear Methods for HMA and Soil Density Historical research Field Research: PQI (HMA) Compare to Nuclear Density Gauge Bulk Specific Gravity of Asphalt Cores (AASHTO T166)
 Compare to Nuclear Density Gauge Bulk Specific Gravity of Asphalt Cores (AASHTO T166).")
7
PQI (Pavement Quality Indicator) Measures the change in electromagnetic field as current is sent through the material. Calibrated with average of 5 core densities and average of 5 PQI densities.

8
Results: Both Nuclear and PQI provided results very close to asphalt core values Nuclear gauge closer to asphalt core values (+1.07 lb/ft 3 ) PQI gauge values -1.89 lb/ft 3 to asphalt core values.
 PQI gauge values lb/ft 3 to asphalt core values.")
15
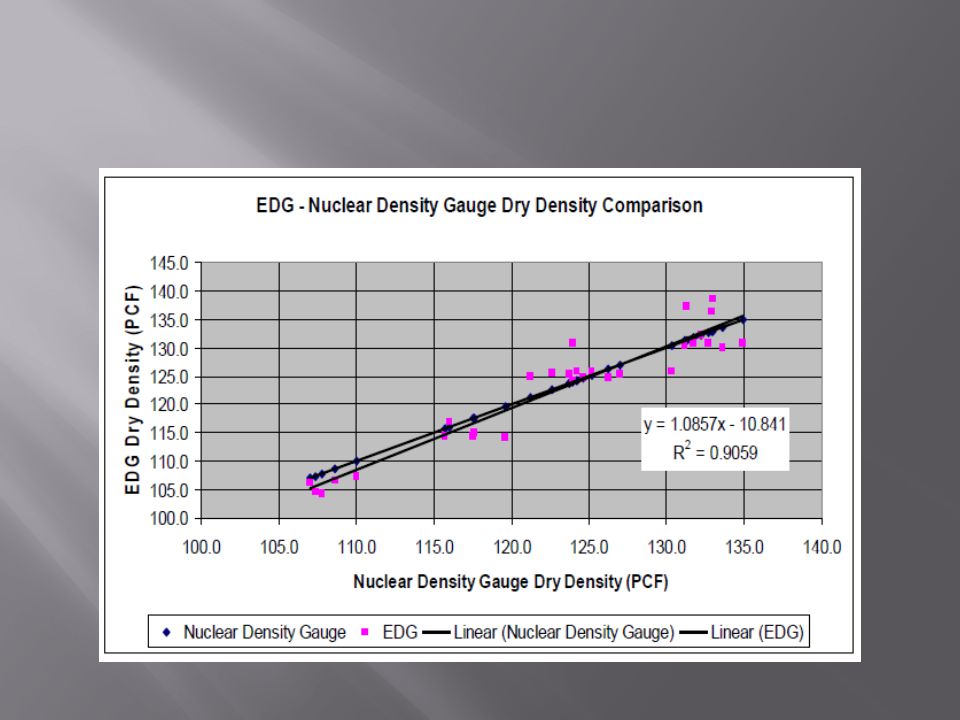
Nuclear Results: Average difference of 1.71 pcf compared to standard for density. Average difference of 0.22% for moisture. EDG Results: Average difference of 9.86 pcf compared to standard for density Average difference of 1.66% for moisture.

16
M+DI (Moisture Density Indicator) Uses Time Domain Reflectometry to send electromagnetic pulse through soil Requires correlation of several points from Proctor tests Takes 15 to 20 minutes per test. Had trouble with device at beginning Removed from testing

21
Light-Weight Deflectometer (LWD) Measures soil surface deflection Provides Modulus, Deflection, Velocity No moisture content results
 Measures soil surface deflection Provides Modulus, Deflection, Velocity No moisture content results")
22
LWD Results: Compared Pass/Fail results based on 95% compaction of devices to standard (lab) Nuclear Gauge: 72% correlation LWD: 54% correlation Overall – best correlation of new devices Suggest better way to determine target value (not density)
 Nuclear Gauge: 72% correlation LWD: 54% correlation Overall – best correlation of new devices Suggest better way to determine target value (not density)")
23
Widely Accepted QA/QC Method Indirect Parameter of Strength Small Variations – Result Large Variation in Stiffness Compaction Lab vs. Compaction Field Costs/Regulations of Nuclear Results are Material dependent based on a small sample compared to that in the field.

25
LWD Initial Costs: $8,257 Thermal Paper: $20/ Year Maintenance/ Calibration: $300

26
Net Present Worth of Costs (NPW)= Initial Costs + Yearly Costs (P/A, 15 yrs, 10%) NPW of Nuclear Gauge= $10,873 + $2,155(P/A, 15yrs, 10%) = $27,264 NPW of LWD = $8,257 + $320(P/A, 15yrs, 10%) = $10,690
= Initial Costs + Yearly Costs (P/A, 15 yrs, 10%) NPW of Nuclear Gauge= $10,873 + $2,155(P/A, 15yrs, 10%) = $27,264 NPW of LWD = $8,257 + $320(P/A, 15yrs, 10%) = $10,690")
27
Dynamic non-destructive testing tool Measure layer/surface modulus (stiffness) How it works Transient Load on Loading Plate Accelerometer within the device measures the deflection of the ground due to the load Soil Modulus back-calculated based on deflection and assumed Poisson’s ratio. Results taken as an immediate indication of the materials strength (ability to support roadway) http://www.youtube.com/watch?v=6WGgosXlHss
 v=6WGgosXlHss.")
28
Modulus Calculation: E o = f x (1- 2 ) x o x a / d o E o = Modulus f = Plate Rigidity factor (2) Poisson’s Ratio (0.35) o = Maximum contact stress a = Plate Radius d o = Maximum deflection
 x o x a / d o E o = Modulus f = Plate Rigidity factor (2) Poisson’s Ratio (0.35) o = Maximum contact stress a = Plate Radius d o = Maximum deflection")
29
Zorn Keros Dynatest Prima Loadman ELE

30
ASTM E 2835-11 for LWD without Load Cell ASTM E2583-07 for LWD with Load Cell Plate Size Drop Height Falling Weight Type and location of Sensors Significant variability between manufacturers Seating Load (3 Drops) Testing Load (3 Additional Drops)
 Testing Load (3 Additional Drops)")
31
MnDot Research – Beginning 1997 NCHRP – 382 & 456 Colorado DOT Vermont DOT US Army Corps of Engineers UK – Fleming, Frost, and Lambert Virginia Transportation Research Council Kansas DOT Louisiana Transportation Research Center

32
Several LWD models with variety of differences Steel spring buffer and accelerometer in plate Critical to use same device with same plate diameter, drop height, and falling mass Hand-held recording instrument SD card memory Graphical and numerical results Printout of results GPS capability

34
Normal Result For unbound materials

35
Rebound Common for Bound materials If rebound is >20% Of Peak Re-seat and retest

36
Variable May be poor Compaction

38
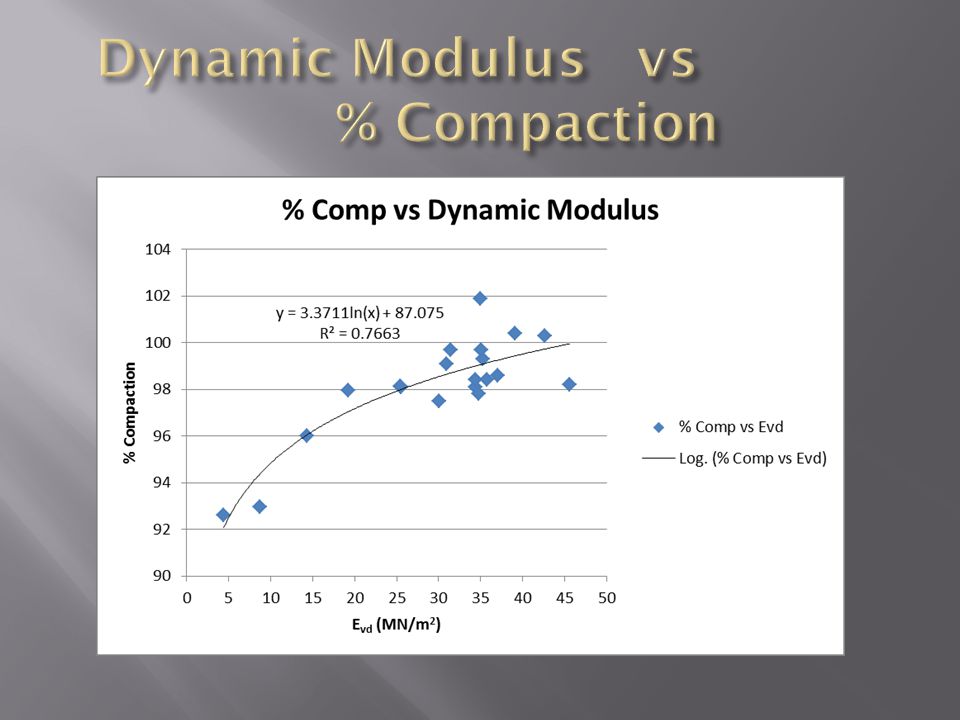
Recipe for Good Compaction Know Soil Type Moisture Control Limit Lift Thickness Compaction Testing Stiffness/ Strength of materials Target = Minimum Modulus or Maximum Deflection Based on Material Type Moisture Content May Require A Test Strip

39
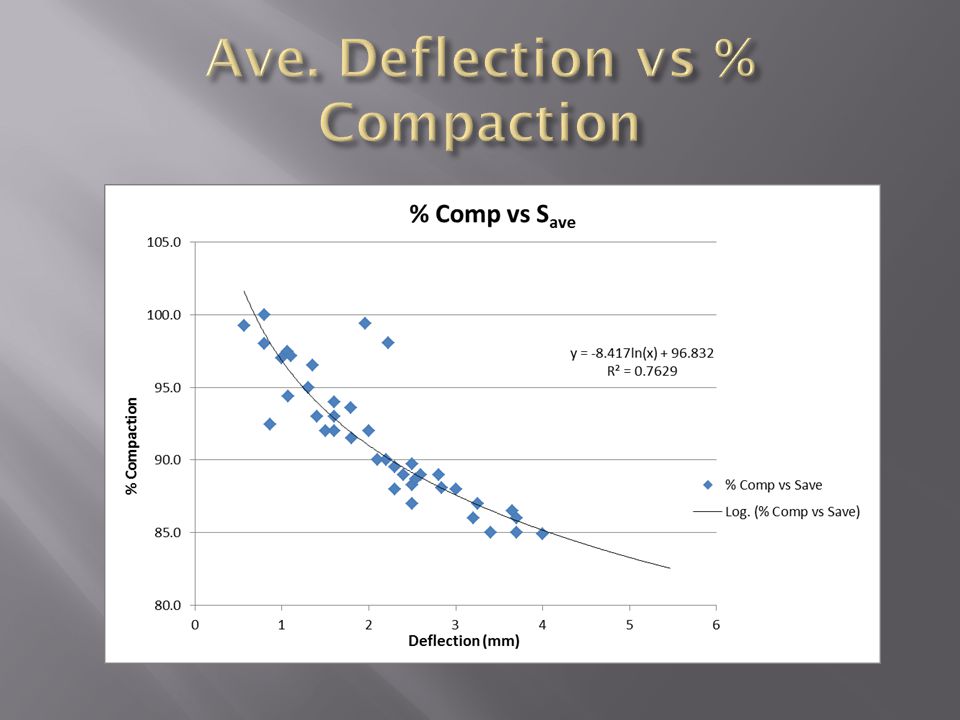
Side by Side LWD Tests & Nuke Tests Bag Samples for Lab Determine NGI & Moisture Compare Deflection vs % Compaction for each Soil Type (NGI)
")
40
PI= 20 LL = 45 % Ret.= 50 Chart 1 = 3.5 Chart 2 = 3.5 NGI = 7

44
Modulus in Laboratory is complicated, expensive, and time consuming. Test methods have continually changed over the years NDOR – Resilient Modulus Research based on Nebraska Soil Types (NGI) Correlate well with FWD Do not correlate with LWD
 Correlate well with FWD Do not correlate with LWD.")
45
Resilient Modulus Correlation to NGI

46
Deflection is easy to understand Two Specifications 1.Provide Target Value for each NGI 2. Perform Test Strip / Calibration Area

47
Maximum Deflection based on Nebraska Group Index (PI, LL, #200) First – Make sure moisture is within Spec. Refer to Chart for Deflection Requirements

48
1.2 Target Value = Max Deflection 1.2 mm For Equivalent to 95% Compaction

49
Nebraska Group Index Concrete Upper 3'Concrete Below 3'Asphalt Upper 3'Asphalt Below 3' Max Deflection (mm) -20.5 0.5 0 111.50.51.5 21 0.51.5 32313 42313 52313 62313 7 30.753 81.530.753 91.530.753 102414 112414 122414 132414 143525 153525 163525 174636 184636 195848 205848 215848 226959 236959 246959 NGI = 7 Under Concrete Top 3’ NGI = 7 Under Asphalt Below 3’
 NGI = 7 Under Concrete Top 3’ NGI = 7 Under Asphalt Below 3’")
50
Deflection Data for Soil Type not available Perform a Test Strip/ Calibration Area First Test Moisture Size of Test Strip – 200’ Length x Width of Embankment, Two-8” Lifts 3 LWD Tests/ Roller Pass – Random Locations

51
Continue LWD/ Roller Pass Testing Target Deflection Value Obtained when: Moisture Content Acceptable Range (based on PL or Standard Proctor) Average of Deflection Tests for three consecutive passes does not change significantly with each additional pass (when change is < 10%) Obtain Rep. Sample from test strip for further lab testing Passing Test = < 1.1 x Target Value

52
Re-Evaluate when: More than 20% of test measurements are less than 0.8 x TV Failing results consistently occur even though adequate compaction observed. Perform new Test Strip

53
Finalize and Implement Specifications Eliminate all Nuclear Gauges Build NGI Chart Find a reliable field moisture testing device

54
QUESTIONS?

Similar presentations


>")


 of representative samples or strength parameters or slope.>")

 n Longitudinal Joint Spec and other methods for longitudinal.>")


