Download presentation
Presentation is loading. Please wait.

1
Chronic fatigue with a gender- perspective in the Swedish Twin Registry; definitions and heterogeneity

2
Epidemiology of CF Prolonged fatigue, chronic fatigue, chronic fatigue-like illness, chronic fatigue syndrome

3
CFS 800.000 persons in the US Cost estimated to 9 billion dollars annually for loss of production alone

4
Why study chronic fatigue? More appropriate to ask why have we not studied it earlier? Sweden pay 12 billion Euro every year for people on sick-leave 62% of the working population are in the working-force, A majority of the rest are on sick-leave or in early retirement due to illness; fatigue is a major symptom in many of these illnesses and diseases.

5
STR STR= Swedish Twin Registry = the Swedish population A populationbased epidemiological study Funded by NIH and others

6
Two large population-based studies Chicago Illinois (Jason 1999, DePaul U.) 18675 telephone interviews ages 18 - >60 7,7% prolonged fatigue 4,2% chronic fatigue CFS-like group n= 408 Invitation to clinical evaluation n= 166 (41%) Estimated prevalence: 0,42% (CI 0,29 – 0,56) Gender-specific prevalence –Women: 0,522% –Men: 0,291%
 telephone interviews ages 18 - >60 7,7% prolonged fatigue 4,2% chronic fatigue CFS-like group n= 408 Invitation to clinical evaluation n= 166 (41%) Estimated prevalence: 0,42% (CI 0,29 – 0,56) Gender-specific prevalence –Women: 0,522% –Men: 0,291%")
7
Two large population-based studies Wichita Kansas (Reyes 2003, CDC) 7162 telephone interviews ages 18 – 69 9,4% prolonged fatigue CFS-like group n=555 Invitation to clinical evaluation n=299 (54%) Estimated prevalence: 0,235% (CI 0,14 – 0,32) Gender-specific prevalence: –Women 0,373% –Men 0,083%
 7162 telephone interviews ages 18 – 69 9,4% prolonged fatigue CFS-like group n=555 Invitation to clinical evaluation n=299 (54%) Estimated prevalence: 0,235% (CI 0,14 – 0,32) Gender-specific prevalence: –Women 0,373% –Men 0,083%")
8
One nation-wide study Iceland (Lindal 2002) Only telephone interview n= 2471 Using criteria by Fukuda 1994 Estimated prevalence: 1,4% Gender-specific prevalence: –Women:1,0% –Men:0,3%
 Only telephone interview n= 2471 Using criteria by Fukuda 1994 Estimated prevalence: 1,4% Gender-specific prevalence: –Women:1,0% –Men:0,3%")
9
The Swedish Twin Registry 160 000 twins DZ / MZ ~ 1,5

10
The STR - CFS study SALT Screening Across the Lifespan Twin study 1998 – 2002: telephone interview Ages 42 – 64 years (born 1935 – 1958) Questions regarding Chronic Fatigue: –”Have you felt abnormally tired during the last six months?” –Duration, impairment (too tired to live a normal life), work incapacity –Occurence of 8 symptoms defining CFS
 Questions regarding Chronic Fatigue: – Have you felt abnormally tired during the last six months –Duration, impairment (too tired to live a normal life), work incapacity –Occurence of 8 symptoms defining CFS")
11
The STR – CFS study 41,499 individual twins eligible for interview 31,406 individuals responded (75,7%) 12,407 complete twin pairs
 12,407 complete twin pairs")
12
The STR – CFS study All responsive to fatigue question: –6,571 = 20,92% Prolonged fatigue (> 1 month): –3,826 = 12,33% CF-A (> 6 months): –2,564 = 8,26% CF-B (6 months + impairment): –1,823 = 5,87% CF-C (6 months, imp. + 4/8 symptoms): –732 = 2,36%
: –732 = 2,36%.")
13
Individual twins eligible for CFS screening interview (N=41,499) Participants, fatigue evaluated by interview (N=31,406, 75.68%) Non-responders (N=10,093, 24.32%) Predictors of participation: - Monozygous twin (OR=1.68, p<.0001) - Eligible co-twin (OR=1.44, p<.0001) - Female gender (OR=1.39, p<.0001) - Fewer hospitalizations (OR=1.18, p<.0001) - Age (OR=1.007, p=0.0001, but R 2 =0.0002) - In cancer registry (OR=1.01, NS) Denied stem question (N=24,467, 77.91%) Missing data (N=368, 1.17%) Fatigue (N=6,571, 20.92%) Prolonged Fatigue (N=3,826, 12.33%) CF-A (add ¡Ã6 months) (N=2,564, 8.26%) CF-B (add impairment) (N=1,823, 5.87%) CF-C (add 4 symptoms) (N=732, 2.36%) Details Figure 1 Fatigue (remove exclusions) (N=5,330, 17.17%)
 Participants, fatigue evaluated by interview (N=31,406, 75.68%) Non-responders (N=10,093, 24.32%) Predictors of participation: - Monozygous twin (OR=1.68, p<.0001) - Eligible co-twin (OR=1.44, p<.0001) - Female gender (OR=1.39, p<.0001) - Fewer hospitalizations (OR=1.18, p<.0001) - Age (OR=1.007, p=0.0001, but R 2 =0.0002) - In cancer registry (OR=1.01, NS) Denied stem question (N=24,467, 77.91%) Missing data (N=368, 1.17%) Fatigue (N=6,571, 20.92%) Prolonged Fatigue (N=3,826, 12.33%) CF-A (add ¡Ã6 months) (N=2,564, 8.26%) CF-B (add impairment) (N=1,823, 5.87%) CF-C (add 4 symptoms) (N=732, 2.36%) Details Figure 1 Fatigue (remove exclusions) (N=5,330, 17.17%)")
14
Epidemiological conclusions The six-month prevalence of CFS-like illness was 2.36% Markedly higher in women No association with age No association with education No assocation with occupation-analysis of the gender-divided workingmarket

15
Cases of prolonged fatigue -history, physical exam -Mental status -Routine tests (biochemical, microbiological Exclusion CFS case: -Severe fatigue: new/definitive onset -6 months -Not alleviated by rest -Reduction in activities -4/8 symptoms: -Impaired memory/concentration -Sore throat -Tender lymph nodes -Muscle pain -Multi-joint pain -New headaches -Unrefreshing sleep -Post-exertional malaise Idiopathic chronic fatigue: If fatigue severity or symptom criteria not met.

16
Symptoms in Fatigued subjects 5,330 fatigued twins, women 64,17% Mean number of symptoms: 2,4 Median: 2,0 Most common symptoms: –Unrefreshing sleep (79,9%) –Memory impairment (48,5%) –Muscle pain (37,3%) –Joint pain (28,3%)
 –Memory impairment (48,5%) –Muscle pain (37,3%) –Joint pain (28,3%)")
17
Symptoms in Fatigued subjects 5,330 fatigued twins, women 64,17% Mean number of symptoms: 2,4 Median: 2,0 Least common symptoms: –Tender lymph nodes (6,9%) –Headaches (11,1%) –Sore throat (12,0%) –Post-exertional malaise (15,8%)
 –Headaches (11,1%) –Sore throat (12,0%) –Post-exertional malaise (15,8%)")
18
Figure 1: Trellis graph depicting the relationships with the 0, 1, 2, …, 8 cardinal CFS symptoms. Panel A shows the proportion of subjects. Panel B depicts the mean duration of fatigue in months. Panel C shows the proportion of females. Panels E through L depict the proportions of subjects with each of the individual symptoms. By definition, Panels E-L are fixed at 0% for zero total symptoms and 100% for eight total symptoms. A vertical reference line is shown at the CDC cut point between 3 and 4 total symptoms.

19
Symptoms counted Almost linear progression in number of symptoms with duration of disease No clear cut-point between 3 and 4 symptoms Using logistic regression, which symptoms will help define the most stringent definition of fatigue?

20
1 0 ∞ OR < 1 protective OR = 1 No risk OR > 1 Riskfactor Risk: 0 – 1. If disease rare, OR = RR

21
Logistic regression Memory deterioration: –OR 1,76 in prolonged fatigue, OR 11,3 in CF-C Muscle pain: –OR 1,38 in PF, OR 8,92 in CF-C Joint pain: –OR 1,64 in PF, OR 7,54 in CF-C Lymph nodes, headache: –OR starting < 1,0 Sore throat: –OR 0,70 in PF, OR 0,71 in CF-B, OR 1,47 in CF-C

23
Logistic regression The 8 symptoms not equivalent in predicting fatigue classification Prevalence figures from interview –Tender lymph nodes 7% –Unrefreshing sleep 80% Maybe symptoms should be dropped and focus put on duration, impairment ?

24
Latent class analysis Mathematical modelling Finds hidden patterns Within each latent class, each variable is independent of every other variable If latent class effect is removed, only effect of randomness remains

25
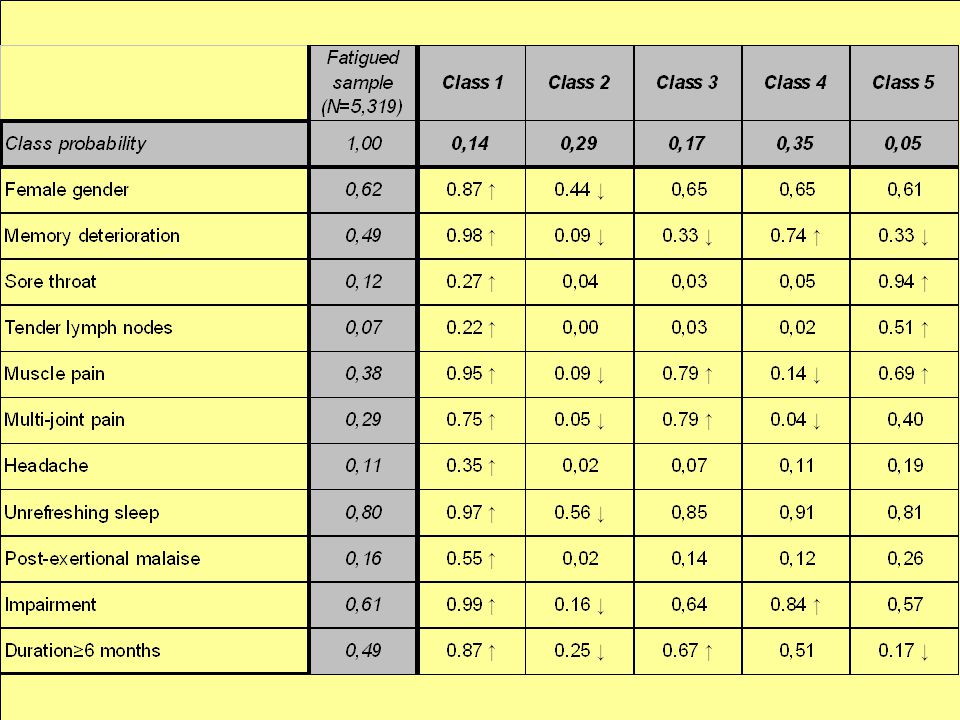
Latent class analysis in CFS 11 dichotomous items entered: –Gender –Impairment –Duration +/- 6 months –All the 8 symptoms Theoretical number of patterns: 2048 Observed number: 679 With 5 classes, all cases will fit

27
Latent classes Class 1: 87% women, high endorsement of the 8 symptoms, depression, CWP. Most in this class fitted into CF-C (86%) –CFS-like class
 –CFS-like class.")
28
Latent classes Class 1: 87% women, high endorsement of the 8 symptoms, depression, CWP. Most in this class fitted into CF-C (86%) –CFS-like class Class 2: 44% women, few symptoms –Residual class
 –CFS-like class Class 2: 44% women, few symptoms –Residual class.")
29
Latent classes Class 1: 87% women, high endorsement of the 8 symptoms, depression, CWP. Most in this class fitted into CF-C (86%) –CFS-like class Class 2: 44% women, few symptoms –Residual class Class 3: 65% women, muscle & joint pain, low occurence of true CF-C (11%) –Rheumatic class
 –CFS-like class Class 2: 44% women, few symptoms –Residual class Class 3: 65% women, muscle & joint pain, low occurence of true CF-C (11%) –Rheumatic class.")
30
Class 4: 65% women, memory deterioration, 44% depressed –Depressive class

31
Class 5: 61% women, shorter duration, sore throat –Acute Physical syndrome Class 4: 65% women, memory deterioration, 44% depressed –Depressive class

32
Class 1: 87% women, high endorsement of the 8 symptoms, depression, CWP. Most in this class fitted into CF-C (86%) –CFS-like class Class 2: 44% women, few symptoms –Residual class Class 3: 65% women, muscle & joint pain, low occurence of true CF-C (11%) –Rheumatic class Class 4: 65% women, memory deterioration, 44% depressed –Depressive class Class 5: 61% women, shorter duration, sore throat –Acute Physical syndrome
 –CFS-like class Class 2: 44% women, few symptoms –Residual class Class 3: 65% women, muscle & joint pain, low occurence of true CF-C (11%) –Rheumatic class Class 4: 65% women, memory deterioration, 44% depressed –Depressive class Class 5: 61% women, shorter duration, sore throat –Acute Physical syndrome.")
34
Latent classes The traits presented in the differented classes illustrate the heterogeneity of chronic fatigue Class 1 CFS –like? Class 3 & 4 common complaints in this age group Class 5 viral infections? implications for how surveys are conducted (acute physical syndrome will tend to resolve)
.")
35
Ongoing studies Twin statistics for genetic and environmental influence Molecular epidemiology; genomics and proteomics in monozygotic twins Early life events PET-studies

36
Issues Sex and Gender Biological differences Genetic differences Environmental differences Physical, Social, Psychological Integrative approach needed!

37
This illness is costly for society Should have an adequate part of R&D

38
Fatigue in the Swedish Twin Registry Nancy Pedersen, prof, head of STR at KI Birgitta Evengård, assoc prof, MD, KI Andreas Jacks, MD, KI Kenji Kato, KI Patrick Sullivan, prof, MD, Univ North Carolina

39
Heritability All possible combinations of symptoms 1x1... 8x8, total 255 Assessed for female-female and male-male pairs Possible feature of interest: –Multi-joint pain in females and males –Sore-throat – lymph nodes headaches in males

40
Female-female twin pairs Figure 2: Depicted are the estimated heritabilities for all possible combinations of items. Panel A shows data for female-female twin pairs and Panel B shows male-male twin pairs. Horizontal reference lines show the overall 75 th, 50 th, and 25 th percentiles for each gender.

41
Male-male twin pairs Figure 2: Depicted are the estimated heritabilities for all possible combinations of items. Panel A shows data for female-female twin pairs and Panel B shows male-male twin pairs. Horizontal reference lines show the overall 75 th, 50 th, and 25 th percentiles for each gender.

42
Female-female twin pairs Male-male twin pairs

43
Individual twins eligible for CFS screening interview (N=41,499) Figure 1
 Figure 1")
44
Individual twins eligible for CFS screening interview (N=41,499) Participants, fatigue evaluated by interview (N=31,406, 75.68%) Non-responders (N=10,093, 24.32%) Predictors of participation: - Monozygous twin (OR=1.68, p<.0001) - Eligible co-twin (OR=1.44, p<.0001) - Female gender (OR=1.39, p<.0001) - Fewer hospitalizations (OR=1.18, p<.0001) - Age (OR=1.007, p=0.0001, but R 2 =0.0002) - In cancer registry (OR=1.01, NS) Figure 1
 Participants, fatigue evaluated by interview (N=31,406, 75.68%) Non-responders (N=10,093, 24.32%) Predictors of participation: - Monozygous twin (OR=1.68, p<.0001) - Eligible co-twin (OR=1.44, p<.0001) - Female gender (OR=1.39, p<.0001) - Fewer hospitalizations (OR=1.18, p<.0001) - Age (OR=1.007, p=0.0001, but R 2 =0.0002) - In cancer registry (OR=1.01, NS) Figure 1")
45
Individual twins eligible for CFS screening interview (N=41,499) Participants, fatigue evaluated by interview (N=31,406, 75.68%) Non-responders (N=10,093, 24.32%) Predictors of participation: - Monozygous twin (OR=1.68, p<.0001) - Eligible co-twin (OR=1.44, p<.0001) - Female gender (OR=1.39, p<.0001) - Fewer hospitalizations (OR=1.18, p<.0001) - Age (OR=1.007, p=0.0001, but R 2 =0.0002) - In cancer registry (OR=1.01, NS) Denied stem question (N=24,467, 77.91%) Missing data (N=368, 1.17%) Figure 1
 Participants, fatigue evaluated by interview (N=31,406, 75.68%) Non-responders (N=10,093, 24.32%) Predictors of participation: - Monozygous twin (OR=1.68, p<.0001) - Eligible co-twin (OR=1.44, p<.0001) - Female gender (OR=1.39, p<.0001) - Fewer hospitalizations (OR=1.18, p<.0001) - Age (OR=1.007, p=0.0001, but R 2 =0.0002) - In cancer registry (OR=1.01, NS) Denied stem question (N=24,467, 77.91%) Missing data (N=368, 1.17%) Figure 1")
46
Individual twins eligible for CFS screening interview (N=41,499) Participants, fatigue evaluated by interview (N=31,406, 75.68%) Non-responders (N=10,093, 24.32%) Predictors of participation: - Monozygous twin (OR=1.68, p<.0001) - Eligible co-twin (OR=1.44, p<.0001) - Female gender (OR=1.39, p<.0001) - Fewer hospitalizations (OR=1.18, p<.0001) - Age (OR=1.007, p=0.0001, but R 2 =0.0002) - In cancer registry (OR=1.01, NS) Denied stem question (N=24,467, 77.91%) Missing data (N=368, 1.17%) Fatigue (N=6,571, 20.92%) Figure 1
 Participants, fatigue evaluated by interview (N=31,406, 75.68%) Non-responders (N=10,093, 24.32%) Predictors of participation: - Monozygous twin (OR=1.68, p<.0001) - Eligible co-twin (OR=1.44, p<.0001) - Female gender (OR=1.39, p<.0001) - Fewer hospitalizations (OR=1.18, p<.0001) - Age (OR=1.007, p=0.0001, but R 2 =0.0002) - In cancer registry (OR=1.01, NS) Denied stem question (N=24,467, 77.91%) Missing data (N=368, 1.17%) Fatigue (N=6,571, 20.92%) Figure 1")
47
Individual twins eligible for CFS screening interview (N=41,499) Participants, fatigue evaluated by interview (N=31,406, 75.68%) Non-responders (N=10,093, 24.32%) Predictors of participation: - Monozygous twin (OR=1.68, p<.0001) - Eligible co-twin (OR=1.44, p<.0001) - Female gender (OR=1.39, p<.0001) - Fewer hospitalizations (OR=1.18, p<.0001) - Age (OR=1.007, p=0.0001, but R 2 =0.0002) - In cancer registry (OR=1.01, NS) Denied stem question (N=24,467, 77.91%) Missing data (N=368, 1.17%) Fatigue (N=6,571, 20.92%) Details Figure 1 Fatigue (remove exclusions) (N=5,330, 17.17%)
 Participants, fatigue evaluated by interview (N=31,406, 75.68%) Non-responders (N=10,093, 24.32%) Predictors of participation: - Monozygous twin (OR=1.68, p<.0001) - Eligible co-twin (OR=1.44, p<.0001) - Female gender (OR=1.39, p<.0001) - Fewer hospitalizations (OR=1.18, p<.0001) - Age (OR=1.007, p=0.0001, but R 2 =0.0002) - In cancer registry (OR=1.01, NS) Denied stem question (N=24,467, 77.91%) Missing data (N=368, 1.17%) Fatigue (N=6,571, 20.92%) Details Figure 1 Fatigue (remove exclusions) (N=5,330, 17.17%)")
48
Individual twins eligible for CFS screening interview (N=41,499) Participants, fatigue evaluated by interview (N=31,406, 75.68%) Non-responders (N=10,093, 24.32%) Predictors of participation: - Monozygous twin (OR=1.68, p<.0001) - Eligible co-twin (OR=1.44, p<.0001) - Female gender (OR=1.39, p<.0001) - Fewer hospitalizations (OR=1.18, p<.0001) - Age (OR=1.007, p=0.0001, but R 2 =0.0002) - In cancer registry (OR=1.01, NS) Denied stem question (N=24,467, 77.91%) Missing data (N=368, 1.17%) Fatigue (N=6,571, 20.92%) Prolonged Fatigue (N=3,826, 12.33%) Details Figure 1 Fatigue (remove exclusions) (N=5,330, 17.17%)
 Participants, fatigue evaluated by interview (N=31,406, 75.68%) Non-responders (N=10,093, 24.32%) Predictors of participation: - Monozygous twin (OR=1.68, p<.0001) - Eligible co-twin (OR=1.44, p<.0001) - Female gender (OR=1.39, p<.0001) - Fewer hospitalizations (OR=1.18, p<.0001) - Age (OR=1.007, p=0.0001, but R 2 =0.0002) - In cancer registry (OR=1.01, NS) Denied stem question (N=24,467, 77.91%) Missing data (N=368, 1.17%) Fatigue (N=6,571, 20.92%) Prolonged Fatigue (N=3,826, 12.33%) Details Figure 1 Fatigue (remove exclusions) (N=5,330, 17.17%)")
49
Individual twins eligible for CFS screening interview (N=41,499) Participants, fatigue evaluated by interview (N=31,406, 75.68%) Non-responders (N=10,093, 24.32%) Predictors of participation: - Monozygous twin (OR=1.68, p<.0001) - Eligible co-twin (OR=1.44, p<.0001) - Female gender (OR=1.39, p<.0001) - Fewer hospitalizations (OR=1.18, p<.0001) - Age (OR=1.007, p=0.0001, but R 2 =0.0002) - In cancer registry (OR=1.01, NS) Denied stem question (N=24,467, 77.91%) Missing data (N=368, 1.17%) Fatigue (N=6,571, 20.92%) Prolonged Fatigue (N=3,826, 12.33%) Details Figure 1 Fatigue (remove exclusions) (N=5,330, 17.17%)
 Participants, fatigue evaluated by interview (N=31,406, 75.68%) Non-responders (N=10,093, 24.32%) Predictors of participation: - Monozygous twin (OR=1.68, p<.0001) - Eligible co-twin (OR=1.44, p<.0001) - Female gender (OR=1.39, p<.0001) - Fewer hospitalizations (OR=1.18, p<.0001) - Age (OR=1.007, p=0.0001, but R 2 =0.0002) - In cancer registry (OR=1.01, NS) Denied stem question (N=24,467, 77.91%) Missing data (N=368, 1.17%) Fatigue (N=6,571, 20.92%) Prolonged Fatigue (N=3,826, 12.33%) Details Figure 1 Fatigue (remove exclusions) (N=5,330, 17.17%)")
50
Individual twins eligible for CFS screening interview (N=41,499) Participants, fatigue evaluated by interview (N=31,406, 75.68%) Non-responders (N=10,093, 24.32%) Predictors of participation: - Monozygous twin (OR=1.68, p<.0001) - Eligible co-twin (OR=1.44, p<.0001) - Female gender (OR=1.39, p<.0001) - Fewer hospitalizations (OR=1.18, p<.0001) - Age (OR=1.007, p=0.0001, but R 2 =0.0002) - In cancer registry (OR=1.01, NS) Denied stem question (N=24,467, 77.91%) Missing data (N=368, 1.17%) Fatigue (N=6,571, 20.92%) Prolonged Fatigue (N=3,826, 12.33%) CF-A (add ¡Ã6 months) (N=2,564, 8.26%) Details Figure 1 Fatigue (remove exclusions) (N=5,330, 17.17%)
 Participants, fatigue evaluated by interview (N=31,406, 75.68%) Non-responders (N=10,093, 24.32%) Predictors of participation: - Monozygous twin (OR=1.68, p<.0001) - Eligible co-twin (OR=1.44, p<.0001) - Female gender (OR=1.39, p<.0001) - Fewer hospitalizations (OR=1.18, p<.0001) - Age (OR=1.007, p=0.0001, but R 2 =0.0002) - In cancer registry (OR=1.01, NS) Denied stem question (N=24,467, 77.91%) Missing data (N=368, 1.17%) Fatigue (N=6,571, 20.92%) Prolonged Fatigue (N=3,826, 12.33%) CF-A (add ¡Ã6 months) (N=2,564, 8.26%) Details Figure 1 Fatigue (remove exclusions) (N=5,330, 17.17%)")
51
Individual twins eligible for CFS screening interview (N=41,499) Participants, fatigue evaluated by interview (N=31,406, 75.68%) Non-responders (N=10,093, 24.32%) Predictors of participation: - Monozygous twin (OR=1.68, p<.0001) - Eligible co-twin (OR=1.44, p<.0001) - Female gender (OR=1.39, p<.0001) - Fewer hospitalizations (OR=1.18, p<.0001) - Age (OR=1.007, p=0.0001, but R 2 =0.0002) - In cancer registry (OR=1.01, NS) Denied stem question (N=24,467, 77.91%) Missing data (N=368, 1.17%) Fatigue (N=6,571, 20.92%) Prolonged Fatigue (N=3,826, 12.33%) CF-A (add ¡Ã6 months) (N=2,564, 8.26%) Details Figure 1 Fatigue (remove exclusions) (N=5,330, 17.17%)
 Participants, fatigue evaluated by interview (N=31,406, 75.68%) Non-responders (N=10,093, 24.32%) Predictors of participation: - Monozygous twin (OR=1.68, p<.0001) - Eligible co-twin (OR=1.44, p<.0001) - Female gender (OR=1.39, p<.0001) - Fewer hospitalizations (OR=1.18, p<.0001) - Age (OR=1.007, p=0.0001, but R 2 =0.0002) - In cancer registry (OR=1.01, NS) Denied stem question (N=24,467, 77.91%) Missing data (N=368, 1.17%) Fatigue (N=6,571, 20.92%) Prolonged Fatigue (N=3,826, 12.33%) CF-A (add ¡Ã6 months) (N=2,564, 8.26%) Details Figure 1 Fatigue (remove exclusions) (N=5,330, 17.17%)")
52
Individual twins eligible for CFS screening interview (N=41,499) Participants, fatigue evaluated by interview (N=31,406, 75.68%) Non-responders (N=10,093, 24.32%) Predictors of participation: - Monozygous twin (OR=1.68, p<.0001) - Eligible co-twin (OR=1.44, p<.0001) - Female gender (OR=1.39, p<.0001) - Fewer hospitalizations (OR=1.18, p<.0001) - Age (OR=1.007, p=0.0001, but R 2 =0.0002) - In cancer registry (OR=1.01, NS) Denied stem question (N=24,467, 77.91%) Missing data (N=368, 1.17%) Fatigue (N=6,571, 20.92%) Prolonged Fatigue (N=3,826, 12.33%) CF-A (add ¡Ã6 months) (N=2,564, 8.26%) CF-B (add impairment) (N=1,823, 5.87%) Details Figure 1 Fatigue (remove exclusions) (N=5,330, 17.17%)
 Participants, fatigue evaluated by interview (N=31,406, 75.68%) Non-responders (N=10,093, 24.32%) Predictors of participation: - Monozygous twin (OR=1.68, p<.0001) - Eligible co-twin (OR=1.44, p<.0001) - Female gender (OR=1.39, p<.0001) - Fewer hospitalizations (OR=1.18, p<.0001) - Age (OR=1.007, p=0.0001, but R 2 =0.0002) - In cancer registry (OR=1.01, NS) Denied stem question (N=24,467, 77.91%) Missing data (N=368, 1.17%) Fatigue (N=6,571, 20.92%) Prolonged Fatigue (N=3,826, 12.33%) CF-A (add ¡Ã6 months) (N=2,564, 8.26%) CF-B (add impairment) (N=1,823, 5.87%) Details Figure 1 Fatigue (remove exclusions) (N=5,330, 17.17%)")
53
Individual twins eligible for CFS screening interview (N=41,499) Participants, fatigue evaluated by interview (N=31,406, 75.68%) Non-responders (N=10,093, 24.32%) Predictors of participation: - Monozygous twin (OR=1.68, p<.0001) - Eligible co-twin (OR=1.44, p<.0001) - Female gender (OR=1.39, p<.0001) - Fewer hospitalizations (OR=1.18, p<.0001) - Age (OR=1.007, p=0.0001, but R 2 =0.0002) - In cancer registry (OR=1.01, NS) Denied stem question (N=24,467, 77.91%) Missing data (N=368, 1.17%) Fatigue (N=6,571, 20.92%) Prolonged Fatigue (N=3,826, 12.33%) CF-A (add ¡Ã6 months) (N=2,564, 8.26%) CF-B (add impairment) (N=1,823, 5.87%) Details Figure 1 Fatigue (remove exclusions) (N=5,330, 17.17%)
 Participants, fatigue evaluated by interview (N=31,406, 75.68%) Non-responders (N=10,093, 24.32%) Predictors of participation: - Monozygous twin (OR=1.68, p<.0001) - Eligible co-twin (OR=1.44, p<.0001) - Female gender (OR=1.39, p<.0001) - Fewer hospitalizations (OR=1.18, p<.0001) - Age (OR=1.007, p=0.0001, but R 2 =0.0002) - In cancer registry (OR=1.01, NS) Denied stem question (N=24,467, 77.91%) Missing data (N=368, 1.17%) Fatigue (N=6,571, 20.92%) Prolonged Fatigue (N=3,826, 12.33%) CF-A (add ¡Ã6 months) (N=2,564, 8.26%) CF-B (add impairment) (N=1,823, 5.87%) Details Figure 1 Fatigue (remove exclusions) (N=5,330, 17.17%)")
54
Individual twins eligible for CFS screening interview (N=41,499) Participants, fatigue evaluated by interview (N=31,406, 75.68%) Non-responders (N=10,093, 24.32%) Predictors of participation: - Monozygous twin (OR=1.68, p<.0001) - Eligible co-twin (OR=1.44, p<.0001) - Female gender (OR=1.39, p<.0001) - Fewer hospitalizations (OR=1.18, p<.0001) - Age (OR=1.007, p=0.0001, but R 2 =0.0002) - In cancer registry (OR=1.01, NS) Denied stem question (N=24,467, 77.91%) Missing data (N=368, 1.17%) Fatigue (N=6,571, 20.92%) Prolonged Fatigue (N=3,826, 12.33%) CF-A (add ¡Ã6 months) (N=2,564, 8.26%) CF-B (add impairment) (N=1,823, 5.87%) CF-C (add 4 symptoms) (N=732, 2.36%) Details Figure 1 Fatigue (remove exclusions) (N=5,330, 17.17%)
 Participants, fatigue evaluated by interview (N=31,406, 75.68%) Non-responders (N=10,093, 24.32%) Predictors of participation: - Monozygous twin (OR=1.68, p<.0001) - Eligible co-twin (OR=1.44, p<.0001) - Female gender (OR=1.39, p<.0001) - Fewer hospitalizations (OR=1.18, p<.0001) - Age (OR=1.007, p=0.0001, but R 2 =0.0002) - In cancer registry (OR=1.01, NS) Denied stem question (N=24,467, 77.91%) Missing data (N=368, 1.17%) Fatigue (N=6,571, 20.92%) Prolonged Fatigue (N=3,826, 12.33%) CF-A (add ¡Ã6 months) (N=2,564, 8.26%) CF-B (add impairment) (N=1,823, 5.87%) CF-C (add 4 symptoms) (N=732, 2.36%) Details Figure 1 Fatigue (remove exclusions) (N=5,330, 17.17%)")
55
Individual twins eligible for CFS screening interview (N=41,499) Participants, fatigue evaluated by interview (N=31,406, 75.68%) Non-responders (N=10,093, 24.32%) Predictors of participation: - Monozygous twin (OR=1.68, p<.0001) - Eligible co-twin (OR=1.44, p<.0001) - Female gender (OR=1.39, p<.0001) - Fewer hospitalizations (OR=1.18, p<.0001) - Age (OR=1.007, p=0.0001, but R 2 =0.0002) - In cancer registry (OR=1.01, NS) Denied stem question (N=24,467, 77.91%) Missing data (N=368, 1.17%) Fatigue (N=6,571, 20.92%) Prolonged Fatigue (N=3,826, 12.33%) CF-A (add ¡Ã6 months) (N=2,564, 8.26%) CF-B (add impairment) (N=1,823, 5.87%) CF-C (add 4 symptoms) (N=732, 2.36%) Details Figure 1 Fatigue (remove exclusions) (N=5,330, 17.17%)
 Participants, fatigue evaluated by interview (N=31,406, 75.68%) Non-responders (N=10,093, 24.32%) Predictors of participation: - Monozygous twin (OR=1.68, p<.0001) - Eligible co-twin (OR=1.44, p<.0001) - Female gender (OR=1.39, p<.0001) - Fewer hospitalizations (OR=1.18, p<.0001) - Age (OR=1.007, p=0.0001, but R 2 =0.0002) - In cancer registry (OR=1.01, NS) Denied stem question (N=24,467, 77.91%) Missing data (N=368, 1.17%) Fatigue (N=6,571, 20.92%) Prolonged Fatigue (N=3,826, 12.33%) CF-A (add ¡Ã6 months) (N=2,564, 8.26%) CF-B (add impairment) (N=1,823, 5.87%) CF-C (add 4 symptoms) (N=732, 2.36%) Details Figure 1 Fatigue (remove exclusions) (N=5,330, 17.17%)")
56
Clinical study phase 732 twins with Chronic Fatigue CF-C MZ twins discordant for fatigue: –N = 235 Invitation letter Telephone interview Clinical visit for correct diagnosis, detecting exclusionary diagnosis –N = 110 Biological sampling – routine Biological sampling - research

58
Latent classes Class 1: 87% women, high endorsement of the 8 symptoms, depression, CWP. Most in this class fitted into CF-C (86%)
.")
59
Latent classes Class 1: 87% women, high endorsement of the 8 symptoms, depression, CWP. Most in this class fitted into CF-C (86%) –CFS-like class Class 2: 44% women, few symptoms
 –CFS-like class Class 2: 44% women, few symptoms.")
60
Latent classes Class 1: 87% women, high endorsement of the 8 symptoms, depression, CWP. Most in this class fitted into CF-C (86%) –CFS-like class Class 2: 44% women, few symptoms –Residual class Class 3: 65% women, muscle & joint pain, low occurence of true CF-C (11%)
 –CFS-like class Class 2: 44% women, few symptoms –Residual class Class 3: 65% women, muscle & joint pain, low occurence of true CF-C (11%).")
61
Latent classes Class 1: 87% women, high endorsement of the 8 symptoms, depression, CWP. Most in this class fitted into CF-C (86%) –CFS-like class Class 2: 44% women, few symptoms –Residual class Class 3: 65% women, muscle & joint pain, low occurence of true CF-C (11%) –Rheumatic class Class 4: 65% women, memory deterioration, 44% depressed
 –CFS-like class Class 2: 44% women, few symptoms –Residual class Class 3: 65% women, muscle & joint pain, low occurence of true CF-C (11%) –Rheumatic class Class 4: 65% women, memory deterioration, 44% depressed.")
62
Latent classes Class 1: 87% women, high endorsement of the 8 symptoms, depression, CWP. Most in this class fitted into CF-C (86%) –CFS-like class Class 2: 44% women, few symptoms –Residual class Class 3: 65% women, muscle & joint pain, low occurence of true CF-C (11%) –Rheumatic class Class 4: 65% women, memory deterioration, 44% depressed –Depressive class
 –CFS-like class Class 2: 44% women, few symptoms –Residual class Class 3: 65% women, muscle & joint pain, low occurence of true CF-C (11%) –Rheumatic class Class 4: 65% women, memory deterioration, 44% depressed –Depressive class.")
63
Latent classes Class 1: 87% women, high endorsement of the 8 symptoms, depression, CWP. Most in this class fitted into CF-C (86%) –CFS-like class Class 2: 44% women, few symptoms –Residual class Class 3: 65% women, muscle & joint pain, low occurence of true CF-C (11%) –Rheumatic class Class 4: 65% women, memory deterioration, 44% depressed –Depressive class
 –CFS-like class Class 2: 44% women, few symptoms –Residual class Class 3: 65% women, muscle & joint pain, low occurence of true CF-C (11%) –Rheumatic class Class 4: 65% women, memory deterioration, 44% depressed –Depressive class.")
64
Latent classes Class 1: 87% women, high endorsement of the 8 symptoms, depression, CWP. Most in this class fitted into CF-C (86%) –CFS-like class Class 2: 44% women, few symptoms –Residual class Class 3: 65% women, muscle & joint pain, low occurence of true CF-C (11%) –Rheumatic class Class 4: 65% women, memory deterioration, 44% depressed –Depressive class Class 5: 61% women, shorter duration, sore throat
 –CFS-like class Class 2: 44% women, few symptoms –Residual class Class 3: 65% women, muscle & joint pain, low occurence of true CF-C (11%) –Rheumatic class Class 4: 65% women, memory deterioration, 44% depressed –Depressive class Class 5: 61% women, shorter duration, sore throat.")
65
Different study types Population-based surveys –Questionnaires2-3 % –Telephone interview0,007 – 0,23% –+/- clinical ascertainment Specialist centres (referred patients) –0,04 – 2,6% Unique cohorts –twin registries –Occupational medicine etc
 –0,04 – 2,6% Unique cohorts –twin registries –Occupational medicine etc")
66
Figure 2: Six month prevalence of fatigue-related definitions of increasing severity. The y-axis shows the current prevalence of each definition, and the x-axis contains five definitions of fatigue-related illness of increasing stringency and similarity to CFS. Shown are the prevalences overall and by gender as proportions of the sample. Filled circles show the estimates and the vertical bars depict asymptotic 95% confidence intervals. A line connects the overall prevalence estimates; all estimates for males are below and estimates for females above this line.

67
Figure 1: Trellis graph depicting the relationships with the 0, 1, 2, …, 8 cardinal CFS symptoms. Panel A shows the proportion of subjects. Panel B depicts the mean duration of fatigue in months. Panel C shows the proportion of females. Panels E through L depict the proportions of subjects with each of the individual symptoms. By definition, Panels E-L are fixed at 0% for zero total symptoms and 100% for eight total symptoms. A vertical reference line is shown at the CDC cut point between 3 and 4 total symptoms.

Similar presentations


 Richard M. Dubinsky, MD; Anthony C. Stein, PhD; and Kelly Lyons,>")
. What is a cohort?>")


 DIAGNOSTIC AND ASSESSMENT ISSUES.>")


 Prevalence in an Outpatient Psychiatry Clinic LH Bachmann 1,2, J Feldman 1, Y Waithaka 1.>")


 is related to increased fatigue, decreased health status, and increased mortality. Studies with.>")