Download presentation
Presentation is loading. Please wait.

1
Lorraine Dearden Director ADMIN Institute of Education Email: l.dearden@ioe.ac.uk NILS Research Forum Belfast 22 October 2010

2
Introduction In current economic climate, using and linking administrative data very important for policy analysis Scope for well funded longitudinal surveys going to be put under pressure Also, for countries like NI, sample sizes in survey data not always satisfactory NILS is a very welcome addition for researchers Indeed colleagues at ADMIN using it to look at issues do to with health and migration But limited in scope as to what issues you can use it for and could be significantly enhanced with other administrative data

3
Why so important to make better use of Administrative Data? Administrative data has already been collected for administrative purposes so money spent But the potential it gives for those interested in making sound policy advice immense if used correctly Allows one to potentially follow multiple cohorts over time (longitudinal data) which is something survey data can rarely do Sample size issues disappear in general which is very important when doing within country analysis
 which is something survey data can rarely do Sample size issues disappear in general which is very important when doing within country analysis.")
4
So why hasn’t it happened? Fears over data protection... But this is always issue when any individual level data and the instances of researchers inappropriately using data virtually unheard of The individual level data is highly disclosive but researchers never look at nor report anything that is disclosive But is essential that this information is in their data at the individual level Major issues around disclosure and data protection have been centred around agencies holding the administrative data

5
So how far have we got on this? Have various LS with Scotland the most advanced in terms of linkage (including linkage to schools data) Serious discussions in government about whether Censuses could be replaced by linking administrative data So politicians and policy makers are talking about it Certain departments in Whitehall have started linking administrative data sets for internal use (ONS) whereas others have linked data for research projects for them (e.g. DWP) and yet others for general research purposes (DfE and BIS)
 Serious discussions in government about whether Censuses could be replaced by linking administrative data So politicians and policy makers are talking about it Certain departments in Whitehall have started linking administrative data sets for internal use (ONS) whereas others have linked data for research projects for them (e.g. DWP) and yet others for general research purposes (DfE and BIS).")
6
Another important development There is increasing linkage of survey data to Administrative data where consent has been obtained from the individuals in the survey Longitudinal Survey of Young People in England (linked to NPD data) MCS (and ALSPAC) linked to hospital registration data, NPD data and now have permissions to link to Hospital Episodes Data, Economic Data held by DWP and HMRC (for both parents) as well as NPD data for all siblings of CM ELSA has linked to health and economic data and NCDS and MCS are about to do this as well Innovation Panel of Understanding Society will do this in a few years with hope of rolling it out to full sample
 MCS (and ALSPAC) linked to hospital registration data, NPD data and now have permissions to link to Hospital Episodes Data, Economic Data held by DWP and HMRC (for both parents) as well as NPD data for all siblings of CM ELSA has linked to health and economic data and NCDS and MCS are about to do this as well Innovation Panel of Understanding Society will do this in a few years with hope of rolling it out to full sample")
7
Why is this important? New linked admin/longitudinal data has potential to: Get a better understanding of the implications of missing covariates in administrative which is crucial if we are going to rely more on administrative data linkage Get a better understanding of implications of attrition and non-response in survey data Allow us to understand the implications and extent or recall bias in surveys…… Reduce the costs of longitudinal survey data

8
So what administrative data is there? Some, like data on school children, is country specific Others like HESA (Higher Education), DWP and HMRC data covers all of Great Britain Now going to talk a bit about what is out there in terms of administrative data...
, DWP and HMRC data covers all of Great Britain Now going to talk a bit about what is out there in terms of administrative data....")
9
New longitudinal HE admin data Linked individual-level administrative data School (NPD), FE (ILR/NISVQ) and HE (HESA) records Data on participants AND non-participants in HE Four cohorts: In Year 11 in 2001-02, 2002-03, 2003-04 and 2005-05 Potential age 18/19 HE entry in 2004-05, 2005-06, 2006- 07, 2007-08 or (age 19/20 entry 2005-06, 2006-07 and 2007-08) State and private school students
, FE (ILR/NISVQ) and HE (HESA) records Data on participants AND non-participants in HE Four cohorts: In Year 11 in , , and Potential age 18/19 HE entry in , , , or (age 19/20 entry , and ) State and private school students")
10
Data Socio-economic background Free school meals status from PLASC IMD quintiles based on home postcode (age 16) Gender, MOB and school ID available for all Ethnicity, EAL, SEN from PLASC Missing for private school kids Neighbourhood measure of parental education based on 2001 Census Based on home postcode for state school analysis Based on school postcode when include private school kids
 Gender, MOB and school ID available for all Ethnicity, EAL, SEN from PLASC Missing for private school kids Neighbourhood measure of parental education based on 2001 Census Based on home postcode for state school analysis Based on school postcode when include private school kids")
11
Data Prior attainment State school : Average point score at Key Stage 2, 3, 4 and 5 (plus indicators of reaching expected level at Key Stage 4 and 5) Private school : Key Stage 4 and 5 results only
 Private school : Key Stage 4 and 5 results only")
12
Integrated administrative data set School data Census of school children with individual characteristics of all pupils e.g. gender, ethnicity Prior achievement from age 11 through to 18 Individual Learner Record FE college attended Participation and qualifications achieved Higher Education data Detailed information on degree subject, institution, degree class awarded for all those participating in HE

13
Destinations of Leavers from Higher Education survey (DLHE) Early DHLE Survey (surveys graduates 6 months out of university) – only preliminary snapshot of graduate success In 2006, HESA carried out a follow up to the Early DHLE Survey → Longitudinal DLHE – 3 years after graduation Contains full details of HE plus wages / occupation 3 years after graduation
 Early DHLE Survey (surveys graduates 6 months out of university) – only preliminary snapshot of graduate success In 2006, HESA carried out a follow up to the Early DHLE Survey → Longitudinal DLHE – 3 years after graduation Contains full details of HE plus wages / occupation 3 years after graduation")
14
Longitudinal DLHE Can tell us early value of degrees By subject By institution Possibly by subject and institution (subject to sample size) Data essentially owned by universities so would need their permission to do this
 Data essentially owned by universities so would need their permission to do this")
15
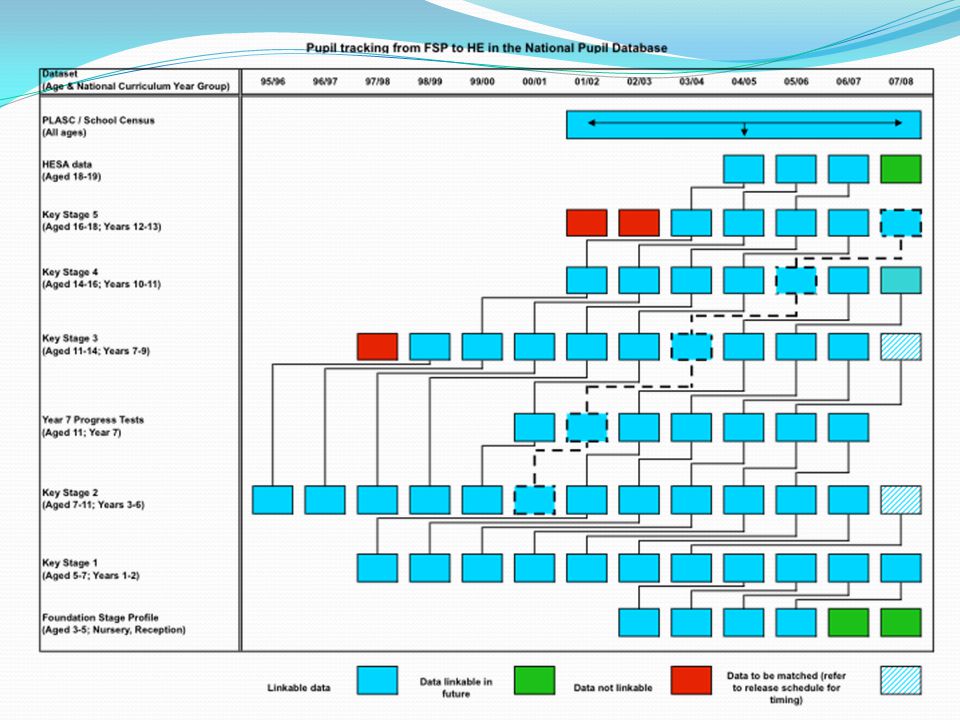
What data is included within NPD? Key Stage 1 Results Keys: PupilID, Academic Year, Lea/Estab Key Stage 2 Results Keys: PupilID, Academic Year, Lea/Estab Key Stage 3 Results Keys: PupilID, Academic Year, Lea/Estab Key Stage 4 Candidate Keys: PupilID, Academic Year, Lea/Estab Key Stage 5 Candidate Keys: PupilID, Academic Year, Lea/Estab Foundation Stage Profile Keys: PupilID, Academic Year, Lea/Estab Schools census (formally PLASC) Keys: PupilID, Academic Year, Lea/Estab, Pupil postcode Key Stage 4 Results Key Stage 4 Indicators Key Stage 5 Indicators Key Stage 5 Results Information Learner Record - Aims Keys: PupilID, Academic Year, Lea/Estab Year 7 Progress Test Results Keys: PupilID, Academic Year, Lea/Estab Core Pupil Keys: PupilID, Academic Year, Lea/Estab, Pupil postcode
 Keys: PupilID, Academic Year, Lea/Estab, Pupil postcode Key Stage 4 Results Key Stage 4 Indicators Key Stage 5 Indicators Key Stage 5 Results Information Learner Record - Aims Keys: PupilID, Academic Year, Lea/Estab Year 7 Progress Test Results Keys: PupilID, Academic Year, Lea/Estab Core Pupil Keys: PupilID, Academic Year, Lea/Estab, Pupil postcode.")
17
Main fixed pupil characteristics from School Census Main indicators: Sex of child Age (month of birth is standard release) Ethnic group English as an additional language Are they time-invariant? We might collect several measures of each, e.g. one from each of KS4, KS2, KS1 sweeps and also up to nine years of Pupil Census reports from schools We think of these characteristics as fairly time-invariant, yet they vary for a tiny minority of children You can place greatest weight on most recent reports, or alternatively place greatest weight on the modal report of their characteristic

18
Time-variant pupil characteristics FSM eligible SEN Postcode, LLSOA, IDACI rank Connexions, gifted and talented (variable school recording of this) Mode of travel (new) Part-time, border
 Mode of travel (new) Part-time, border")
19
Obtaining geo-classifications for home addresses Standard release: DCSF will release a lower level super output area to indicate where the child lives LLSOA – geographical area with a minimum population of 1,000, nested within census ward boundaries Secure release: DCSF will release child’s home postcode to researchers who make a case for it and can show data will be held securely Home postcode – geographical area with an average of 11 households, giving a relatively precise (within 100m) geo-location WILL NOT release if you just want to attach geo-data to the postcode (they will do this for you) WILL NOT release if you just want to calculate home-school distances, find the nearest school etc (they will do this for you)
 geo-location WILL NOT release if you just want to attach geo-data to the postcode (they will do this for you) WILL NOT release if you just want to calculate home-school distances, find the nearest school etc (they will do this for you)")
20
Access to NPD data Most researchers can access this data Have to outline their research question, the data they need, make a case for any special additional variables that are thought to be disclosive (e.g. date ofbirth, postcode) and provide evidence that data will be held securely (never on laptop or desktop etc) Data is transfered via a encrypted electronic transfer If want to use data for new research project, need to approach DfE again before using data
 and provide evidence that data will be held securely (never on laptop or desktop etc) Data is transfered via a encrypted electronic transfer If want to use data for new research project, need to approach DfE again before using data.")
21
NI Schools Data Have similar data though not so detailed results data. Basic outcomes at KS2, KS4 and KS5 Census data comparable and in some cases more rich But have potential to link this to HESA data and graduate destinations survey as well

22
Access to linked HESA/NPD data This access occurs through BIS who have done the linkage Again need to outline research question and make case for data Again transfer is via electronic encrypted transfer (FTP site) and host organisation has to demonstrate has secure facilities where data will be kept
 and host organisation has to demonstrate has secure facilities where data will be kept")
23
DWP and HMRC data: WPLS The DWP has linked all DWP benefit and program participants to HMRC employment and earnings data (from P14 returns) since 1998 This is called the WPLS (Work and Pensions Longitudinal Study) Permission to link this to FRS, NCDS, MCS and ELSA surveys as well (consent obtained from individuals in these surveys) A summary of its uses can be found here http://statistics.dwp.gov.uk/asd/longitudinal_study/WPLS _Uses.pdf
 since 1998 This is called the WPLS (Work and Pensions Longitudinal Study) Permission to link this to FRS, NCDS, MCS and ELSA surveys as well (consent obtained from individuals in these surveys) A summary of its uses can be found here _Uses.pdf")
24
WPLS Researchers have had access to this data when carrying out work/evaluations for DWP What data does not include is HMRC records for individuals who have not been on DWP program or benefits so not as good as it could be... But surveys who have sought permission to link to DWP and HMRC data can link to this additional HMRC data (e.g. FRS, ELSA, NCDS and MCS) Collecting data on benefit receipt typically difficult to do in surveys so this linkage extremely valuable and saves survey time costs This data covers whole of Great Britain – not just England
 Collecting data on benefit receipt typically difficult to do in surveys so this linkage extremely valuable and saves survey time costs This data covers whole of Great Britain – not just England.")
25
HMRC NIC data HMRC has records on individual NI contributions since NI was introduced in 1948 Originally only 1% of sample was held electronically but now all of these records are electronically held by HMRC The English Longitudinal Survey of Aging (ELSA) has linked all individuals in its survey who gave consent for linkage to this NIC data which means they have earnings and employment history for their sample from 1948 Up until recent changes in NI for those above UEL, do not know earnings above UEL but this reasonably small proportion for most time periods and no longer an issue This data going to be linked to NCDS and MCS (where consent rates were in excess of 80%)
 has linked all individuals in its survey who gave consent for linkage to this NIC data which means they have earnings and employment history for their sample from 1948 Up until recent changes in NI for those above UEL, do not know earnings above UEL but this reasonably small proportion for most time periods and no longer an issue This data going to be linked to NCDS and MCS (where consent rates were in excess of 80%)")
26
Other data GP registration data (NILS at forefront here) Hospital Episodes Data Home Office data on crimes (have individual level information) Birth, marriages and death registration data (NILS again at forefront here)
 Hospital Episodes Data Home Office data on crimes (have individual level information) Birth, marriages and death registration data (NILS again at forefront here)")
27
How has this linked ADMIN data been used by researchers? Going to shamelessly focus on some of the work I have done with this data Not always successful as I will demonstrate – and this linked administrative data not always up to research task But has great potential to answer lots of policy relevant questions

28
Widening participation in HE Joint work with Chowdry, Crawford, Goodman and Vignoles Shows that prior school attainment is main reason for large gap between rich and poor in: HE participation Participation in a ‘high status’ university Suggests HE funding reforms are not best tool for addressing social mobility/‘access’ issues. Focus instead must be on improving school attainment amongst poor children Uses linked school, FE and HE administrative data to assess schooling roots of large SEP gap

29
Widening participation in HE

30
Month of birth effects Joint work with Crawford and Meghir Children born in September start school aged 5 whereas those born in August are almost a year younger Does this impact on longer term educational outcomes? Used samed linked data to look at this question Found being born in August has prolonged impact on educational outcomes and even reduces probability of entering HE

31
Raw differences (proportion getting expected level)
")
32
Summary of findings August-born children experience significantly poorer education outcomes than September-born children Almost entirely due to differences in the age at which they sit the tests Starting school earlier/having more terms of school is marginally better for August born children at younger ages

33
Ethnic Parity in JCP services in UK? Joint work with Crawford, Mesnard, Shaw and Sianesi at IFS Ethnic parity: No difference on average between Ethnic Minority and “otherwise identical” White entering the same JCP office and accessing same program/benefit Our aim: Get as close as possible to “otherwise identical” White and see what difference remains Calculate results for a range of JCP benefits and programs

34
Programs and Benefits Incapacity benefit (IB): paid to individuals who are assessed as being incapable of work and who meet certain National Insurance contributions conditions. Income support (IS ): a benefit for individuals on low income; usually claimants are lone parents, sick or disabled, or carers. Jobseeker’s allowance (JSA): a benefit paid to individuals of working age who are unemployed, or who work fewer than 16 hours per week and are looking for full-time work. New Deal for Lone Parents (NDLP ): a voluntary programme whose aim is to encourage lone parents to improve their work prospects and help them into work. New Deal for individuals aged 25 plus (ND25plus ): a programme to help unemployed individuals aged 25 and over to find and keep a job. Participation is compulsory for individuals who have been claiming JSA for at least 18 of the previous 21 months. New Deal for Young People (NDYP): similar to ND25plus except that it is targeted on individuals aged 18-24. Participation is compulsory for those who have been claiming JSA for at least six months.
: a benefit for individuals on low income; usually claimants are lone parents, sick or disabled, or carers. Jobseeker’s allowance (JSA): a benefit paid to individuals of working age who are unemployed, or who work fewer than 16 hours per week and are looking for full-time work. New Deal for Lone Parents (NDLP ): a voluntary programme whose aim is to encourage lone parents to improve their work prospects and help them into work. New Deal for individuals aged 25 plus (ND25plus ): a programme to help unemployed individuals aged 25 and over to find and keep a job. Participation is compulsory for individuals who have been claiming JSA for at least 18 of the previous 21 months. New Deal for Young People (NDYP): similar to ND25plus except that it is targeted on individuals aged Participation is compulsory for those who have been claiming JSA for at least six months..")
35
Controlling for selection Control for differences in observed characteristics between ethnic groups that may affect outcomes Data: Detailed labour market histories Individual background characteristics Methods: Primarily propensity score matching (PSM) Also regression-based methods and conditional difference in differences (DID) Previous LM history may have been affected by discrimination but nothing we can do about this
 Also regression-based methods and conditional difference in differences (DID) Previous LM history may have been affected by discrimination but nothing we can do about this")
36
Sampling frame Sample selected on inflow into programme Addresses differential selection off programme

37
Sampling frame Sample selected on inflow into programme Addresses differential selection off programme Inflow window is 2003, allowing: 3-year pre-inflow labour market history 1-year follow-up Inflow windowPrevious labour market history Outcomes Dec 2004 Jan 20002003

38
Outcomes of interest Two dimensions of labour market status In employment (15+ days in the month) On benefit (15+ days in the month) Benefit definition includes: IS, IB, JSA, New Deal options, Basic Skills and Work- Based Learning for Adults Measured monthly
 On benefit (15+ days in the month) Benefit definition includes: IS, IB, JSA, New Deal options, Basic Skills and Work- Based Learning for Adults Measured monthly")
39
Data Primarily Work and Pensions Longitudinal Study (WPLS) Benefit and employment spells for anyone on a DWP benefit since mid-1999 Also contains limited demographics including sex, DOB, ethnicity and postcode Also used National Benefit Database (NBD) and census information
 Benefit and employment spells for anyone on a DWP benefit since mid-1999 Also contains limited demographics including sex, DOB, ethnicity and postcode Also used National Benefit Database (NBD) and census information")
40
X variables Employment and benefit history Past participation in voluntary programmes Past participation in Basic Skills Individual characteristics Gender, age, month of inflow Proxies for education and wealth (from census) Local area characteristics (region, travel-to-work-area unemployment) Other programme-related information
 Local area characteristics (region, travel-to-work-area unemployment) Other programme-related information")
41
What did we find? For most programs and benefits (with exception of IS and IB), Minorities and Whites are simply too different for satisfactory estimates to be calculated and results are sensitive to the methodology used. MASSIVE COMMON SUPPORT PROBLEMS This calls into question previous results based on simple regression techniques, which may hide the fact that observationally different ethnic groups are being compared by parametric extrapolation. In some cases, depending on method used, eg NDLP we could find significant ethnic penalites in employment (raw and DID), no ethnic penalty (regression methods) and significant ethnic premium (PSM)
, Minorities and Whites are simply too different for satisfactory estimates to be calculated and results are sensitive to the methodology used. MASSIVE COMMON SUPPORT PROBLEMS This calls into question previous results based on simple regression techniques, which may hide the fact that observationally different ethnic groups are being compared by parametric extrapolation. In some cases, depending on method used, eg NDLP we could find significant ethnic penalites in employment (raw and DID), no ethnic penalty (regression methods) and significant ethnic premium (PSM).")
42
IB: raw labour market status

43
IB: overall employment result Reliability of matching: CS(0), UC(28) (i.e. reliable according to our criteria)
.")
44
IB: overall benefit result Reliability of matching: CS(0), UC(28) (i.e. reliable according to our criteria) * * * *
 * * * *.")
45
Need other methods to do this properly Using administrative data to analyse this question very problematic Problem due to the fact that the Ethnic Minority and White clients accessing the same JCP office are very different in the UK with exception of IS and IB recipients Might not be problem in other countries but could be....... Not problem with ADMIN data – just can’t be used for this question

Similar presentations


John ‘Mac’ McDonald Sophia Rabe-HeskethAnna Vignoles Kirstine HansenNikos Tzavidis James.>")


 in providing formal long term care in England Dr Shereen Hussein Professor Jill Manthorpe 8 to 11 Sep 2010Social Care.>")


