Download presentation
Presentation is loading. Please wait.

1
Generating Flow Frequencies – Updating NOAA Atlas Precipitation Frequency for California by: John High, Hydrologist Sacramento District Sacramento District U.S. Army Corps of Engineers U.S. Army Corps of Engineers

2
Precipitation Frequency Curves also called “Depth Duration Frequency (DDF) Curves” Q: What are they used for?? A: Input to Rational Equation or Rainfall-Runoff Model * Calculate peak discharge - channel design - levee design - culvert design - floodplain mapping * Calculate a runoff volume for a storage area or a dam

4
Streamgage Watershed Map Damage reach

5
streamgage 1. Create Rainfall- Runoff Model & Calibrate to Historic Storm Event Damage reach Concentration point

6
RAINFALL IN INCHES PER HOUR PEAK = 53,500 CFS 1983 FLOOD

9
streamgage 2.Input “design storm” into model and adjust parameters to match flow frequency curve. Damage reach Concentration point hydrograph

10
Flow Frequency Curve

11
streamgage Damage reach Concentration point 100-yr design hydrograph

12
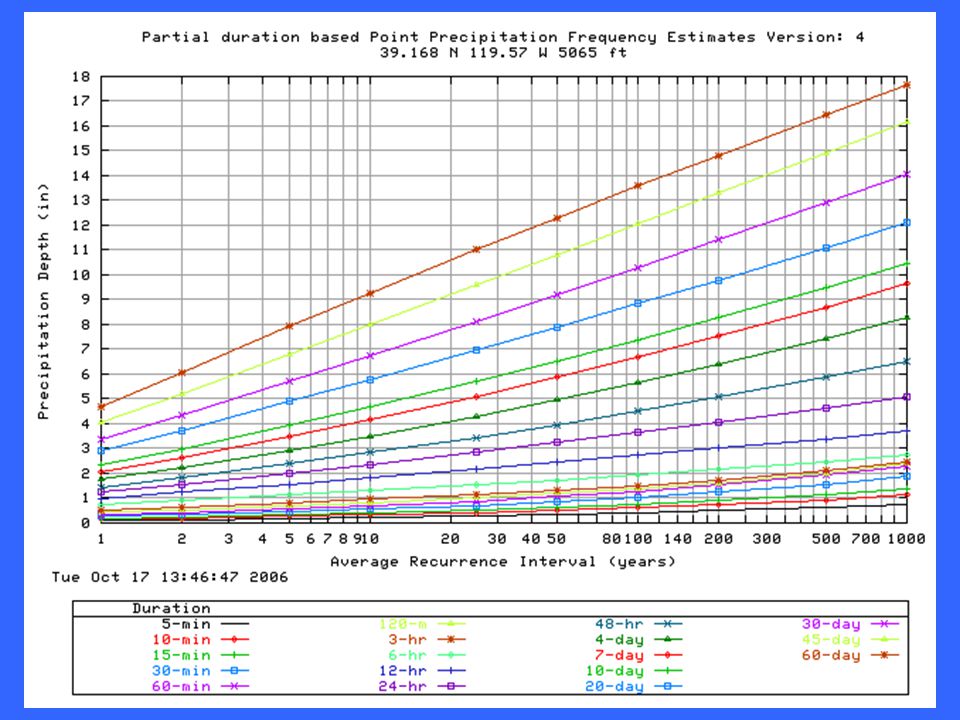
Existing Depth-Duration Frequency Curves for California -NOAA ATLAS 2 “Precipitation Frequency Atlas of the Western United States”, Vol XI- California, 1973 - Department of Water Resources - Department of Water Resources Rainfall Analysis for Drainage Design Rainfall Analysis for Drainage Design Bulletin 195, 1976 Bulletin 195, 1976 (regional frequency analysis by Jim Goodridge and staff) (regional frequency analysis by Jim Goodridge and staff)
 (regional frequency analysis by Jim Goodridge and staff)")
13
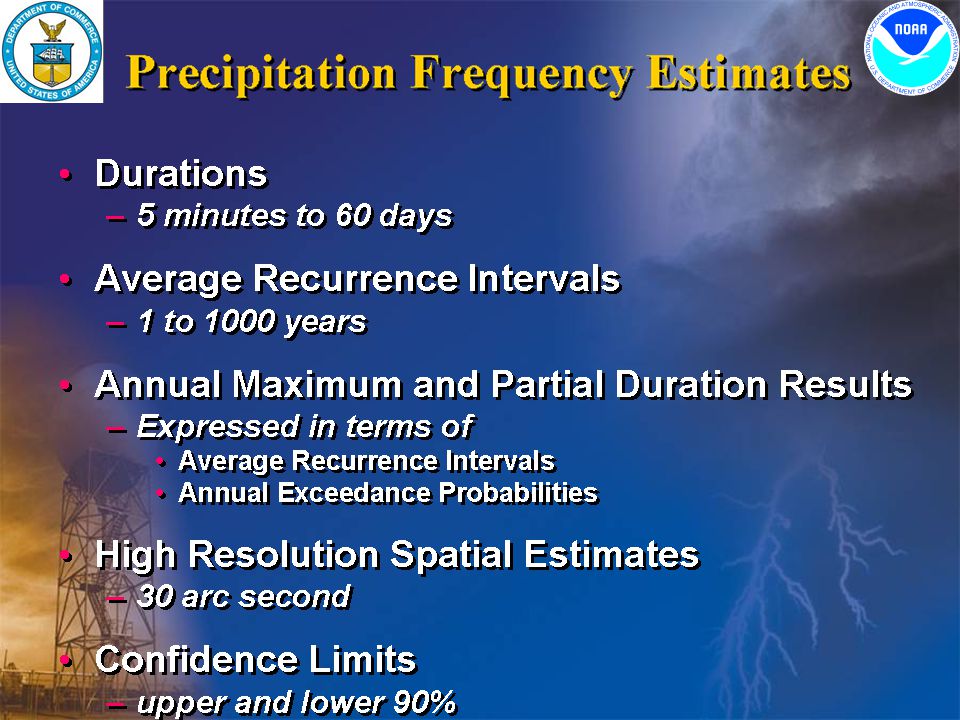
NOAA Atlas 2 1. Covers 11 Western States 2. Regional Frequency Analysis 3.Gumbel Extreme Value Distribution 4.Isopluvial Maps for 6-hr and 24-hr duration, 2 – 100 yr return periods 5. Use formulas/charts to derive other durations/return periods durations/return periods 6. GIS maps recently available in raster format (cells)
.")
14
NOAA Atlas 2

15
DWR Bulletin 195 1. Covers California 2. Regional Frequency Analysis 3.Pearson Normal Distribution 4.Hard-copy maps of 2-yr thru 10,000 yr, short and long-duration values 5. Analyzed ~2,000 gages Note: DWR will update Bulletin 195 near future. GIS map layers available within a couple years - David Rizzardo of DWR - David Rizzardo of DWR

16
WHY HASN’T NOAA ALTAS 2 BEEN UPDATED? 1.NOAA Atlas updates are NOT in the Weather Service’s Mission Statement 2.U.S. Congress provides no funding 3.Funding must come from other federal or state agencies

17
UPDATED PORTIONS OF THE COUNTRY

18
WHO DOES THE UPDATE? National Weather Service Hydrometeorological Design Studies Center Silver Spring, MD Geoff Bonnin, Chief Small, top-notch team of scientists.Small, top-notch team of scientists. Future funding uncertain, so staff may be laid off.Future funding uncertain, so staff may be laid off.

20
Funding to Finish NOAA14 for California Total Cost = $305,000 -or- more 1. CALTRANS: $100,000 Glenn Decou, Chief of Highway Drainage Design 2. CA Department of Water Resources: $100,000 3. NWS, Sacramento Office (Coastal Storms Program) – maybe $50,000? 4.U.S. Army Corps of Engineers: $55,000 or more COMPLETED PRODUCT IN 2 – 3 YEARS
 – maybe $50, U.S. Army Corps of Engineers: $55,000 or more COMPLETED PRODUCT IN 2 – 3 YEARS.")
34
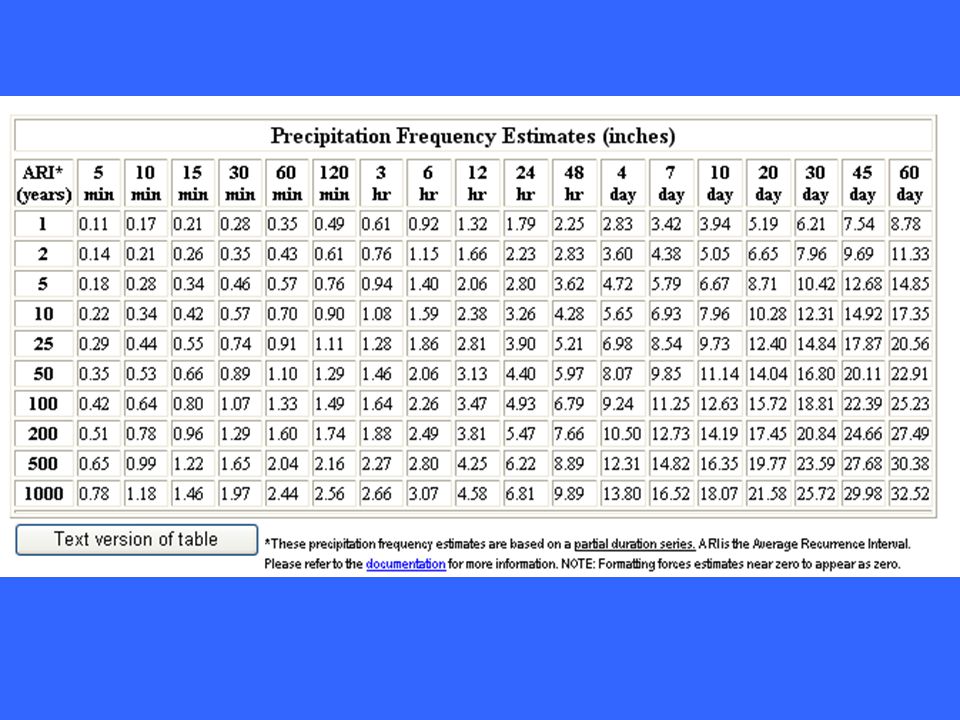
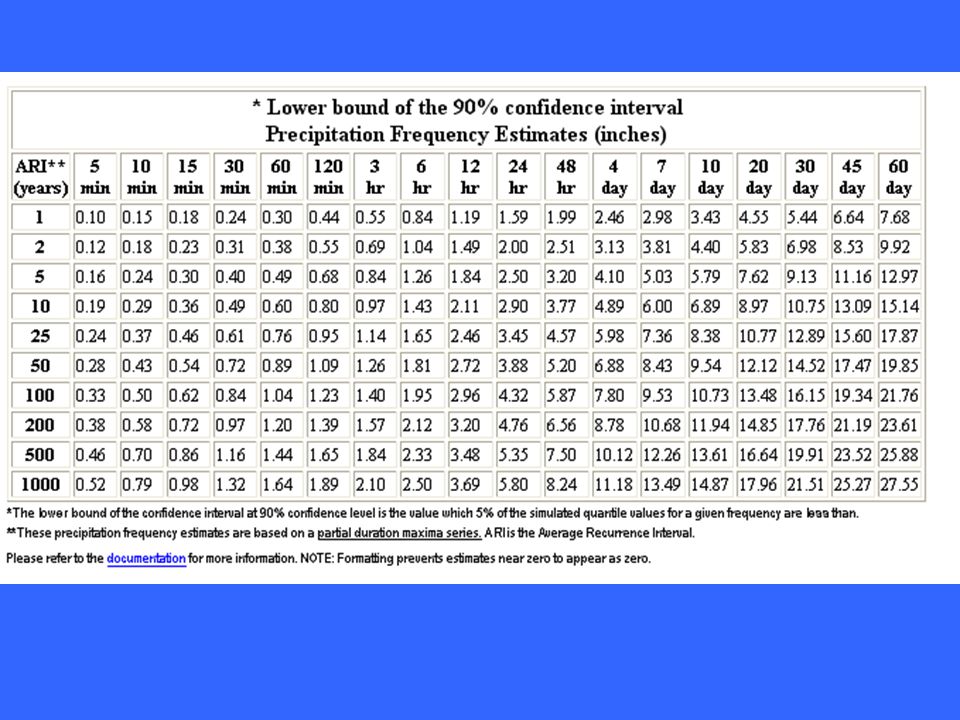
LOCATION ON EAST SIDE OF LAKE TAHOE: 90% Confidence Interval Upper Bound = 5.53 inches 100YR, 24-HOUR DEPTH = 4.93 inches 90% Confidence Interval Lower Bound= 4.32 inches

38
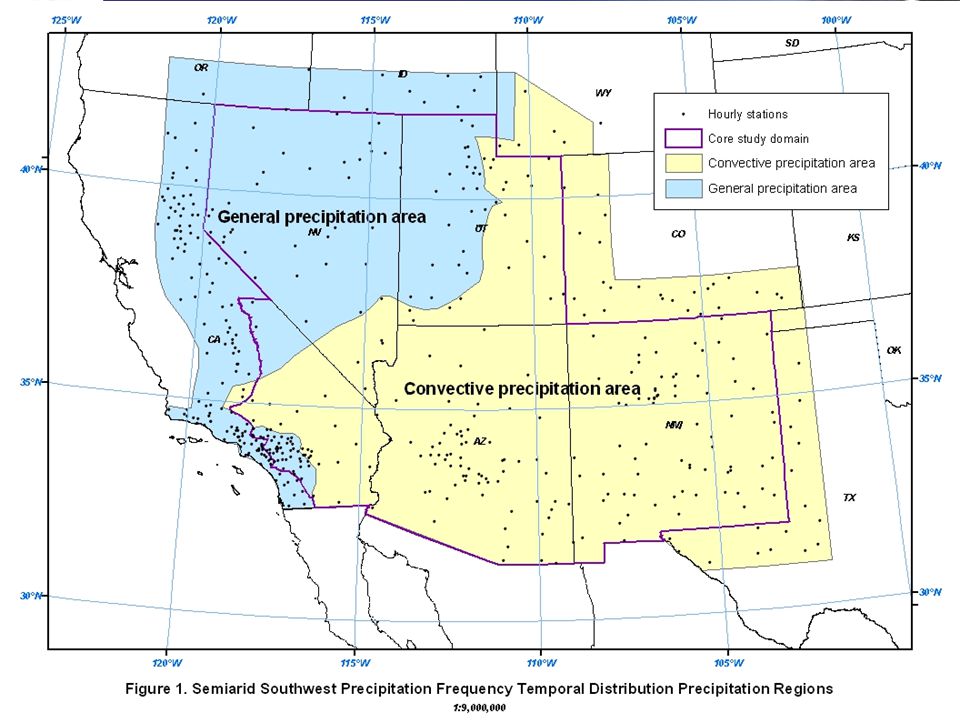
SUMMARY 1.The National Weather Service will start work on NOAA14 for the rest of California within a few months. 2.Completion will be in 2 – 3 years 3.Study will incorporate state-of-the-art methods and technology 4.Includes quality control and screening – not all gages will be used 5.Study will include review and comment period of draft product Concern: NWS used calendar year analysis of data for Semi-Arid region. Not appropriate for California – annual data should be separated by Water Year.

39
Weblink for NWS NOAA14 Precipitation: http://hdsc.nws.noaa.gov/hdsc/pfds/index.html Points of Contact: Dave Rizzardo, DWR 916-574-2617 John High, USACE 916-557-7136 THE END

Similar presentations


 Rainfall-runoff modeling ERS 482/682 Small Watershed Hydrology.>")
 Flood (and drought) prediction ERS 482/682 Small Watershed Hydrology.>")


