Download presentation
Presentation is loading. Please wait.

1
Lab 4: Inbreeding and Kinship

2
Inbreeding Causes departure from Hardy-Weinburg Equilibrium Reduces heterozygosity Changes genotype frequencies Does not change allele frequencies

3
http://scienceblogs.com/notrocketscience/2 009/04/14/how-inbreeding-killed-off-a-line- of-kings/

4
Inbreeding: Breeding between closely related individuals. H f = Heterozygosity observed in a population experiencing inbreeding The inbreeding coefficient (f) can be calculated by:
 can be calculated by:.")
5
1.P robability that two homologous alleles in an individual are IBD. 2.Value of “f” ranges from 0 to 1. Inbreeding coefficient (f) A1A2A2A2 A1A2 A1A1IBD A1A2 A1 Not IBD
 A1A2A2A2 A1A2 A1A1IBD A1A2 A1 Not IBD.")
6
The inbreeding coefficient (f) can be calculated using the fixation index (F), assuming the departure from HWE is entirely due to inbreeding. H O > H E, negative F-value. H O < H E, positive F-value.

7
Selfing: The most extreme form of inbreeding Many plants, and some animals, are capable of self- fertilization Some only self, while others have a mixed mating system o Selfing rate: S o Outcrossing rate: T = (1 - S) (http://www.life.illinois.edu/help/digitalflowers/BreedingSystems/5.htm)
 (")
8
At inbreeding equilibrium, there is no change in heterozygosity i.e. H t = H t-1 = H eq

9
Rate of self-fertilization (S) can be estimated from the relationship: Assumptions: 1.Population is in inbreeding equilibrium. 2.Deviation from HWE is entirely due to self- fertilization.

10
Problem 1: Mountain dwarf pine (Pinus mugo) typically grows at high elevations in Southern and Central Europe. Unlike most other pines, P. mugo forms multiple intertwined stems and one tree can occupy areas as large as 50-100 m2. Relatively little is known about the population genetics of this species, with most of the available information coming from several studies based on allozyme markers. (Ukrainian Carpathians; Wikimedia Commons)
.")
11
Download the data (file pmugo_allozymes.xls), analyze them using GenAlEx, and use the output of your analyses to answer the following questions: a)Are most populations and loci in HWE? If not, are departures generally due to heterozygote excess or deficiency? b)How do you explain differences among loci in departures from HWE? Do some loci tend to show more departures than others? c)How do you explain differences among populations? d)P. mugo has a mixed mating system. Assuming that the observed level of inbreeding can be accounted for by self-fertilization alone, what is the estimated rate of self-fertilization S? e)The rate of self-fertilization can be estimated more reliably if the genotypes of the progeny are compared to the genotypes of their mothers for multiple loci. An estimate of the average rate of self-fertilization using this approach is S = 0.15. How would you explain the difference between this estimate and the one you calculated in d)? Please consider the biology of this organism in your response.
How do you explain differences among loci in departures from HWE. Do some loci tend to show more departures than others. c)How do you explain differences among populations. d)P. mugo has a mixed mating system. Assuming that the observed level of inbreeding can be accounted for by self-fertilization alone, what is the estimated rate of self-fertilization S. e)The rate of self-fertilization can be estimated more reliably if the genotypes of the progeny are compared to the genotypes of their mothers for multiple loci. An estimate of the average rate of self-fertilization using this approach is S = How would you explain the difference between this estimate and the one you calculated in d). Please consider the biology of this organism in your response..")
12
Example 1: Estimate the inbreeding coefficient of progeny resulting from mating between half-first cousins. Half first-cousins share one grandparent.

13
CA A1A2 B C DE P A2A2 P(A2)= 1/2 CA A1A2 B C DE P Overall probability that the two alleles in the offspring will be IBD is: f = P(A1A1) + P(A2A2) = 1/64 + 1/64 = 1/32 P(A2)= 1/2
= 1/2 CA A1A2 B C DE P Overall probability that the two alleles in the offspring will be IBD is: f = P(A1A1) + P(A2A2) = 1/64 + 1/64 = 1/32 P(A2)= 1/2")
14
Chain- Counting Technique: 1 2 3 4 5 Where, N= # of individuals in the chain. Chain for half-first cousin: D-B-CA-C-E

15
Example 2: Estimate the inbreeding coefficient of progeny P. m= # of common ancestors = 2 Chain 1: D-B-CA1-C-E Chain 2: D-B-CA2-C-E N1= 5 N2= 5

16
When common ancestors are inbred : Where, f CA(i) is the inbreeding coefficient of the i- th common ancestor.
 is the inbreeding coefficient of the i- th common ancestor.")
17
Estimation of Kinship coefficient A1A2 A3A4 A1A3 A2A3 A3A3A2A3 Inbreeding coefficient (f): P robability that two homologous alleles in an individual are IBD. Kinship coefficient (fxy): Probability that two alleles, one randomly chosen from each individual are IBD. XY
: Probability that two alleles, one randomly chosen from each individual are IBD. XY.")
18
A1A2 A3A4 A1A3 A2A3 A3A3A2A3 H A3A3 Estimation of Kinship coefficient Kinship coefficient between two individuals X and Y (f XY ) = inbreeding coefficient (f) of a hypothetical offspring from X and Y. X Y

19
Problem 2: The kinship coefficient of two individuals is the probability that two alleles, one randomly chosen from each individual, are IBD. If the two individuals can reproduce, their kinship coefficient is equal to the inbreeding coefficient of the resulting offspring. Assuming that all common ancestors have f CA = 0.01, determine the kinship coefficients for the following relationships: a)Half-sibs (i.e., siblings that share one parent). b)Full first cousins (offspring of full siblings). c)GRADUATE STUDENTS ONLY: Monozygotic twins (Hint: Do not use the chain counting technique for this case. Think about the strict definition of the kinship coefficient). d)Parent and offspring. e)Uncle and niece. f)Grandmother and granddaughter. g)GRADUATE STUDENTS ONLY: Double-first cousins (i.e., first cousins that share all four grandparents).
Half-sibs (i.e., siblings that share one parent). b)Full first cousins (offspring of full siblings). c)GRADUATE STUDENTS ONLY: Monozygotic twins (Hint: Do not use the chain counting technique for this case. Think about the strict definition of the kinship coefficient). d)Parent and offspring. e)Uncle and niece. f)Grandmother and granddaughter. g)GRADUATE STUDENTS ONLY: Double-first cousins (i.e., first cousins that share all four grandparents)..")
20
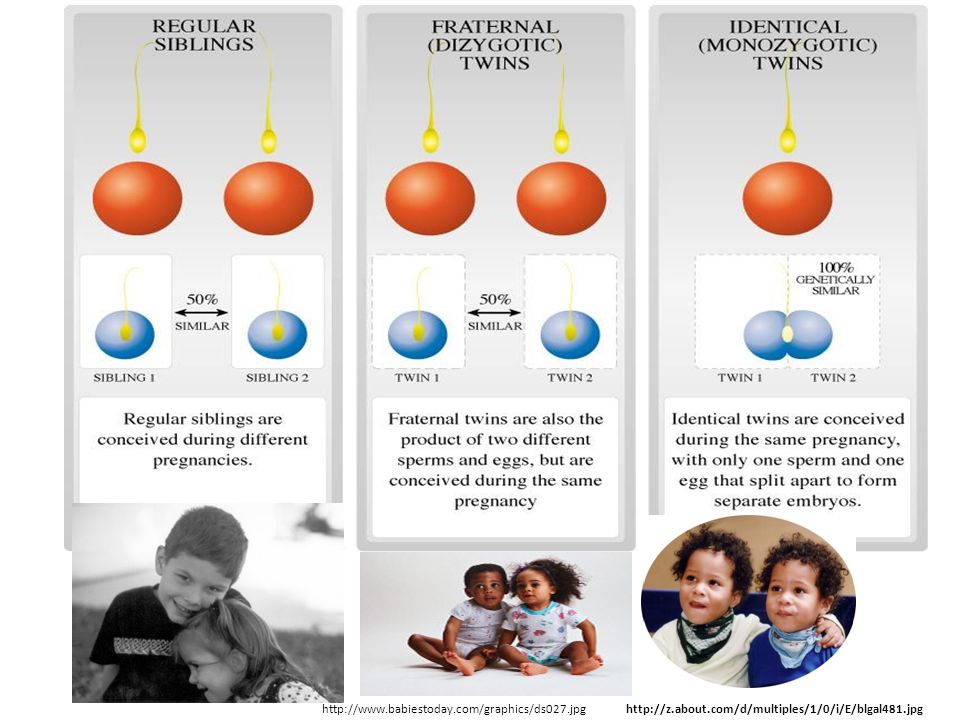
http://z.about.com/d/multiples/1/0/i/E/blgal481.jpg http://www.babiestoday.com/graphics/ds027.jpg
21
GenotypeCount PP343 PR87 PW62 RR248 RW57 WW223 IBD Problem 3. You have decided to do some targeted sequencing to determine actual genotype distributions for the locus controlling flower color in the Mountain Laurel population described in Lab 3. You obtain the following results: a)Quantitatively evaluate the null hypothesis that this population does not deviate from Hardy Weinberg expectations. b)Assuming the departure from HWE results entirely from inbreeding, what is the inbred fraction of this population? c)Develop a biological hypothesis to explain your results.
Quantitatively evaluate the null hypothesis that this population does not deviate from Hardy Weinberg expectations. b)Assuming the departure from HWE results entirely from inbreeding, what is the inbred fraction of this population. c)Develop a biological hypothesis to explain your results..")
Similar presentations


 Inbreeding & pedigree analysis Discuss outlines.>")


