Download presentation
Presentation is loading. Please wait.

1
Dwarf galaxies in the ΛCDM model
Mario G. Abadi Observatorio Astronómico Universidad Nacional de Córdoba (UNC) Instituto de Astronomía Teórica y Experimental CONICET-UNC February 4-7 , 2013 Cosmology, Large Scale Structure and First Object USP Conference, Sao Paulo, Brazil
 Instituto de Astronomía Teórica y Experimental CONICET-UNC. February 4-7 , Cosmology, Large Scale Structure and First Object. USP Conference, Sao Paulo, Brazil.")
2
Collaborators: Alejandro Benítez-Llambay (Córdoba)
Ismael Ferrero (Córdoba) Julio Navarro (Victoria) Laura Sales (Garching) Sebastian Gurovich (Córdoba) Stefan Gottloeber (Potsdam) Gustavo Yepes (Madrid) Yehuda Hoffman (Jerusalem) Matthias Steinmetz (Potsdam) Let me first acknowledge to my collaborators, here in the list. And I also want to mention that most of the hard work was be done by Alejandro Benitez-Llambay and Ismael ferrero who work in Cordoba.
 Julio Navarro (Victoria) Laura Sales (Garching) Sebastian Gurovich (Córdoba) Stefan Gottloeber (Potsdam) Gustavo Yepes (Madrid) Yehuda Hoffman (Jerusalem) Matthias Steinmetz (Potsdam) Let me first acknowledge to my collaborators, here in the list. And I also want to mention that most of the hard work was be done by Alejandro Benitez-Llambay and Ismael ferrero who work in Cordoba.")
3
Outline Tuesday Feb. 05 Part II – Structure of the Universe: Theory, Simulations and Observations II.4 Comparison of simulations with observations: “Dwarf galaxies in the ΛCDM model” There seems to be some tension between observations and simulations in dwarf galaxy scales. I) Observations II) Simulations The title of this afternoon session is “comparison of simulations with observations” and I will focus my talk on dwarf galaxies because, as we have already eared yesterday by Volker and Tom, and also this morning by Fabio, there seems to be some tension beteen observation and simulations in dwarf galaxy scales. The first part of my talk I’ll present some observational evidence about this existing tension, and in the second part I’ll present some results some numerical simulations that may help to alleviate this tension.
 Observations. II) Simulations. The title of this afternoon session is comparison of simulations with observations and I will focus my talk on dwarf galaxies because, as we have already eared yesterday by Volker and Tom, and also this morning by Fabio, there seems to be some tension beteen observation and simulations in dwarf galaxy scales. The first part of my talk I’ll present some observational evidence about this existing tension, and in the second part I’ll present some results some numerical simulations that may help to alleviate this tension.")
4
Galaxy Stellar Mass Function
~50000 galaxies from Sloan Digital Sky Survey with redshift <z<0.05 by Baldry et al 2008 Number Density of Galaxies per Log mass interval [dex^-1 Mpc^-3] This is the observed Galaxy Stellar Mass Function, which is the number of galaxies per unit volume and per unit mass iin this logarithmic scale. This function was computed bt Baldry and collaborators in 2008 for approximately local galaxies (very low redshift) in the Sloan Digital Sky Survey. Stellar masses range about 5 order of magnitudes from 10^7 up to almost 10^12 solar masses. Log Stellar Mass [Msolar]
 in the Sloan Digital Sky Survey. Stellar masses range about 5 order of magnitudes from 10^7 up to almost 10^12 solar masses. Log Stellar Mass [Msolar]")
5
Galaxy Stellar Mass Function
~50000 galaxies from Sloan Digital Sky Survey with redshift <z<0.05 by Baldry et al 2008 MW Stellar mass 5x10^10 Msolar Number Density of Galaxies per bin [dex^-1 Mpc^-3] The image here is the Mikly Way galaxy, which has a stellar mass of about 5x10^10 solar masses. Then, a Milky Way-like galaxy will be locate in this region of the plot. And we would like to compare this stellar mass function with the dark matter halo mass function given that according to the current paradigm of galaxy formation each galaxy lives in the potential well of its own dark matter halo Log Stellar Mass [Msolar]

6
Dark Matter Halo Mass Function
Millennium series of Dark Matter only simulations (Springel et al 2005 & Angulo et al 2012) In turn, this is the Dark Matter Halo Mass function computed for the Millennium series of simulations by Volker Springel and Raul Angulo. The Millennium series establishes a numerically well converged halo mass function over almost seven orders of magnitude, from about 10^9M up to nearly 10^16. This results agree very well with what other groups have found. Dark Matter Halo Mass
 In turn, this is the Dark Matter Halo Mass function computed for the Millennium series of simulations by Volker Springel and Raul Angulo. The Millennium series establishes a numerically well converged halo mass function over almost seven orders of magnitude, from about 10^9M up to nearly 10^16. This results agree very well with what other groups have found. Dark Matter Halo Mass.")
7
Dark Matter Halo Mass Function
Millennium series of Dark Matter only simulations (Springel et al 2005 & Angulo et al 2012) Given that the stellar masses of galaxies range from 10^7 up to 10ˆ12 solar masses, the comparison between these to functions can be done only in this part of the plot. So if we conventrate only in this region we got the following plot Angulo et al 2012 Dark Matter Halo Mass
 Given that the stellar masses of galaxies range from 10^7 up to 10ˆ12 solar masses, the comparison between these to functions can be done only in this part of the plot. So if we conventrate only in this region we got the following plot. Angulo et al Dark Matter Halo Mass.")
8
Galaxy and Halo Mass Function
At the faint end, the dark matter halo mass function is much steeper than the galaxy stellar mass function What is the relation between galaxy stellar mass and dark matter halo mass in order to reconcile these two distributions? Milennium Dark Matter Halos (rescaled) Galaxies Baldry et al 2008 Were we have rescaled the dark matter function to stress that this is 2 curves have a very different shape that can’t be fixed with a normalization constant. And, has we have already eared this is a very well known proplem for CDM cosmologies: At the fint end the dark matter halo mass function is much steeper than the galaxy stellar mass function. Which means that galaxy formation has to be increasently more inefficint towars the low mass end. So, the problemis how can we reconcile these two distributions. Log Mass [Msolar]
 Galaxies. Baldry et al Were we have rescaled the dark matter function to stress that this is 2 curves have a very different shape that can’t be fixed with a normalization constant. And, has we have already eared this is a very well known proplem for CDM cosmologies: At the fint end the dark matter halo mass function is much steeper than the galaxy stellar mass function. Which means that galaxy formation has to be increasently more inefficint towars the low mass end. So, the problemis how can we reconcile these two distributions. Log Mass [Msolar]")
9
Galaxy Stellar Mass vs Halo Mass
Galaxy–Halo mass relation assuming that dark haloes ranked by their mass are matched to galaxies ranked by stellar mass. The first most massive halo corresponds to the first most massive galaxy, an so on. Universal Baryon Fraction fbar~0.171 Log Stellar Mass [Msolar] One way to reconcile these two distribution is the so called abundance matching model. This model makes a one-by-one correspondence between a galaxy and a dark matter halo . And the way it does is ranking galaxies by its stellar masses and halos by its dark matter masses form the biggest to the smallest one. Then, you make a correspondence between the first most massive halo and the first most massive galaxy, the the second most massive halos with the second most massive galaxy and so on. This technique is called the abundance matching technique and has been successfully applied many times for example by Guo et al., Moster et al, and others. Galaxy–halo mass relation derived by Guo et al. (2010) assuming that the abundance of dark haloes ranked by virial mass, M200, can be matched monotonically to the abundance of galaxies ranked by stellar mass, Mgal The result of this exercise looks something like this. What you see here is the stellar mass of the galaxy and the virial mass of the halo. The price you pay for reconciling this two functions is this steep decline over the low mass end of the halos. You need your make your objects increasingly less efficient in forming stars in order to reconcile this steep low mass end of the mass function that is made naturally in the Lambda CDM. Now, we know that we can then somehow match the distribution of the stellar mass. Abundance Matching Guo et al 2010 Log Dark Matter Halo Mass
 assuming that the abundance of dark haloes ranked by virial mass, M200, can be matched monotonically to the abundance of galaxies ranked by stellar mass, Mgal. The result of this exercise looks something like this. What you see here is the stellar mass of the galaxy and the virial mass of the halo. The price you pay for reconciling this two functions is this steep decline over the low mass end of the halos. You need your make your objects increasingly less efficient in forming stars in order to reconcile this steep low mass end of the mass function that is made naturally in the Lambda CDM. Now, we know that we can then somehow match the distribution of the stellar mass. Abundance Matching. Guo et al Log Dark Matter Halo Mass.")
10
Galaxy Stellar Mass vs Halo Mass
Very steep relation at the low halo mass end Essentially no galaxies with Mgal>10^6 Msolar should form in halos with mass below a threshold of 10^10 Msolar Universal Baryon Fraction fbar~0.171 Log Stellar Mass [Msolar] Then, you obtain a correlation between halo and galaxy mass that is shown here. The result is a very steep decline in the correlation between galaxy and halo mass, at the low halo mass end. But, you keep the right galaxy and halo mass functions. Abundance Matching Guo et al 2010 Log Dark Matter Halo Mass

11
Galaxy Stellar Mass vs Halo Mass
More sophisticated semi-analytic models of galaxy formation (Guo et al. 2011, green triangles) also show very similar results Are this masses consistent with masses estimated from kinematic data? Universal Baryon Fraction fbar~0.171 Log Stellar Mass [Msolar] Not only the abundance matching technique produces such a non-linear correlation. Indeed, more sophisticated semi-analitic models of galaxy formation, here shown by the green triangles, show very similar results. So, the first question here is if this mass inferred for the dark matter halos are consistent with the mass that are estimated from the kinematical data like the rotation curves. Are the enclosed mass inside a given radius consistent with the expected mass? And the answer seems to be: sometimes. Abundance Matching Guo et al 2010 Log Dark Matter Halo Mass
 also show very similar results. Are this masses consistent with masses estimated from kinematic data Universal Baryon. Fraction fbar~ Log Stellar Mass [Msolar] Not only the abundance matching technique produces such a non-linear correlation. Indeed, more sophisticated semi-analitic models of galaxy formation, here shown by the green triangles, show very similar results. So, the first question here is if this mass inferred for the dark matter halos are consistent with the mass that are estimated from the kinematical data like the rotation curves. Are the enclosed mass inside a given radius consistent with the expected mass And the answer seems to be: sometimes. Abundance Matching. Guo et al Log Dark Matter Halo Mass.")
12
Galaxy Stellar Mass vs Halo Mass
Milky Way galaxy Stellar mass ~5x10^Msolar Dark matter halo mass ~1.5x10^12 Msolar Milky Way dSphs (Boylan-Kolchin 2011a,b) Isolated dwarfs HI, tidal interactions negligible and more extended rotation curves Milky Way Log Stellar Mass [Msolar] For example if we take a galaxy like the Milky way, we will find a very good agreement. A galaxy like the milky way has 5x10^10 solar masses, and the abundance matching assign a dark matter halo of about 10^12 solar masses which is very close to the 1 to 2 solar masses that we got from the dynamical models. Boylan-Kolchin and collaborators did the same exercise with the opposite result, as Fabio has already shown us. We have extended the analysis of Boylan-Kolchin to other dwarf galaxies and in particular we have searched in the literature for isolated galaxies with published rotation curves and stellar masses. This has 2 advantages over the Milky way dwarfs. First are isolated, the tidal interaction should not be a problem, in the sense that we don’t know how the tidal interaction could affect the densty profiles. And second, these galaxies have much more extended rotation curves. Then, we can explore a larger range of distances and velocities. So the way we tested these isolated dwarf is to peek up galaxies with stellar masses larger than 10^6 solar masses, and to verify if they live in dark matter halos larger than 10^12 following the abundance matching curve. But of course there is a second test that comes from whether the masses of the halos assigned to this objects is consistent with their internal dynamics. And of course the way you would like to test them is in the low mass end. For that you have two possibilities Dwarf galaxies seems to be, of course, the ideal candidate and perhaps the ones in the milky way are the best you can think of about because they are dark matter dominated and are very well observed and very well defined kinematics. That was the approach taken by Boylan-Kolchin et al. But the idea here you can check if the kinematics of the dwarf spheroidal is consistent with amount of the mass expected to have within a given radius. A different perhaps complementary approach is to say ok let go and do something similar in isolated dwarfs in which you have a rotation curve, HI rotation curve. Let me argue in favor of such approach that has made two advantages one of them is that they are isolated, right?, so you expect tidal interaction to be almost negligible. That removes one uncertainty that is how the profile evolve during the tidal disruption. It also removes the uncertainty of which is the halo of the host galaxy that you have to assume in the case of the dwarf spheroidals. For example some of us have witnessed some warm discussions, the latest days, about which is the mass of the milky way and whether it can be reconcile or not. Let now forget about it, there is no host galaxy here. Is just the dwarf. An the other advantage that it has is because the more extended you can probe you halo at much larger radius that you do in the classical dwarf spheroidals. That’s what we did with Ismael Ferrero is a student at the University of Cordoba Argentina, and what we did say ok, lets take the abundance matching that is the Guo curve in this case and if you select any galaxy that has a stellar mass that is larger than 10^6 solar masses and it should have a dark matter halo or a dark halo that is larger than 10^10 solar masses. That’s the way your prediction works in order to ensure that you get the right stellar mass function. Abundance Matching Guo et al 2011 Log Dark Matter Halo Mass
 Isolated dwarfs HI, tidal interactions negligible and more extended rotation curves. Milky Way. Log Stellar Mass [Msolar] For example if we take a galaxy like the Milky way, we will find a very good agreement. A galaxy like the milky way has 5x10^10 solar masses, and the abundance matching assign a dark matter halo of about 10^12 solar masses which is very close to the 1 to 2 solar masses that we got from the dynamical models. Boylan-Kolchin and collaborators did the same exercise with the opposite result, as Fabio has already shown us. We have extended the analysis of Boylan-Kolchin to other dwarf galaxies and in particular we have searched in the literature for isolated galaxies with published rotation curves and stellar masses. This has 2 advantages over the Milky way dwarfs. First are isolated, the tidal interaction should not be a problem, in the sense that we don’t know how the tidal interaction could affect the densty profiles. And second, these galaxies have much more extended rotation curves. Then, we can explore a larger range of distances and velocities. So the way we tested these isolated dwarf is to peek up galaxies with stellar masses larger than 10^6 solar masses, and to verify if they live in dark matter halos larger than 10^12 following the abundance matching curve. But of course there is a second test that comes from whether the masses of the halos assigned to this objects is consistent with their internal dynamics. And of course the way you would like to test them is in the low mass end. For that you have two possibilities Dwarf galaxies seems to be, of course, the ideal candidate and perhaps the ones in the milky way are the best you can think of about because they are dark matter dominated and are very well observed and very well defined kinematics. That was the approach taken by Boylan-Kolchin et al. But the idea here you can check if the kinematics of the dwarf spheroidal is consistent with amount of the mass expected to have within a given radius. A different perhaps complementary approach is to say ok let go and do something similar in isolated dwarfs in which you have a rotation curve, HI rotation curve. Let me argue in favor of such approach that has made two advantages one of them is that they are isolated, right , so you expect tidal interaction to be almost negligible. That removes one uncertainty that is how the profile evolve during the tidal disruption. It also removes the uncertainty of which is the halo of the host galaxy that you have to assume in the case of the dwarf spheroidals. For example some of us have witnessed some warm discussions, the latest days, about which is the mass of the milky way and whether it can be reconcile or not. Let now forget about it, there is no host galaxy here. Is just the dwarf. An the other advantage that it has is because the more extended you can probe you halo at much larger radius that you do in the classical dwarf spheroidals. That’s what we did with Ismael Ferrero is a student at the University of Cordoba Argentina, and what we did say ok, lets take the abundance matching that is the Guo curve in this case and if you select any galaxy that has a stellar mass that is larger than 10^6 solar masses and it should have a dark matter halo or a dark halo that is larger than 10^10 solar masses. That’s the way your prediction works in order to ensure that you get the right stellar mass function. Abundance Matching. Guo et al Log Dark Matter Halo Mass.")
13
Dwarfs: UGC7559 & SDIG Abundance matching prediction
Let me show a couple of example to illustrate how it works. A first example: this is UGC 7559, data taken from Swaters 1999 and what you see in red triangles with error bars is its rotation curve. And the shaded area is an NFW circular velocity profile for the mass that you would assign to this object based on the abundance matching technique for this stellar mass that is about 2 times 10^7 solar masses. I would say that this is consistent with what you would expect within the error bars overlap. So, this is ok. Observed Rotation Curves Ferrero et al 2012

14
Dwarf Spheroidals of the Milky Way
Dwarf spheroidal satellites of the Milky Way seems to live in halos with 12 km/s < Vmax< 24 km/s. (~10^10 Msolar) (~10^9 Msolar) This is the plot by Boylan Kolchin showing the same exercise for the dwarf of the Milky Way. This plot show us that all the dwarf live in dark matter halos that are below the 10^10 limit for their halo mass. Also, the Aquarius simulations predict about 10 halos with Vmax> 24km/s. (Boylan-Kolchin 2011) Observed Vcirc values of the nine bright dSphs (symbols, with sizes proportional to log LV ), along with rotation curves corresponding to NFW subhalos with Vmax = (12; 18; 24; 40)km/s. The shading indicates the 1 scatter in rmax at xed Vmax taken from the Aquarius simulations. All of the bright dSphs are consistent with subhalos having Vmax 24km/s, and most require Vmax . 18km/s. Only Draco, the least luminous dSph in our sample, is consistent (within 2) with a massive CDM subhalo of 40km/s at z = 0. Boylan-Kolchin et al 2012
 (~10^9 Msolar) This is the plot by Boylan Kolchin showing the same exercise for the dwarf of the Milky Way. This plot show us that all the dwarf live in dark matter halos that are below the 10^10 limit for their halo mass. Also, the Aquarius simulations predict about 10 halos with Vmax> 24km/s. (Boylan-Kolchin 2011) Observed Vcirc values of the nine bright dSphs (symbols, with sizes proportional to log LV ), along with rotation curves corresponding to NFW subhalos with Vmax = (12; 18; 24; 40)km/s. The shading indicates the 1 scatter in rmax at xed Vmax taken from the Aquarius simulations. All of the bright dSphs are consistent with subhalos having Vmax 24km/s, and most require Vmax . 18km/s. Only Draco, the least luminous dSph in our sample, is consistent (within 2) with a massive CDM subhalo of 40km/s at z = 0. Boylan-Kolchin et al")
15
Observational Sample Stellar Mass versus Rotational Velocity (“Tully-Fisher” relation) for a sample of nearby galaxies compiled from the literature. Stellar masses are taken from each paper (or estimated from absolute magnitudes and colors, only a few cases). Stellar Mass We have compiled from the literature a sample of galaxies with published rotation curves and stellar masses. Here we show the stellar mass as a function of the outermost point of the rotation curve. The ‘Tully–Fisher’ relation for a sample of nearby galaxies. Data are compiled from the sources listed in the figure label. Stellar masses are taken from each paper, when given, or estimated from their absolute magnitudes and colours as described in the text. Rotation velocities correspond to the outermost point of the published rotation curve, except for the data of Wolf et al. (2010), which correspond to circular velocities at the stellar half-mass radius. Note that the relation between rotation velocity and stellar mass is well approximated by a single power law despite the strongly non-linear Mgal versus M200 relation shown in the left-hand panel. Outermost Measured Rotational Velocity Ferrero et al 2012
. Stellar Mass. We have compiled from the literature a sample of galaxies with published rotation curves and stellar masses. Here we show the stellar mass as a function of the outermost point of the rotation curve. The ‘Tully–Fisher’ relation for a sample of nearby galaxies. Data are compiled from the sources listed in the figure label. Stellar masses are taken from each paper, when given, or estimated from their absolute magnitudes and colours as described in the text. Rotation velocities correspond to the outermost point of the published rotation curve, except for the data of Wolf et al. (2010), which correspond to circular velocities at the stellar half-mass radius. Note that the relation between rotation velocity and stellar mass is well approximated by a single power law despite the strongly non-linear Mgal versus M200 relation shown in the left-hand panel. Outermost Measured Rotational Velocity. Ferrero et al")
16
Measured versus Predicted Velocity
Massive galaxies seem to be in good agreement with the abundance-matching model. Galaxies with stellar masses below ~3x10^7 Msolar (magenta, red and green) symbols have velocities that fall systematically below the expected ~30 km/s corresponding to a halo mass of ~10^10 Msolar Measured Velocity This plot shows that the abundance matching prediction works well for massive galaxies, however, it fails for low mass galaxies. The measured outermost velocities versus the velocities predicted (at each value of rout) assuming halo masses derived from the abundance-matching Mgal versus M200 relation. Outermost rotation velocity, Vout = Vrot(rout), measured for each galaxy in our sample versus V P out, its predicted value assuming that the halo mass is given by the Mgal versus M200 abundance-matching relation of Guo et al Note that the faintest dwarfs tend to have velocities well below those expected from the model, implying that they inhabit haloes less massive than expected. About 17 per cent of galaxies in our sample with 107 < Mgal/M < 108 have enclosed masses (within rout) more than a factor of 2 smaller than expected from the abundance-matching model. Abundance Matching Predicted Velocity Ferrero et al 2012
 symbols have velocities that fall systematically below the expected ~30 km/s corresponding to a halo mass of ~10^10 Msolar. Measured Velocity. This plot shows that the abundance matching prediction works well for massive galaxies, however, it fails for low mass galaxies. The measured outermost velocities versus the velocities predicted (at each value of rout) assuming halo masses derived from the abundance-matching Mgal versus M200 relation. Outermost rotation velocity, Vout = Vrot(rout), measured for each galaxy in our sample versus V P out, its predicted value assuming that the halo. mass is given by the Mgal versus M200 abundance-matching relation of Guo et al Note that the faintest dwarfs tend to have velocities well below those expected from the model, implying that they inhabit haloes less massive than expected. About 17 per cent of galaxies in our sample with 107 < Mgal/M < 108 have enclosed masses (within rout) more than a. factor of 2 smaller than expected from the abundance-matching. model. Abundance Matching Predicted Velocity. Ferrero et al")
17
(Outermost) Velocity vs Radius
The outermost point rotational velocity for a sample of dwarf galaxies compiled from the literature. Abundance-matching suggest that all points should lie on or above the shaded area labeled M200 = 10^10 Msolar. This is clearly not the case. If there is a minimum halo mass for dwarf galaxy formation, it cannot be much higher than ∼5x10^8 M. Here we present again the results but in the same way as Boylan Kolchin. So, you can do now this exercise in a more statistical way, and what I’m going to tell you in the next slide, is taking this last point of the rotation curve, which is the last point where you have measured the rotational velocity from HI. So, what we did was to compile a sample of objects from the literature that is listed over there, and you just plot them in a circular velocity versus distance plane. The outermost point. And because most of the systems have stellar masses above 10^6 solar masses, you expect them the velocity should be consistent with a halo larger than 10^10 solar masses, this is the shade area over here. And as you can see there are plenty of objects lying well below the expectation. Actually, if you count you get that approximately half of the objects with stellar mass between 10^7 and 10^8 is inconsistent with a halo of 10^10. These results goes along or point to certain agreement with Boylan-Kolching findings for the Local Group dwarfs. But we did it in a completely different environment with isolated dwarfs. But, now as you can see, the halos are drawn up to distances of 2 or 3 kpc where we can put tighter constrains on the dark matter halos where they are living in. For comparison you have here the dwarf spheroidals of the Local Group probing a smaller region of the halos. So, there seems to some tension but Ferrero et al 2012

18
Galaxy Stellar Mass vs Halo Mass
Average galaxy mass as a function of halo mass for our compiled sample. It is clearly shallower than either the abundance-matching model results of Guo et al. (2010) or the semi-analytic model results of Guo et al. (2011). The black solid line indicates the abundance-matching model of Guo et al. (2010); solid triangles correspond to the semi-analytic model of Guo et al. (2011). The dot–dashed line indicates the total baryon mass of a halo according to latest estimates of the universal baryon fraction, f bar = bar/M. The magenta curve shows the average galaxy mass–halo mass relation derived from dwarf galaxies in our sample. Halo masses of individual galaxies are computed by fitting NFW haloes to the kinematic data shown in the right-hand panel of Fig. 3. Circles indicate the average in each halo mass bin; the error bar indicates the dispersion, computed after 3σ clipping a few outliers. Coloured solid curves correspond to various values of the parameter κ introduced in equation (1); κ = 0 corresponds to the abundance-matching relation, higher values correspond to shallower halo mass dependence of galaxy mass Ferrero et al 2012
 or the semi-analytic model results of Guo et al. (2011). The black solid line indicates the abundance-matching model of Guo et al. (2010); solid triangles correspond to the semi-analytic model of Guo et al. (2011). The dot–dashed line indicates the total baryon mass of a halo according to latest estimates of the universal baryon fraction, f bar = bar/M. The magenta curve shows the average galaxy mass–halo mass relation derived from dwarf galaxies in our sample. Halo masses of individual galaxies are computed by fitting NFW haloes to the kinematic data shown in the right-hand panel of Fig. 3. Circles indicate the average in each halo mass bin; the error bar indicates the dispersion, computed after 3σ clipping a few outliers. Coloured solid curves correspond to various values of the parameter κ introduced in equation (1); κ = 0 corresponds to the abundance-matching relation, higher values correspond to shallower halo mass dependence of galaxy mass. Ferrero et al")
19
Galaxy Stellar Mass vs Halo Mass
These results agree with a similar analysis done by Oh et al 2011. Fig. 5.— The Mstar−Mhalo relation of DG1, DG2 and the THINGS dwarf galaxies (Oh et al. 2011) as well as galaxies from the literature (van den Bosch et al. 2001; Stark et al. 2009). The Local Group galaxies, LMC (Mastropietro et al. 2005; Guo et al. 2010), SMC (Stanimirovi´c et al. 2004; Guo et al. 2010), NGC 6822 (Valenzuela et al. 2007) and NGC 3109 (Valenzuela et al. 2007) are also overplotted. The errorbars for Mhalo and Mstar of the LMC and SMC are computed based on the different estimates given by Guo et al. (2010) and the other two papers (i.e., Mastropietro et al and Stanimirovi´c et al. 2004). The errorbars for NGC 6822 and NGC 3109 come from the different mass models that Valenzuela et al. (2007) con- sidered for these galaxies to reproduce their kinematical and photomet- rical properties assuming that they are hosted in CDM halos. The solid curve is from abundance matching by combining the stellar mass func- tion from the SDSS/DR7 with the halo/subhalo mass function from the Millenium and Millenium-II simulations (Guo et al. 2010). As de- scribed in Guo et al. (2010), the relation below the stellar mass 108.3 was extrapolated assuming constant slope as indicated by the dashed line. See Section 4.1 for more details.
 as well as galaxies from. the literature (van den Bosch et al. 2001; Stark et al. 2009). The. Local Group galaxies, LMC (Mastropietro et al. 2005; Guo et al. 2010), SMC (Stanimirovi´c et al. 2004; Guo et al. 2010), NGC (Valenzuela et al. 2007) and NGC 3109 (Valenzuela et al. 2007) are. also overplotted. The errorbars for Mhalo and Mstar of the LMC and. SMC are computed based on the different estimates given by Guo et al. (2010) and the other two papers (i.e., Mastropietro et al and. Stanimirovi´c et al. 2004). The errorbars for NGC 6822 and NGC come from the different mass models that Valenzuela et al. (2007) con- sidered for these galaxies to reproduce their kinematical and photomet- rical properties assuming that they are hosted in CDM halos. The solid. curve is from abundance matching by combining the stellar mass func- tion from the SDSS/DR7 with the halo/subhalo mass function from. the Millenium and Millenium-II simulations (Guo et al. 2010). As de- scribed in Guo et al. (2010), the relation below the stellar mass was extrapolated assuming constant slope as indicated by the dashed. line. See Section 4.1 for more details.")
20
Caveats Incorrect interpretation of the data: rotational velocity of neutral gas in dwarf irregulars is not a direct measure of its circular velocity. Gas pressure, non-circular motions and gas velocity dispersion corrections should be taken into account. Baryonic effects: supernova driven gas blowouts (e.g. Navarro et al. 1996) or gravitational fluctuations created by star-forming regions (Pontzen & Governato 2012) might reduce the dark matter content of dwarf galaxies and alleviate the problem. A mechanism to select a small fraction of low-mass haloes to be galaxy hosts while leaving dark the vast majority of systems of comparable (or even higher) mass. The rotation velocity of neutral gas in dwarf irregulars is not a direct measure of the circular velocity, and must be corrected for the partial support provided by gas pressure, by the presence of non-circular motions and by the non-negligible velocity dispersion of the gas. These corrections are uncertain, and although they are attempted in most published studies, they may require revision when better data and more sophisticated modelling are available. Indeed, the data available in the literature on dwarf irregulars are highly heterogeneous and of varying quality. For example, many of the galaxies in our sample taken from Begum et al. (2008a,b) have no published rotation curves (our analysis uses only their tabulated values of Vout and rout), so it is difficult to assess their reliability. We have labelled individually each galaxy in the right-hand panel of Fig. 3 in an attempt to encourage further observational scrutiny of the systems responsible for the challenge we highlight here. It is unclear, however, how baryons in galaxies with stellar masses as small as those of globular clusters could affect the central region of a 1010 M halo. Although this possibility should be explored more thoroughly, the outlook does not seem promising (see e.g. Boylan-Kolchin et al. 2012; Governato et al. 2012). The most obvious mechanisms, such as feedback from stellar evolution and the effects of photoionization, are already included in the semi-analytic models (see e.g. Fig. 1). A novel mechanism seems required to explain such ‘stochasticity’ in the way dwarf galaxies populate dark matter haloes, but has yet to be identified (Boylan-Kolchin et al. 2012).
 or gravitational fluctuations created by star-forming regions (Pontzen & Governato 2012) might reduce the dark matter content of dwarf galaxies and alleviate the problem. A mechanism to select a small fraction of low-mass haloes to be galaxy hosts while leaving dark the vast majority of systems of comparable (or even higher) mass. The rotation velocity of neutral gas in dwarf irregulars is not a direct measure of the circular velocity, and must be corrected for the partial support provided by gas pressure, by the presence of non-circular motions and by the non-negligible velocity dispersion of the gas. These corrections are uncertain, and although they are attempted in most published studies, they may require revision when better data and more sophisticated modelling are available. Indeed, the data available in the literature on dwarf irregulars are highly heterogeneous and of varying quality. For example, many of the galaxies in our sample taken from Begum et al. (2008a,b) have no published rotation curves (our analysis uses only their tabulated values of Vout and rout), so it is difficult to assess their reliability. We have labelled individually each galaxy in the right-hand panel of Fig. 3 in an attempt to encourage further observational scrutiny of the systems responsible for the challenge we highlight here. It is unclear, however, how baryons in galaxies with stellar masses as small as those of globular clusters could affect the central region of a 1010 M halo. Although this possibility should be explored more thoroughly, the outlook does not seem promising (see e.g. Boylan-Kolchin et al. 2012; Governato et al. 2012). The most obvious mechanisms, such as feedback from stellar evolution and the effects of photoionization, are already included in the semi-analytic models (see e.g. Fig. 1). A novel mechanism seems required to explain such ‘stochasticity’ in the way dwarf galaxies populate dark matter haloes, but has yet to be identified (Boylan-Kolchin et al. 2012).")
21
CLUES Simulations

22
CLUES Simulation A cosmological numerical simulation that matches the Local Group nearby large-scale structure and the relative positions, stellar masses and morphology of its 3 main spirals: Milky Way (MW), Andromeda (M31) and Triangulum (M33). SPH-GADGET2 (Springel 2005) code with cosmic ionizing UV background, star formation, Supernova feedback and isotropic winds. Zoom-in technique with a Low res region = box of 64/h Mpc on a side High res region = roughly spherical of 2/h Mpc radius Initially, 53 millon gas plus dark matter particles mgas~6x10^4 Msolar and mdark~3.5x10^5 Msolar Softening 0.14 kpc The gas distribution of the Local Group on large scales (left picture, about 2 Mpc/h across, viewed from a distance of 3.3 Mpc/h) and the gas disks of the three main galaxies (right panels, about 50 kpc/h across, from a distance of 250 kpc/h).For the zoomed pictures the colour mapping is shifted to higher densities (factor 10^0.5) in order to enhance the spiral arm features of the gas disks. (K. Riebe ; PMViewer )
, Andromeda (M31) and Triangulum (M33). SPH-GADGET2 (Springel 2005) code with cosmic ionizing UV background, star formation, Supernova feedback and isotropic winds. Zoom-in technique with a. Low res region = box of 64/h Mpc on a side. High res region = roughly spherical of 2/h Mpc radius. Initially, 53 millon gas plus dark matter particles. mgas~6x10^4 Msolar and mdark~3.5x10^5 Msolar. Softening 0.14 kpc. The gas distribution of the Local Group on large scales (left picture, about 2 Mpc/h across, viewed from a distance of 3.3 Mpc/h) and the gas disks of the three main galaxies (right panels, about 50 kpc/h across, from a distance of 250 kpc/h).For the zoomed pictures the colour mapping is shifted to higher densities (factor 10^0.5) in order to enhance the spiral arm features of the gas disks. (K. Riebe ; PMViewer )")
23
Gas 2Mpc/h 50 kpc/h Image credit K. Riebe

24
Dark Matter 1.3 Mpc/h per side G. Yepes

25
Star Formation Rate We exclude form our sample all
satellite galaxies and we focus only on central galaxies of halos with M>10^10 Msolar. Galaxy properties are computed within the galactic radius rgal=0.15 r200 Simulated Local Group galaxies show a wide range of star formation rates. Two groups are distinguishable: Those that are forming stars at rates roughly comparable to their past average (green triangles) 2) Those where star formation has largely ceased (red circles) Star Formation Rate Galaxy Stellar Mass Benitez-Llambay et al 2013
 2) Those where star formation has. largely ceased (red circles) Star Formation Rate. Galaxy Stellar Mass. Benitez-Llambay et al")
26
Age Distribution Galaxies with on-going star formation
Star formation history of galaxies affected by cosmic web stripping of their gaseous envelopes (right-hand panel). The histograms there show the distribution of stellar ages of three galaxies whose trajectories are tracked in Figure 1. All of these systems traverse a large-scale “pancake” at roughly the same time, z ∼ 2, when they are stripped of most of their gas. Without this reservoir, star formation ceases soon thereafter, once the dense gas that remains is transformed into stars. By contrast, star formation in halos that are not affected by cosmic web stripping is able to continue until the present. These are galaxies that do not cross any major filament during their evolution, or that are massive enough to resist stripping. Three examples are shown in the left-hand panel. Galaxies with on-going star formation Galaxies that stopped forming stars Benitez-Llambay et al 2013
. The histograms there show the distribution of stellar ages of three galaxies whose trajectories are tracked in Figure 1. All of these systems traverse a large-scale pancake at roughly the same time, z ∼ 2, when they are stripped of most of their gas. Without this reservoir, star formation ceases soon thereafter, once the dense gas that remains is transformed into stars. By contrast, star formation in halos that are not affected by cosmic web stripping is able to continue until the present. These are galaxies that do not cross any major. filament during their evolution, or that are massive enough to resist stripping. Three examples are shown in the left-hand panel. Galaxies with on-going star formation. Galaxies that stopped forming stars. Benitez-Llambay et al")
27
Baryonic Content Simulated galaxies where star
formation has largely ceased (red circles) have lost most of their baryons. None of these galaxies has retained more than ~20% of the baryons within their virial radius. Baryonic (Gas + Stars) Mass inside Virial Radius Stellar mass within the galactic radius (top left) and total baryonic mass within the virial radius (bottom left) as a function of halo virial mass. The top-right panel shows the present-day star formation rate as a function of galaxy stellar mass. Two populations are identified: (1) galaxies that form stars at rates comparable to their past average (red triangles) and (2) those where star formation has largely ceased (red circles). Galaxies in the latter group have lost more than ∼80% of their available baryons. At the given halo mass, these galaxies have formed substantially fewer stars than their star-forming counterparts, suggesting that the loss of baryons and lack of star formation are not due to feedback from evolving stars. Halo Virial Mass Benitez-Llambay et al 2013
 have lost most of their baryons. None of these galaxies has retained. more than ~20% of the baryons within. their virial radius. Baryonic (Gas + Stars) Mass inside Virial Radius. Stellar mass within the galactic radius (top left) and total baryonic mass within the virial radius (bottom left) as a function of halo virial mass. The top-right. panel shows the present-day star formation rate as a function of galaxy stellar mass. Two populations are identified: (1) galaxies that form stars at rates comparable to. their past average (red triangles) and (2) those where star formation has largely ceased (red circles). Galaxies in the latter group have lost more than ∼80% of their. available baryons. At the given halo mass, these galaxies have formed substantially fewer stars than their star-forming counterparts, suggesting that the loss of baryons. and lack of star formation are not due to feedback from evolving stars. Halo Virial Mass. Benitez-Llambay et al")
28
Mass Evolution Evolution of mass within the virial
Radius for galaxy number 30. Most of the baryons are lost over a short period of time 2<z<3. The lost of baryons is the main reason why this galaxy has stopped forming stars. Mass inside Virial Radius The evolution of the mass within the virial radius of one such galaxy (galaxy “30”) illustrates the sudden loss of baryons that results from ram pressure arising from crossing a large-scale pancake at z ∼ 2 (bottom right). The virial mass more than doubles thereafter, but the total baryonic mass barely grows; at z = 0 the baryon content of this halo is less than 10% that expected from the universal ratio. Time in Gyrs Benitez-Llambay et al 2013
 illustrates. the sudden loss of baryons that results from ram pressure arising from crossing a large-scale pancake at z ∼ 2 (bottom right). The virial mass more than doubles. thereafter, but the total baryonic mass barely grows; at z = 0 the baryon content of this halo is less than 10% that expected from the universal ratio. Time in Gyrs. Benitez-Llambay et al")
29
Gas Temporal Evolution
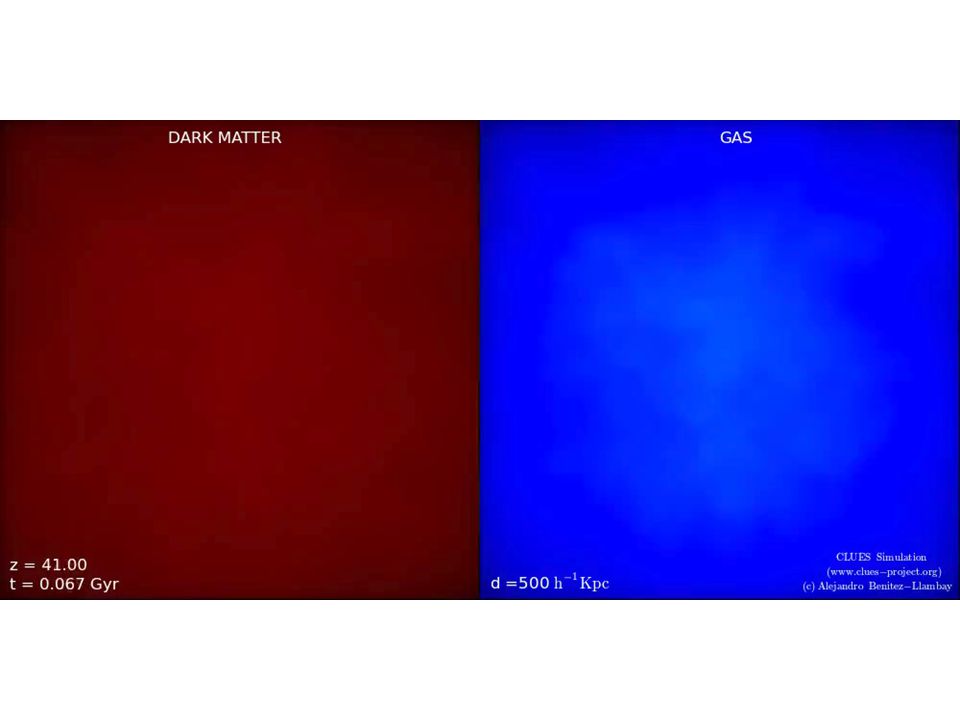
Benitez-Llambay et al 2013 Z=5.08 Z=3.01 Z=2.51 Z=1.80 Z=0.75 Z=0.00

30
Trajectories of galaxies
Benitez-Llambay et al 2013 This evolution of the gaseous component is similar to that of the dark matter (not shown) when viewed on these large scales, and shows the early development of highly aspherical features such as filaments and pancakes that characterize structure formation in LambdaCDM. This figure reveals a common feature in the evolution of these three galaxies: they all cross more or less simultaneously a large pancake of gas at z ∼ 2. Sudden loss of baryons that results from ram pressure arising from crossing a large-scale pancake at z ∼ 2
 when viewed on these large scales, and shows the early development of highly aspherical features such as filaments and pancakes that characterize structure formation in LambdaCDM. This figure reveals a common feature in the evolution of these three galaxies: they all cross more or less simultaneously a large pancake of gas at z ∼ 2. Sudden loss of baryons that results from ram pressure arising from crossing a large-scale pancake at z ∼ 2.")
31
Ram Pressure Gunn & Gott 1972
Image Credit: H. Crowl (Yale University) and WIYN/NOAO/AURA/NSF Abadi et al 1999
 and WIYN/NOAO/AURA/NSF. Abadi et al")
32
Ram Pressure Benitez-Llambay et al 2013 P ~ ρ V^2
Details of the ram-pressure stripping of galaxy 17. The left panels show the projected gas distribution in a cube 1.2 comoving Mpc on a side, centered on the galaxy. The projection is identical to that of Figure 1 and has been chosen so that the “pancake” that forms early on is approximately perpendicular to the z-axis. The colors indicate gas density in a logarithmic scale, normalized to the mean baryonic density of the Universe at that time, ρb(z) = Ωb ρcrit(z). The middle panels show the gas density along the narrow vertical cylinder indicated by the dashed lines in the left panels. The right-hand panels indicate the z-component of the gas velocity along the cylinder in the rest frame of the galaxy. The vertical dashed lines in the right-hand panels indicate the current virial velocity of galaxy 17. Each row corresponds to a different time, chosen to illustrate just before and just after galaxy 17 plows through the pancake, losing most of its gas. Although the pancake is less dense than the galaxy, their relative velocity is nearly 10 times the virial velocity of the galaxy. The resulting ram pressure strips most of the gas off the galaxy, leaving behind “streams” of gas that are effectively lost.
 = Ωb ρcrit(z). The middle panels. show the gas density along the narrow vertical cylinder indicated by the dashed lines in the left panels. The right-hand panels indicate the z-component of the gas. velocity along the cylinder in the rest frame of the galaxy. The vertical dashed lines in the right-hand panels indicate the current virial velocity of galaxy 17. Each row. corresponds to a different time, chosen to illustrate just before and just after galaxy 17 plows through the pancake, losing most of its gas. Although the pancake is less. dense than the galaxy, their relative velocity is nearly 10 times the virial velocity of the galaxy. The resulting ram pressure strips most of the gas off the galaxy, leaving. behind streams of gas that are effectively lost.")
33
More Examples Benitez-Llambay et al 2013

35
Conclusions Abundance matching implies that galaxy formation must become extremely inefficient below 10^10 Msolar in order to reconcile the galaxy stellar mass function with dark halo mass function on galactic scales. Many of the galaxies in our sample have enclosed masses much lower than expected from haloes as massive as 10^10 Msolar ”Cosmic web stripping” enables the removal of baryons from low-mass halos without appealing to feedback or reionization. May help to explain the scarcity of dwarf galaxies compared with the numerous low-mass halos expected in the CDM and the large diversity of star formation histories and morphologies characteristic of faint galaxies. Further simulations and observational evidence needed.

Similar presentations
To what extent,>")


>")


