Download presentation
Presentation is loading. Please wait.

1
Strategic challenges in India’s water management Presented to Green Business Council, Federation of Indian Chambers of Commerce and Industry, Hyderabad, 17 June 2004.

2
Strategic Challenges in India’s Water Management Christopher Scott International Water Management Institute www.iwmi.org

3
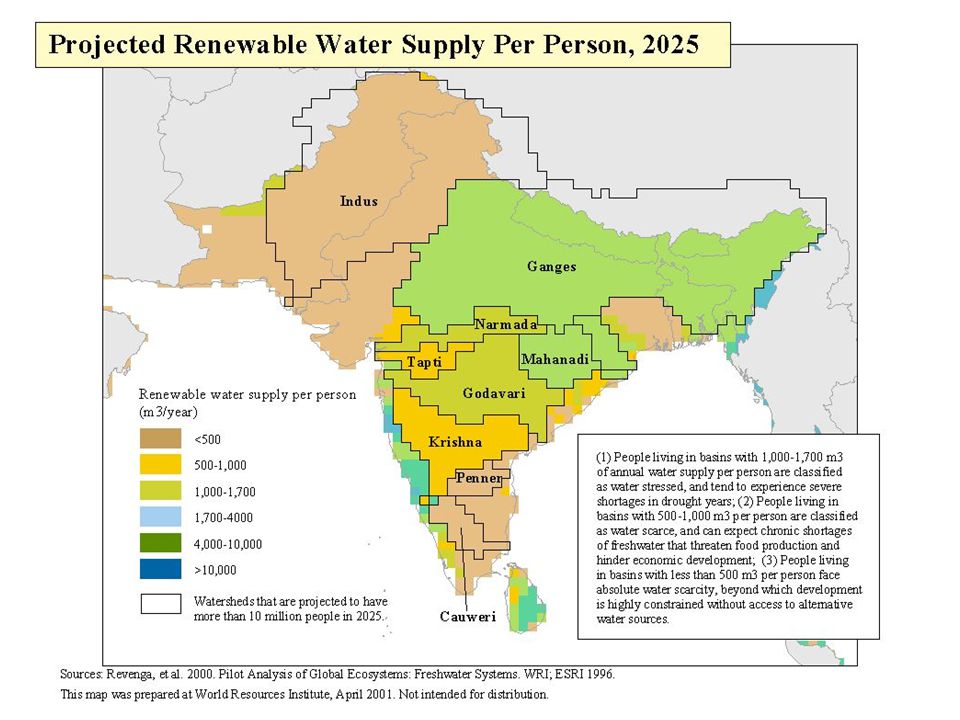
Absolute Water Scarcity: India’s Upcoming Challenge 3/4 th of India, Pakistan, West Asia, North Africa and North China will be in the throes of absolute water scarcity over the coming 25 years Low rainfall/capita is the crux; 80% of it falls in less than 100 hours; storing it for 8 months in a climate of high mean temperatures, high windspeeds and low stream density is the challenge.

4
Western & Peninsular India and North China Plains have Low Precipitation and Dense Population

8
Krishna Basin NDVI (AVHRR) May-2001Jul-2001 Mar-2001Jan-2001Nov-2000 Sep-2001
 May-2001Jul-2001 Mar-2001Jan-2001Nov-2000 Sep-2001")
9
Drivers of India’s Water Future 2025 Population Growth Urbanization Economic Growth Agrarian growth and food production Technology-trade factors Plus.. New approaches, mindsets, Institutions and policies

10
2002: 707 functioning wells/64 km 2 (11/km 2 = 300m spacing). Shift from valley bottoms to watershed-wide distribution. 2002 NGRI 1995 1985 Well Density Increasing

11
2 Indias: Differential Development

12
2 Indias: Water Endowments

13
Repast of the Water Sector India has been a ‘hydraulic society’ for millennia Indus civilization Tank-based empires British era Modern India, since Independence: Over Rs. 1,00,000 crore invested in dams and canals Rs. 24,000 crore per annum in power supply to agriculture

14
“Tanks” in India

15
Runoff Capture (Harvesting)
")
16
Lower Krishna River Gauge Flow

17
A river basin’s hydrology shapes its challenge. In Rhine and Omonagawa, rainfall always exceeds ET; in Murray-Darling, it never does; in Chad, Fuyag and Sabarmati, it does for a few months. Potential ETRain fall

18
Global Groundwater Use

19
Groundwater Use in India Has more to do With population Density than the Availability of the resource NO COUNTRY IN THE WORLD PUMPS AS MUCH GROUNDWATER AS WE DO...WE ALREADY HAVE 21 M WELLS AND ADD 1 M/YEAR.

20
At current rate, Groundwater use will Ease out all other Sources of water.. This indicates the Failure of public Systems.. It will also redefine India’s water challenge

21
Groundwater Bust

22
Groundwater Depletion: The ‘wild-card’ of India’s Water Future

23
Water-Energy Nexus in India 30% of India’s power used to pump groundwater Power utilities bankrupt ($ 5 billion annual operating deficits) Booming groundwater economy Rationed power supply with pricing a powerful power sector remedy plus an indirect tool for GW regulation
 Booming groundwater economy Rationed power supply with pricing a powerful power sector remedy plus an indirect tool for GW regulation")
24
Twin East-West Energy and Water Divides in India

25
Demand Elasticity, Power & Water Electricity tariff Andhra Pradesh Tamil Nadu /kwhRiceSugarcaneRiceSugarcane Rs. 0.50 ($0.01) - 0.3187 - 0.2572 - 0.3396 - 0.2984 Rs. 0.75 ($0.015) - 0.4085 - 0.3564 - 0.4414 - 0.3879 Rs. 1.00 ($0.02) - 0.5967 - 0.4768 - 0.6388 - 0.4925
 Rs ($0.015) Rs ($0.02)")
26
Price/Unit Opportunity Cost/Unit Quantity of Water & Power P’ n Supply w,n = MC n Demand w,n = MVP w P’ w QoQo expands social welfare Supply’ w1,n = MC’ n Q1Q1 Innovation that reduces metering cost to zero Flatrate produces benefits for buyers The same effect is produced by charging flatrate & restricting power use to Q 1 Water, Energy Demand

27
Price/Unit Opportunity Cost/Unit Quantity of Water & Power P’ n Supply w,n = MC n Demand w,n = MVP w P’ w QoQo Supply’ w1,n = MC’ n Q1Q1 Raising FR to cover that loss will not help Q Max Degenerate flatrate: In absence of rationing, farmers expand water use to Q Max This reduces total welfare. WASTE Flat Rate with Rationing

28
Ag. Power Tariffs in 2 Indian States State Pump Capacity (horsepower) Drought Prone Districts Others Andhra Pradesh (equivalent tariff recovery = Rs. 0.18/kWh = $ 0.004/kWh) Up to 3 HP Rs. 225/hp/yr ($ 4.69) Rs. 275/hp/yr ($ 5.73) 3-5 HP Rs. 375/hp/yr ($ 7.81) Rs. 425/hp/yr ($ 8.85) 5-10 HP Rs. 475/hp/yr ($ 9.90) Rs. 525/hp/yr ($ 10.94) 10 and above Rs. 525/hp/yr ($ 10.94) Rs. 625/hp/yr ($ 13.02) Tamil Nadu Free electricity
 Drought Prone Districts Others Andhra Pradesh (equivalent tariff recovery = Rs. 0.18/kWh = $ 0.004/kWh) Up to 3 HP Rs. 225/hp/yr ($ 4.69) Rs. 275/hp/yr ($ 5.73) 3-5 HP Rs. 375/hp/yr ($ 7.81) Rs. 425/hp/yr ($ 8.85) 5-10 HP Rs. 475/hp/yr ($ 9.90) Rs. 525/hp/yr ($ 10.94) 10 and above Rs. 525/hp/yr ($ 10.94) Rs. 625/hp/yr ($ 13.02) Tamil Nadu Free electricity.")
29
Urbanization By 2050, over half of India’s projected 1.5 billion population will live in cities … close to 1 billion urban residents… … growing wastewater volumes… Sticker shock: 73% of urban wastewater in India is untreated, requiring US$ 65 billion or ten times greater than what the govt. proposes to invest (Infrastructure Development Finance Corp., 2003).
..")
30
India: Key Water Sector Challenges Meeting water demand of agriculture, domestic, industrial and environmental sector Infrastructure creation and management Water quality issues Groundwater depletion

31
Agrarian Societies Industrial Societies Post-industrial societies Self-provisionPublic systemsPublic/Market Provision ‘Informal sector’Public UtilityWater Industry heavily subsidizedCost recovery priceEconomic price Free and plentifulFree and scarcePriced & plentiful Household capital dominates Govt capital dominates Corporate capital dominates No recyclingRecycling without treatment Treatment and recycling Hydraulic Infrastructure ResourceService provision

32
Challenges Strategies Food Security Improve water productivity in agric. Better dry land farming Virtual water trade-internal and global GM and other technology? Rural Poverty Off-farm livelihoods Crop/drop > crop+jobs+cash/drop Growth of the non-farm economy Urban water supply and sanitation + water pollution Quantum jump in investment Much improved planning and mgmt Institutional reform-public/private partnership Pricing strategies

33
Groundwater depletion and/or quality deterioration Coping (salinity, fluoride, arsenic, nitrates) Imports of water: River- linking Project Groundwater demand management Decentralized rainwater harvesting and recharge Challenges Strategies
 Imports of water: River- linking Project Groundwater demand management Decentralized rainwater harvesting and recharge Challenges Strategies")
34
Thank you.

Similar presentations


 Kevin Cleaver Director of Agriculture and Rural Development November 2004.>")
