Download presentation
Presentation is loading. Please wait.

1
Institut Henri Poincare, Session on Granular Materials 5 January to 8 April 2005 Thematic Meeting, 24-25 February: Instabilities, Bifurcations, Localization Large scale localization: Thermal weakening of faults during seismic slip James R. Rice Department of Earth and Planetary Sciences and Division of Engineering and Applied Sciences Harvard University Lecture 2, 25 February 2005 Downloads: Lecture 1 (yesterday): http://esag.harvard.edu/rice/IHP_granular_Rice_Lect1_05.ppthttp://esag.harvard.edu/rice/IHP_granular_Rice_Lect1_05.ppt Lecture 2 (today): http://esag.harvard.edu/rice/IHP_granular_Rice_Lect2_05.ppthttp://esag.harvard.edu/rice/IHP_granular_Rice_Lect2_05.ppt
: Lecture 2 (today):")
2
Fault Zone Processes during Seismic Slips Questions: How does shear stress ( ) vary with slip ( ) during earthquakes? Focus is on rapid, large slip -- i.e., >> slips of order 0.01 mm to 0.1 mm at which events are thought to nucleate -- according to rate & state concepts. What are the physical mechanism of weakening during slip? Suggested here: Thermal pressurization of pore fluid and Flash heating at highly stressed frictional contacts are the primary mechanisms. Both seem to be important. Melting may occur too for large, deep slips. What fracture energy (G) is implied by the vs. relation? Important because we can thereby test any proposed vs. against seismic constraints on G.
 is implied by the vs. relation. Important because we can thereby test any proposed vs. against seismic constraints on G..")
3
Relation of fracture energy to slip weakening properties: initial stress residual strength (may not be well defined) peak strength
 peak strength")
4
Background for theoretical modeling of stress vs. slip relation: Field observations of exposures of mature, highly slipped fault zones: Slip in individual events occurs primarily within a thin shear zone (h < 1-5 mm), within a finely granulated (ultracataclastic, possibly clayey) fault core that is of order 10s to 100s mm thickness. [that despite the existence of much wider, 1 to 100 m, damage zones (with granulation, pervasive cracking and/or minor faulting)] Hypotheses: Earthquake failure occurs in a water-saturated fault zone. It has material properties (permeability, porosity, poroelastic) like those inferred from lab studies of fault materials from the Median Tectonic Line (MTL) and Nojima faults in Japan. [locations for which relatively complete data exists]
, within a finely granulated (ultracataclastic, possibly clayey) fault core that is of order 10s to 100s mm thickness. [that despite the existence of much wider, 1 to 100 m, damage zones (with granulation, pervasive cracking and/or minor faulting)] Hypotheses: Earthquake failure occurs in a water-saturated fault zone. It has material properties (permeability, porosity, poroelastic) like those inferred from lab studies of fault materials from the Median Tectonic Line (MTL) and Nojima faults in Japan. [locations for which relatively complete data exists].")
5
10s-100s mm (But principal failure surface is much thinner, typically < 1-5 mm!) 1-10 m (Sometimes described as foliated gouge, or for some faults, simply as gouge.) 30-100 m (Damage ≈ highly cracked rock. Zone with macro faults or fractures extends ~ 10 x further.) F. Chester, J. Evans and R. Biegel, J. Geoph. Res., 98 (B1), 771-786 (1993)
 F. Chester, J. Evans and R. Biegel, J. Geoph. Res., 98 (B1), (1993).")
6
J.Geophys. Res. (1993)
")
7
Chester, F. M., and J. S. Chester, Ultracataclasite structure and friction processes of the Punchbowl fault, San Andreas system, California, Tectonophysics, 295 (1-2): 199-221,1998 Prominent slip surface (pss) is located in the center of the layer and identified by the black arrows.
: ,1998 Prominent slip surface (pss) is located in the center of the layer and identified by the black arrows..")
8
from J. S. Chester and D. L. Goldsby, SCEC Ann. Rpt., 2003 Punchbowl Fault prominent slip surface mm-thick layer; crystal-lattice preferred orientation (evidence: uniform birefringence, bright layer); contains distinct microscopic slip surfaces.
; contains distinct microscopic slip surfaces..")
9
Median Tectonic Line Fault (MTL), Japan
, Japan")
10
h ≈ 3 mm Wibberley (priv. commun., 2003) Median Tectonic Line Fault, Japan
 Median Tectonic Line Fault, Japan")
11
Gas permeability data from the first pressure cycle; p = 20 MPa. Permeability, k ( m 2 ) (Wibberley and Shimamoto, JSG, 2003) permeability of clay gouge containing the central slip zone, Median Tectonic Line Fault, Japan
 (Wibberley and Shimamoto, JSG, 2003) permeability of clay gouge containing the central slip zone, Median Tectonic Line Fault, Japan.")
12
Lockner, Naka, Tanaka, Ito and Ikeda, “Permeability and strength of core samples from the Nojima fault of the 1995 Kobe earthquake”, USGS Open File Rpt. 00-129, 2000 10 –19 m 2 10 –17 m 2 10 –19 m 2 10 –17 m 2 10 –19 m 2 10 –17 m 2

13
Lockner et al., USGS (2000)
")
14
Governing equations, 1-space-dimension shearing field, constant normal stress n : temperature pore pressure velocity heat flux fluid mass flux

15
Origin, poro-thermo-elastic calculations to express dm/dt : inelastic dilatancy rate (Should evaluate n and n for condition fault-normal stress n = const., and fault-parallel strains || = 0, using poro-thermoelastic theory.) storage factor thermal pressurization factor Form of fluid mass conservation equation, in terms of p and T: storage factor thermal pressurization factor inelastic dilatancy rate
 storage factor thermal pressurization factor Form of fluid mass conservation equation, in terms of p and T: storage factor thermal pressurization factor inelastic dilatancy rate")
16
Two simple models, shear zone of fixed thickness h (including case h 0) Building on: Sibson (1973), Lachenbruch (1980), Mase & Smith (1985, 1987), Rudnicki & Chen (1988), Segall & Rice (1995), Sleep (1995), Andrews (2002), Vardoulakis (2002), Garagash & Rudnicki (2003) heat flux fluid mass flux
 Building on: Sibson (1973), Lachenbruch (1980), Mase & Smith (1985, 1987), Rudnicki & Chen (1988), Segall & Rice (1995), Sleep (1995), Andrews (2002), Vardoulakis (2002), Garagash & Rudnicki (2003) heat flux fluid mass flux")
19
Temperature on fault plane Pore pressure on fault plane

21
Note multi-scale nature of the slip-weakening; no well-defined D c :

22
(Plot thanks to Alan Rempel)
")
23
Take: V = 1 m/s, th = 1 mm 2 /s, f = 7 x 10 –10 /Pa, f = 10 –4 Pa-s Low end of poromechanical parameter range: [lab exp's on undisturbed, confined MTL samples] k = 10 –20 m 2, n = 0.04, n / f = 1 ( => hy = 1.8 mm 2 /s, T max – T amb = 2.9 ( n – p o ) ºC / MPa ) : L* ≈ 4 mm if f = 0.25 (flash heating) High end of poromechanical parameter range: [k, n increased due to stressing and damage at tip of propagating rupture (Poliakov et al., 2002; Rice et al., 2004] k = 10 –19 m 2, n = 0.04, n / f = 2 ( => hy = 12 mm 2 /s, T max – T amb = 8.4 ( n – p o ) ºC / MPa ) : L* ≈ 30 mm if f = 0.25 (flash heating)
![Take: V = 1 m/s, th = 1 mm 2 /s, f = 7 x 10 –10 /Pa, f = 10 –4 Pa-s Low end of poromechanical parameter range: [lab exp s on undisturbed, confined MTL samples] k = 10 –20 m 2, n = 0.04, n / f = 1 ( => hy = 1.8 mm 2 /s, T max – T amb = 2.9 ( n – p o ) ºC / MPa ) : L* ≈ 4 mm if f = 0.25 (flash heating) High end of poromechanical parameter range: [k, n increased due to stressing and damage at tip of propagating rupture (Poliakov et al., 2002; Rice et al., 2004] k = 10 –19 m 2, n = 0.04, n / f = 2 ( => hy = 12 mm 2 /s, T max – T amb = 8.4 ( n – p o ) ºC / MPa ) : L* ≈ 30 mm if f = 0.25 (flash heating)](http://images.slideplayer.com/13/3843787/slides/slide_23.jpg "Take: V = 1 m/s, th = 1 mm 2 /s, f = 7 x 10 –10 /Pa, f = 10 –4 Pa-s Low end of poromechanical parameter range: [lab exp s on undisturbed, confined MTL samples] k = 10 –20 m 2, n = 0.04, n / f = 1 ( => hy = 1.8 mm 2 /s, T max – T amb = 2.9 ( n – p o ) ºC / MPa ) : L* ≈ 4 mm if f = 0.25 (flash heating) High end of poromechanical parameter range: [k, n increased due to stressing and damage at tip of propagating rupture (Poliakov et al., 2002; Rice et al., 2004] k = 10 –19 m 2, n = 0.04, n / f = 2 ( => hy = 12 mm 2 /s, T max – T amb = 8.4 ( n – p o ) ºC / MPa ) : L* ≈ 30 mm if f = 0.25 (flash heating)")
24
Poroelastic effects included; Skempton B = 0.6 [ p = – B )/3 ] [Rice et al. (to BSSA,2003), building on Poliakov et al. (JGR, 2002)] YELLOW = shear failure RED = tensile failure For R/L = 0.1, and r / p = 0.2 (nearly complete strength loss) Scale length in plots: (R o * ) avg = 20-30 m, R o * = 1-70 m, fitting model to Heaton (1990) earthquake set, assuming f p = 0.6 and hydrostatic initial pore pressure.
![Poroelastic effects included; Skempton B = 0.6 [ p = – B )/3 ] [Rice et al.](http://images.slideplayer.com/13/3843787/slides/slide_24.jpg "(to BSSA,2003), building on Poliakov et al. (JGR, 2002)] YELLOW = shear failure RED = tensile failure For R/L = 0.1, and r / p = 0.2 (nearly complete strength loss) Scale length in plots: (R o * ) avg = m, R o * = 1-70 m, fitting model to Heaton (1990) earthquake set, assuming f p = 0.6 and hydrostatic initial pore pressure..")
25
Common parameters for all predictions shown: c th = 1 mm 2 /s, f = 7 x 10 –10 /Pa, f = 10 –4 Pa-s, n – p o = 126 MPa (7 km depth), f = 0.25 (flash heating), V = 1 m/s Low-end poromechanical parameters: k = 10 –20 m 2, n = 0.04, n / f = 1, hy = 1.8 mm 2 /s : L* ≈ 4 mm High-end poromechanical parameters: k = 10 –19 m 2, n = 0.04, n / f = 2, hy = 12 mm 2 /s : L* ≈ 30 mm Comparison, Model 2 (Slip on a plane): Predictions of G and seismic estimates
, f = 0.25 (flash heating), V = 1 m/s Low-end poromechanical parameters: k = 10 –20 m 2, n = 0.04, n / f = 1, hy = 1.8 mm 2 /s : L* ≈ 4 mm High-end poromechanical parameters: k = 10 –19 m 2, n = 0.04, n / f = 2, hy = 12 mm 2 /s : L* ≈ 30 mm Comparison, Model 2 (Slip on a plane): Predictions of G and seismic estimates")
26
Rice, EOS, Trans. AGU, 1999 Beeler & Tullis, manuscript, 2003 Aside on frictional weakening by flash heating

29
Melting does not necessarily weaken!

30
Weakening of friction coefficient f at high slip rates Results here for Arkansas novaculite (~100% quartzite), determined in rotating annular specimens Tullis and Goldsby (2003a,b), up to 0.36 m/s Prakash (2004), 2 to 4 m/s Slip rates V up to 0.36 m/s imposed in Instron testing frame for 45 mm slip, after 1.2 mm pre-slip at ~10 m/s. At low V, friction coefficient f ≈ 0.65, whereas at V > 0.3 m/s, f ≈ 0.3. Comparable rate-weakening was found for granite, Tanco albite (~100% feldspar), and gabbro, but ambiguous results for calcite. Pre-twisted torsional Kolsky bar (split Hopkinson bar) imposes slip at V ~ 3-4 m/s, resulting in f slightly less than 0.2. Experiment becomes uninterpretable after small slip (marked) due to cracking in wall of specimen.
, and gabbro, but ambiguous results for calcite. Pre-twisted torsional Kolsky bar (split Hopkinson bar) imposes slip at V ~ 3-4 m/s, resulting in f slightly less than 0.2. Experiment becomes uninterpretable after small slip (marked) due to cracking in wall of specimen..")
31
from T. E. Tullis and D. L. Goldsby, SCEC Ann. Rpt., 2003 Arkansas Novaculite (Quartzite) [rotary shear, 1.2 mm slow pre-slip (10 m/s), then 45 mm of fast slip]
 [rotary shear, 1.2 mm slow pre-slip (10 m/s), then 45 mm of fast slip].")
32
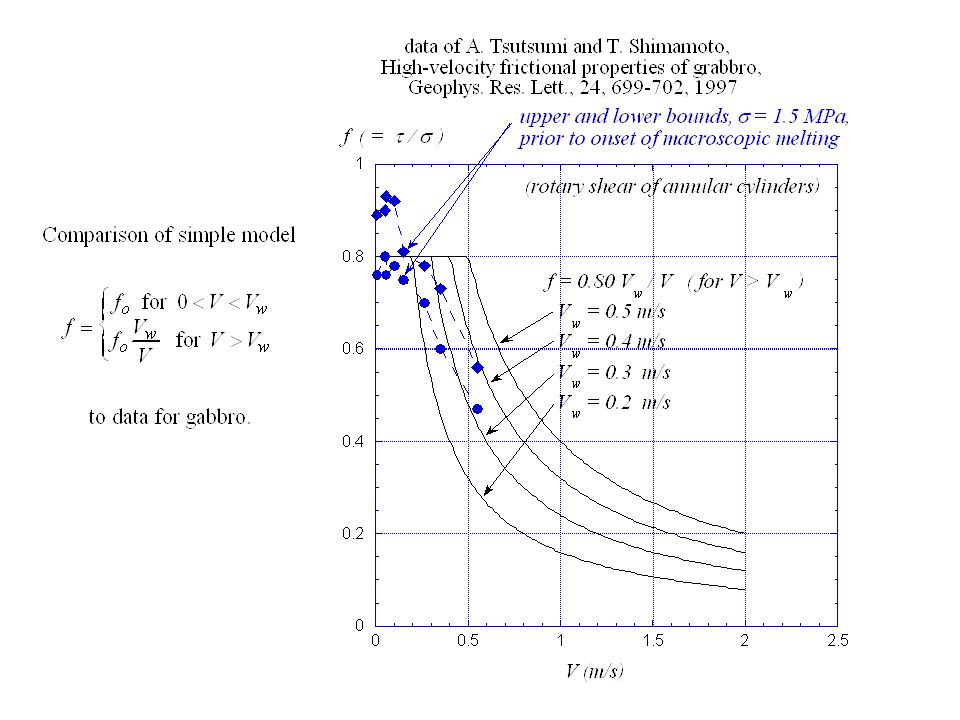
from T. E. Tullis and D. L. Goldsby, SCEC Ann. Rpt., 2003 Westerly GraniteGabbro (of Tsutsumi & Shimamoto) Also seen in Granite, Tanco Feldspar & Gabbro, but just weakly/ambiguously in Calcite.
 Also seen in Granite, Tanco Feldspar & Gabbro, but just weakly/ambiguously in Calcite..")
33
from Vikas Prakash, SCEC Ann. Mtg., 2004 Schematic illustration of the torsional Kolsky bar apparatus

34
Seismic estimates of fracture energy (G): Method A (Rice, Sammis and Parsons, BSSA, in press 2004-05), Use of seismic slip inversion results from Heaton (PEPI, 1990):
: Method A (Rice, Sammis and Parsons, BSSA, in press ), Use of seismic slip inversion results from Heaton (PEPI, 1990):")
36
F 1 (R/L) varies by a factor of two as R / L varies from 0 + to 1. Elastodynamic stress and displacement field solution used to estimate G [Rice, Sammis & Parsons (BSSA, in press 2004-05); generalization of Broberg (GJRAS, 1978), Freund (JGR, 1979), Heaton (EPSL, 1990), Poliakov, Dmowska & Rice (JGR, 2002)] denotes parameter estimated from seismic slip inversion, Heaton (1990) -- L, and v r
; generalization of Broberg (GJRAS, 1978), Freund (JGR, 1979), Heaton (EPSL, 1990), Poliakov, Dmowska & Rice (JGR, 2002)] denotes parameter estimated from seismic slip inversion, Heaton (1990) -- L, and v r.")
38
Fracture energies G and slips , large earthquakes (arranged in order of slip magnitude) M o l w G Event 10 18 Nm kmkmmMJ/m 2 Michoacan 1985 (M=8.1) 1,500 1501202.86.6Heaton; Rice, Sammis & Parsons Landers 1992 (M=7.1) 56 60142.25.0Peyrat, Olsen & Madariaga San Fernando 1971 (M=6.5) 7 12141.46.9Heaton; Rice, Sammis & Parsons Borah Peak 1983 (M=7.3) 23 40200.962.9Heaton; Rice, Sammis & Parsons Kobe 1995 (M=6.9) 22 48200.781.5Guaterri, Spudich & Beroza Imperial Valley 1979 (M=6.5) 5 30100.561.3Heaton; Rice, Sammis & Parsons Imperial Valley 19790.81Favreau & Archuleta Morgan Hill 1984 (M=6.2) 2.1 20 80.442.0Heaton; Rice, Sammis & Parsons Morgan Hill 19842.0Beroza & Spudich N. Palm Springs 1986 (M=6.0) 1.8 18100.330.15Heaton; Rice, Sammis & Parsons Coyote Lake 1979 (M=5.9) 0.35 6 60.320.57Heaton; Rice, Sammis & Parsons For Rice, Sammis & Parsons events, the G values are averages of their G min and G max (= 2 G min ); i.e., G = 1.5 G min.
 Heaton; Rice, Sammis & Parsons Coyote Lake 1979 (M=5.9) Heaton; Rice, Sammis & Parsons For Rice, Sammis & Parsons events, the G values are averages of their G min and G max (= 2 G min ); i.e., G = 1.5 G min..")
39
Seismically inferred fracture energies G vs. slips , large earthquake data set. Compared to theoretical predictions, Model 2 (slip on a plane), based on high-end (L* = 30 mm) and low-end (L* = 4 mm) parameter values, and on f = 0.25 and n – p o = 126 MPa. [Large earthquake data set (symbols): RSP results, shown as G avg here, for Heaton (1990) event set, with separate estimates for Morgan Hill 1984 and Imperial Valley 1979 of that set, and for Kobe 1995 and Landers 1992.]
, based on high-end (L* = 30 mm) and low-end (L* = 4 mm) parameter values, and on f = 0.25 and n – p o = 126 MPa. [Large earthquake data set (symbols): RSP results, shown as G avg here, for Heaton (1990) event set, with separate estimates for Morgan Hill 1984 and Imperial Valley 1979 of that set, and for Kobe 1995 and Landers 1992.].")
40
Method B (Abercrombie and Rice, GJI, in press 2004-05), Use of radiated energy, moment, stress drop and slip:
, Use of radiated energy, moment, stress drop and slip:")
41
Abercrombie (JGR, 1995) events, including Hauksson (JGR, 2000) focal mechanisms [figure from Abercrombie and Rice (GJI, in press, 2004-05)]
![Abercrombie (JGR, 1995) events, including Hauksson (JGR, 2000) focal mechanisms [figure from Abercrombie and Rice (GJI, in press, )]](http://images.slideplayer.com/13/3843787/slides/slide_41.jpg "Abercrombie (JGR, 1995) events, including Hauksson (JGR, 2000) focal mechanisms [figure from Abercrombie and Rice (GJI, in press, )]")
42
Abercrombie and Rice (GJI, in press 2004-05)
")
43
Composite data [Abercrombie & Rice (2004), and Rice, Sammis & Parsons (2004) (ovals) based on Heaton (1990) event set]
![Composite data [Abercrombie & Rice (2004), and Rice, Sammis & Parsons (2004) (ovals) based on Heaton (1990) event set]](http://images.slideplayer.com/13/3843787/slides/slide_43.jpg "Composite data [Abercrombie & Rice (2004), and Rice, Sammis & Parsons (2004) (ovals) based on Heaton (1990) event set]")
44
Common parameters for all predictions shown: c th = 1 mm 2 /s, f = 7 x 10 –10 /Pa, f = 10 –4 Pa-s, n – p o = 126 MPa (7 km depth), f = 0.25 (flash heating), V = 1 m/s Low-end poromechanical parameters: k = 10 –20 m 2, n = 0.04, n / f = 1, hy = 1.8 mm 2 /s : L* ≈ 4 mm High-end poromechanical parameters: k = 10 –19 m 2, n = 0.04, n / f = 2, hy = 12 mm 2 /s : L* ≈ 30 mm Comparison, Model 2 (Slip on a plane): Predictions of G and seismic estimates
, f = 0.25 (flash heating), V = 1 m/s Low-end poromechanical parameters: k = 10 –20 m 2, n = 0.04, n / f = 1, hy = 1.8 mm 2 /s : L* ≈ 4 mm High-end poromechanical parameters: k = 10 –19 m 2, n = 0.04, n / f = 2, hy = 12 mm 2 /s : L* ≈ 30 mm Comparison, Model 2 (Slip on a plane): Predictions of G and seismic estimates")
45
Conclusions : Crustal faults are likely to weaken during seismic slip by - shear heating and thermal pressurization of pore fluid and by - flash heating at frictional micro-asperity contacts. The mechanisms are consistent with geological fault zone studies and with laboratory determinations of properties of fault-related materials. They predict fracture energies (G) in the broad range inferred seismically. Predictions have what seems to be an approximately correct scaling with earthquake slip over the entire range from a few mm to a few m. The mechanisms explain why melting does not generally occur at shallow to moderate depths, or may at least be delayed until unusually large slips.
 in the broad range inferred seismically. Predictions have what seems to be an approximately correct scaling with earthquake slip over the entire range from a few mm to a few m. The mechanisms explain why melting does not generally occur at shallow to moderate depths, or may at least be delayed until unusually large slips..")
46
Major questions: - What sets the thickness (h) of the zone of highly localized shear? - What amount of dilatancy ( n pl )? - What is the pore expansivity ( n ) and permeability (k) for shearing gouge? - What predictions to be made when such constitutive laws as derived here are used in dynamic rupture simulations? - What rheology of the “liquefied” gouge resulting when p ≈ n ? Is ≈ 0? - What rheology if melting does begin? - What role for off-fault inelasticity? Are we misinterpreting seismically inferred G?
. - What is the pore expansivity ( n ) and permeability (k) for shearing gouge. - What predictions to be made when such constitutive laws as derived here are used in dynamic rupture simulations. - What rheology of the liquefied gouge resulting when p ≈ n . Is ≈ 0. - What rheology if melting does begin. - What role for off-fault inelasticity. Are we misinterpreting seismically inferred G .")
47
The melting range -- some pictures (Work in progress by A. W. Rempel, L. M. Jacques and J. R. Rice, on “Fault zone drainage, heating and melting during earthquake slip”)
.")
48
Otsuki, Monzawa & Nagase, J. Geophys. Res. (2003)
")
49
Otsuki, Monzawa & Nagase, Fluidization and melting of fault gouge, J. Geophys. Res. (2003): 9 pseudotachylyte-generating events: No or minimal overlap of shear zones P1, …, P9. All 9 shear zones fit within a 20 mm width. Individual zones have h < 2 mm, often < 1 mm.
: 9 pseudotachylyte-generating events: No or minimal overlap of shear zones P1, …, P9. All 9 shear zones fit within a 20 mm width. Individual zones have h < 2 mm, often < 1 mm..")
50
Various degrees of melting: high melting low melting

54
Following in case needed

55
suction from small-slip dilatancy

57
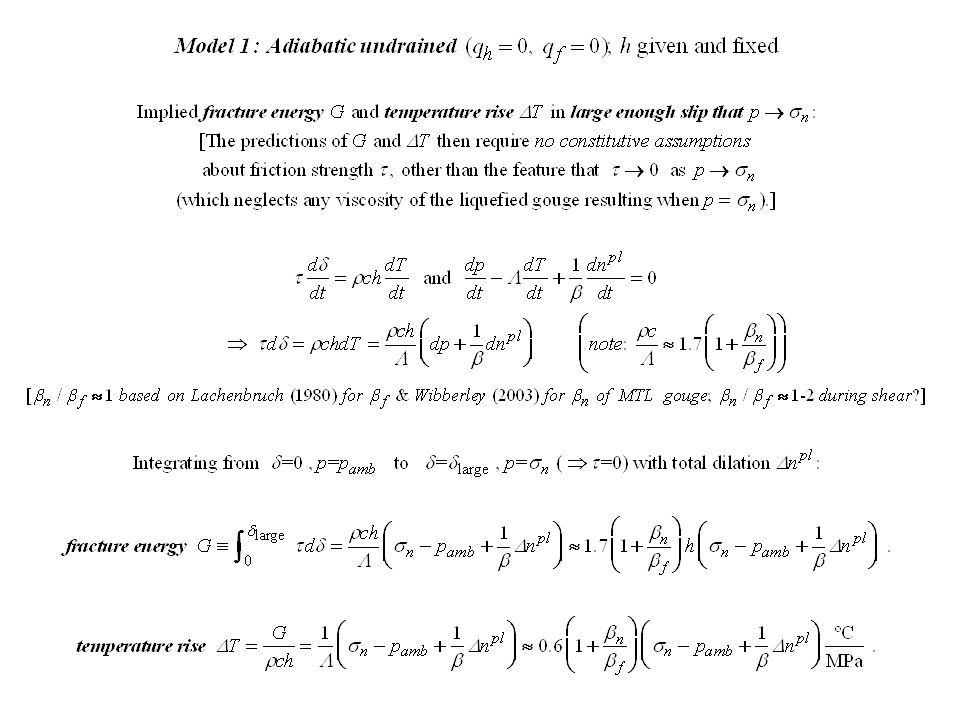
Comparison of Model 1 (adiabatic undrained) predictions of G to seismic estimates: (flash heating)
 predictions of G to seismic estimates: (flash heating)")
59
(Prakash, SCEC Ann. Mtg., 2004; Arkansas novaculite)
")
60
(Plots thanks to Alan Rempel)
")
61
With Kobe 1995 and Landers 1992 included, and separate estimates for Morgan Hill 1984 and Imperial Valley 1979 (RSP results shown as G avg here): 2 points
: 2 points")
62
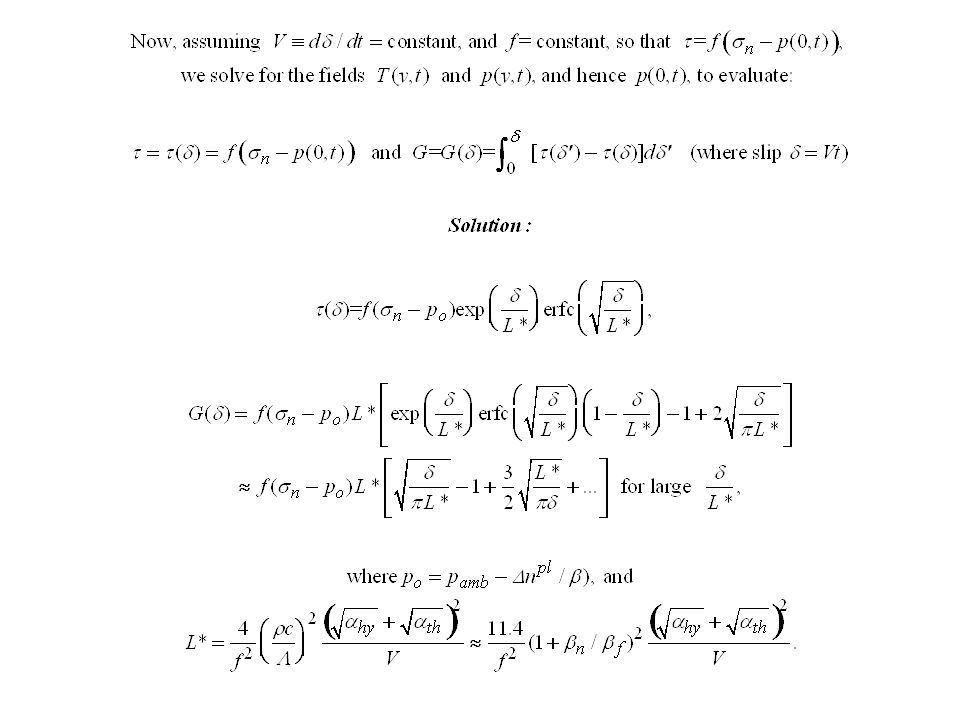
(Rice & Rudnicki, in progress, 2004) Configurational stability of spatially uniform, adiabatic, undrained, shear: (Motivation: Why do zones of localized slip have the thickness that they do?) Governing equations for shearing velocity V(y, t), shear stress (y, t), pore pressure p(y, t), and temperature T(y, t): The spatially uniform solution (Model 1, revisited): Simple rate-strengthening friction model; approximately valid only in stable regions in which rupture cannot nucleate, but may propagate through (or in unstable regions that have shear-heated to a frictionally stable T range). (Fuller rate-state description, with localization limiter, must be used in regions of unstable, rate-weakening, friction.)
.")
63
Linearized perturbation about time-dependent spatially uniform solution: Nature of solution with spatial dependence exp(2 iy/ ): s = s( ) satisfies: Typically of order 20-60, in results of low shear-rate experiments.
: s = s( ) satisfies: Typically of order 20-60, in results of low shear-rate experiments.")
64
Note: High-end here taken as: k = 10 –19 m 2, n = 0.06, n / f = 4, hy = 4.8 mm 2 /s

65
High end poromechanical parameters: (see note, previous page) Low end poromechanical parameters: Implications: Even with velocity strengthening [with f/(b – a) large, e.g., of order > 20], we must expect large shear strain to be confined to a thin zone, less than diffusion penetration distances of heat and fluid in moderate and larger events. Justifies use of Model 2, based on slip on a plane. Observed 1-5 mm deformed zone thickness in gouge is a precursor thickness (i.e., cr based on an initial, broad h) not the thickness of the large shear zone.
![High end poromechanical parameters: (see note, previous page) Low end poromechanical parameters: Implications: Even with velocity strengthening [with f/(b – a) large, e.g., of order > 20], we must expect large shear strain to be confined to a thin zone, less than diffusion penetration distances of heat and fluid in moderate and larger events.](http://images.slideplayer.com/13/3843787/slides/slide_65.jpg "Justifies use of Model 2, based on slip on a plane. Observed 1-5 mm deformed zone thickness in gouge is a precursor thickness (i.e., cr based on an initial, broad h) not the thickness of the large shear zone..")
Similar presentations


 Earthquake Energy Balance>")


, Kazuro Hirahara (2), and Mikio Iizuka.>")


