Download presentation
Presentation is loading. Please wait.

1
BIODIVERSITY Dr. Ashalata Devi Assistant Professor
Dept. of Environmental Science Tezpur University 1

2
Unit: Biodiversity Content Definition
Biodiversity principles, values and threats Protecting biodiversity: legal and non-legal bindings Biodiversity of NE India

3
When we say we want to save the planet, we use the word "biodiversity" to encompass this entire concept - which, granted, is a big one. Biodiversity: Life, the world, the variation of life for the entire globe. Biodiversity found on Earth today consists of many millions of distinct biological species, the product of four billion years of evolution.

4
A symposium in 1986, and the follow-up book BioDiversity (Wilson 1986), edited by biologist E. O. Wilson, carved the way for common acceptance of the word and concept. And as politicians, scientists, and conservationists became more interested in the state of the planet and the amazing complexity of life we became quite attached to this new word.

5
And why were we talking so much about Biodiversity. Simple
And why were we talking so much about Biodiversity? Simple. The world has begun, relatively recently, to lose species and habitats at an ever-increasing and alarming rate. Why? Because of us This is often referred to as the 6th extinction crisis, after the 5 known extinction waves in geological history.

6
Major Five Extinction events include: Cretaceous-Tertiary Extinction Event (75% of all species including the dinosaurs) about 75 million years ago. Triassic–Jurassic Extinction Event (60% of all species including most Achosaurs, Therapsids, and large Amphibians) about 205 million years ago. Permian–Triassic Extinction Event (96% of Aquatic Species including most of the sessile species; and 70% of land species including most Synapsids) 251 million years ago. Late Devonian Extinction Event (70% of all species including most Brachiopods and Trilobites) 360 million years ago. Ordovician–Silurian Extinction Event (80% of all species, mostly brachiopods, bivalves, echinoderms, bryozoans, and corals) 450 million years ago.
 about 205 million years ago. Permian–Triassic Extinction Event (96% of Aquatic Species including most of the sessile species; and 70% of land species including most Synapsids) 251 million years ago. Late Devonian Extinction Event (70% of all species including most Brachiopods and Trilobites) 360 million years ago. Ordovician–Silurian Extinction Event (80% of all species, mostly brachiopods, bivalves, echinoderms, bryozoans, and corals) 450 million years ago..")
7
Figure 1: Timeline of mass extinction events
Figure 1: Timeline of mass extinction events. The five named vertical bars indicate mass extinction events. Black rectangles (drawn to scale) represent global reef gaps and brick-pattern shapes show times of prolific reef growth (Veron 2008).
 represent global reef gaps and brick-pattern shapes show times of prolific reef growth (Veron 2008).")
8
What is biodiversity or biological diversity?
- the sum of total of life forms at all levels of organization in biological system. Article 2 of the CBD defines “Biological diversity means the variability among living organisms from all sources including, inter alia, terrestrial, marine and other aquatic ecosystems and the ecological complexes of which they are part; this includes biological diversity within species and ecosystems”. “Biodiversity includes assemblages of plant, animals and micro-organisms, their genetic variability expressed and populations, their habitats, ecosystems and natural areas, the mosaic of which constitutes the landscape which gives the richness to the natural environment” (Denny, 1997). Contd. 8
. Contd. 8.")
9
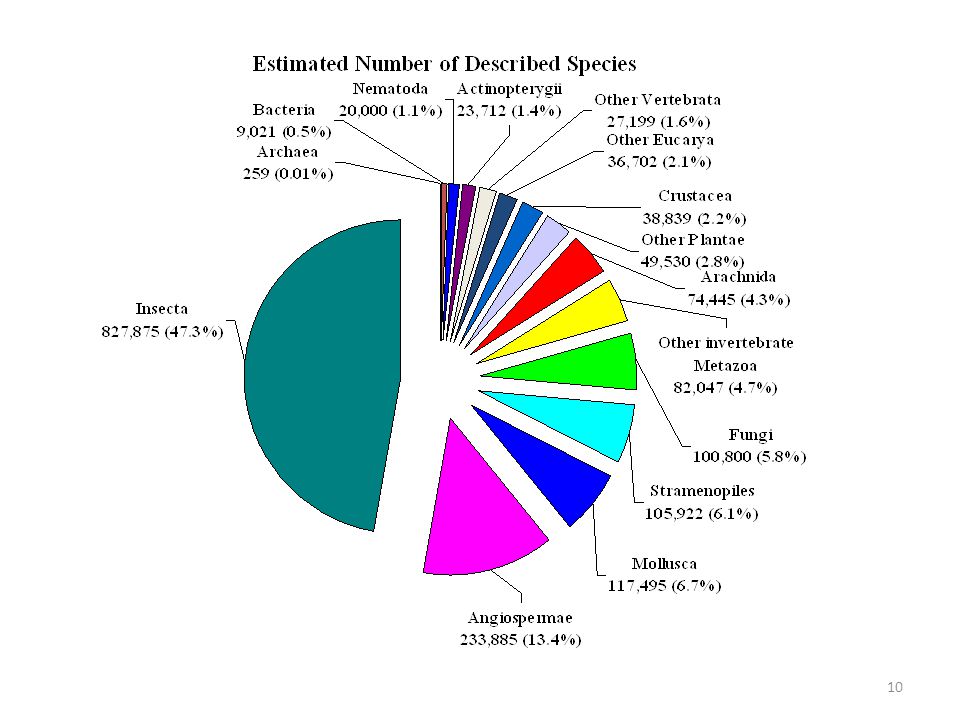
Biodiversity is defined as “the intrinsically-inbuilt plus the externally-imposed variability in and among living organisms existing in terrestrial, marine and other ecosystem at a specific period of time”. Roughly 1.4 million species are known to science, but because many species are undescribed, an estimated million species likely exists on earth. Of the tens of millions of species believed to be on Earth, scientists have only given names to about 1.5 million of them, and even fewer of the species have been studied in depth. Currently about 1.9 million species are known, but this is thought to be a significant underestimate of the total number of species. Between 1.4 and 1.8 million species have already been scientifically identified. 9

11
Levels of Biodiversity
Biodiversity is usually considered at three hierarchical levels i.e. Genetic, Species and Community and Ecosystem levels. Biodiversity, therefore, is commonly considered at three different levels: Within species (intraspecific) diversity; usually measured in terms of genetic differences between individuals or populations. 2. Species (interspecific) diversity, measured as a combination of number and evenness of abundance of species. 3. Community or ecosystem diversity, measured as the number of different species assemblages. 11
 diversity; usually measured in terms of genetic differences between individuals or populations. 2. Species (interspecific) diversity, measured as a combination of number and evenness of abundance of species. 3. Community or ecosystem diversity, measured as the number of different species assemblages. 11.")
12
The amount of genetic variation is the basis of speciation.
Genetic diversity Genetic diversity is the sum total of genetic information, contained in the genes of individuals of plants, animals and microorganisms that inhabit the earth. It is needed by any species in order to maintain reproductive vitality, resistance to disease and the ability to adapt to changing conditions. It enables a population to adapt to its environment and to respond to natural selection. The amount of genetic variation is the basis of speciation. Genetic diversity within a species often increases with environmental variability. Such genetic variability has made it possible to produce new breed of crops plants and domestic animals, and in the world allowed species to adapt to changing conditions. Contd.

13
2. Species diversity: A group of organisms genetically so similar, that they can interbreed and produce fertile offsprings is called a species. The species diversity is usually measured in terms of the total number of species within discrete geographical boundaries. 3. Community-level diversity: It is defined by the species that occupy a particular locality and the interactions between them. It represents the collective response of species to different environmental conditions. Biological communities such as deserts, grasslands, wetlands, and forest support the continuity of proper ecosystem functioning by providing ecological beneficial services to people.

14
Species diversity “species are groups of actually or potentially interbreeding natural populations that are reproductively isolated from other such groups” (Mayr 1963) Species are distinct units of diversity each playing a specific role in the ecosystem. In nature, both the number and kind of species, as well as the number of individuals per species vary, leading to greater diversity. The different sample areas showing species richness (sample area 1), Species evenness (sample area 2) and diversity due to taxonomically unrelated species (sample area 3)
 Species are distinct units of diversity each playing a specific role in the ecosystem. In nature, both the number and kind of species, as well as the number of individuals per species vary, leading to greater diversity. The different sample areas showing species richness (sample area 1), Species evenness (sample area 2) and diversity due to taxonomically unrelated species (sample area 3)")
15
Species diversity

16
Diversity of Butterfly

17
Community and ecosystem diversity
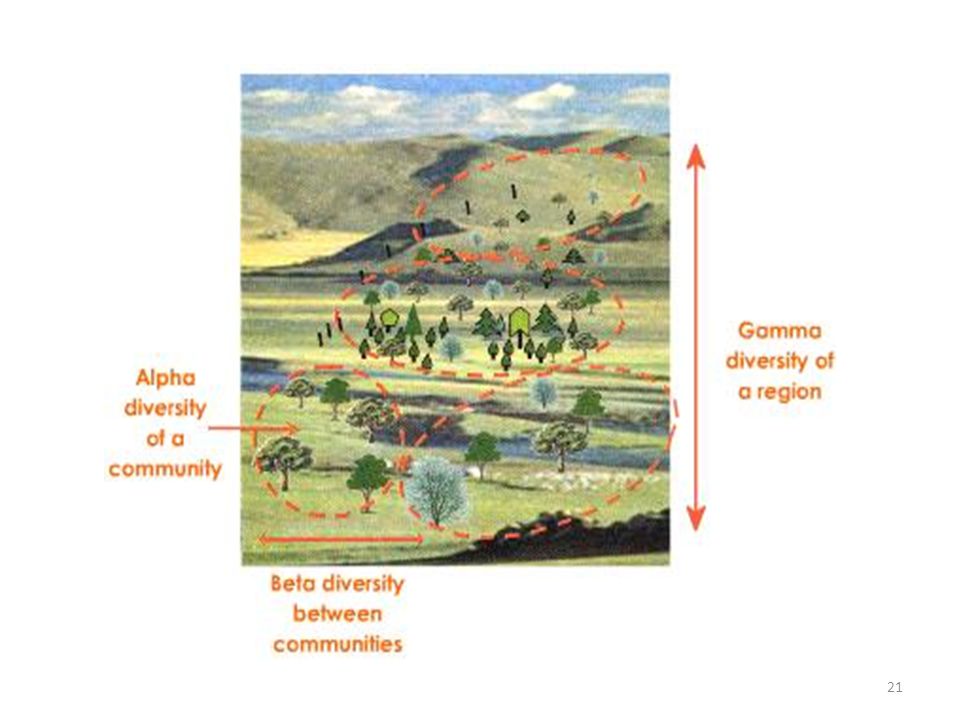
Diversity at the level of community and ecosystem exists along 3 levels. It could be within-community diversity (alpha diversity), between-communities diversity (beta diversity) or diversity of the habitats over the total landscape or geographical area (gamma diversity). Contd.
, between-communities diversity (beta diversity) or. diversity of the habitats over the total landscape or geographical area (gamma diversity). Contd.")
18
Alpha, Beta, and Gamma Diversity
Whittaker (1972) described three terms for measuring biodiversity over spatial scales: alpha, beta, and gamma diversity. Alpha Diversity refers to the diversity within a particular area or ecosystem, and is usually expressed by the number of species (i.e., species richness) in that ecosystem. Beta diversity: a comparison of diversity between ecosystems, usually measured as the amount of species change between the ecosystems . Gamma diversity: a measure of the overall diversity within a large region. Geographic-scale species diversity according to Hunter (2002:448) Contd.
 described three terms for measuring biodiversity over spatial scales: alpha, beta, and gamma diversity. Alpha Diversity refers to the diversity within a particular area or ecosystem, and is usually expressed by the number of species (i.e., species richness) in that ecosystem. Beta diversity: a comparison of diversity between ecosystems, usually measured as the amount of species change between the ecosystems . Gamma diversity: a measure of the overall diversity within a large region. Geographic-scale species diversity according to Hunter (2002:448) Contd.")
19
Alpha, beta and gamma diversity for hypothetical species of birds (A-N) in three different ecosystems. This example is based on the hypothetical example given by Meffe et al. (2002: Table 6.1).
..")
20
It is a hypothetical example where we are monitoring the effect that British farming practices have on the diversity of native birds in a particular region of the country. We are comparing species diversity within different ecosystems, such as an undisturbed deciduous wood, a well-established hedgerow bordering a small pasture, and a large arable field. We can walk a transect in each of these three ecosystems and count the number of species we see; this gives us the alpha diversity for each ecosystem. If we examine the change in species diversity between these ecosystems then we are measuring the beta diversity. We are counting the total number of species that are unique to each of the ecosystems being compared. For example, the beta diversity between the woodland and the hedgerow habitats is 7 (representing the 5 species found in the woodland but not the hedgerow, plus the 2 species found in the hedgerow but not the woodland). Beta diversity: a comparison of diversity between ecosystems, usually measured as the change in species diversity between these ecosystems. The total number of species for the three ecosystems 14, which represent the gamma diversity.
. Beta diversity: a comparison of diversity between ecosystems, usually measured as the change in species diversity between these ecosystems. The total number of species for the three ecosystems 14, which represent the gamma diversity.")
22
Biodiversity Principles
1. Go native - Native areas (wetlands, aquatic areas, riparian areas, forests/woodlands, and grasslands) provide the most important contribution to biodiversity on land. 2. Semi-natural is valuable -Semi-natural areas (e.g., shelterbelts, hedgerows, fencerows, pastures and haylands, buffers, road margins) also contribute to the conservation of biodiversity. 3. Location - The location, pattern, and seasonal availability of habitat influences the type and amount of biodiversity present. 4. Connection - Connecting native and semi-natural areas on land and with neighbouring landscapes is important to biodiversity.
 provide the most important contribution to biodiversity on land. 2. Semi-natural is valuable -Semi-natural areas (e.g., shelterbelts, hedgerows, fencerows, pastures and haylands, buffers, road margins) also contribute to the conservation of biodiversity. 3. Location - The location, pattern, and seasonal availability of habitat influences the type and amount of biodiversity present. 4. Connection - Connecting native and semi-natural areas on land and with neighbouring landscapes is important to biodiversity.")
23
Biodiversity Principles
5. Achieving structural diversity- The variation in physical structure of both native vegetation and crops—on the land provides an important contribution to biodiversity. 6. Healthy ecosystems - The health of native and semi-natural areas, all other farmland, and soil and water influences the type and amount of biodiversity present. 7. Variety - The number and mix of species present, including crops and livestock, influences the type and amount of biodiversity present. 8. Aliens - Invasive alien species are generally detrimental to the conservation of biodiversity.

24
The values of biological diversity
The value of biodiversity depends on how it is defined. But it is difficult to define, and is often impossible to estimate. Biodiversity rarely have a money price in local and international markets, however, its economic value is wide-ranging and significant. It provide the basis for life on earth, including that of humans. Human society depend on biological diversity for almost all the food supply, half of its medicines, much of its clothing and in some region virtually all of its fuel and building material and as well as, of course, an important part of its mental and spiritual welfare. Ecological services

25
Biological Diversity as a Resource
The three main approaches used for determining the value of biological resources. Consumptive use value: The biological resources are consumed directly, without passing to the market. Assessing the value of nature’s products - such as fire wood, fodder, game meat , etc. Productive use value: The resources comes through market or trading. Assessing the value of products that are commercially harvested, such as timber, fish, game meat sold in a market, ivory, and medicinal plants. Non-consumptive use value: The resources meant for the future potential uses of biodiversity (tourism, scientific research) and ecological balance. Non-consumptive use value Productive use value Consumptive use value Direct use
 and ecological balance. Non-consumptive use value. Productive use value. Consumptive use value. Direct use.")
26
Benefits of Biodiversity
Ecological benefits/services (Indirect use value) – Biodiversity supplies the buffering capacity and stability to life on the planet by maintaining the interactive dynamics of the ecosystems of the world. Economical benefits – a) Food value – providing food to the human population on this earth for thousands of years. In the process of development of human civilization, man has unfolded many plant and animal life forms which are directly or indirectly helpful for him in solving his food problem. Due to the scientific advancement many new taxa have been discovered which are high yielding. b) Commercial value –timber which is a major component of material used for providing shelter to man. Natural fibres like cotton and silk are still used for clothing by human population. Contd.
 – Biodiversity supplies the buffering capacity and stability to life on the planet by maintaining the interactive dynamics of the ecosystems of the world. Economical benefits – a) Food value – providing food to the human population on this earth for thousands of years. In the process of development of human civilization, man has unfolded many plant and animal life forms which are directly or indirectly helpful for him in solving his food problem. Due to the scientific advancement many new taxa have been discovered which are high yielding. b) Commercial value –timber which is a major component of material used for providing shelter to man. Natural fibres like cotton and silk are still used for clothing by human population. Contd.")
27
c) Medicinal value –Medicines, drugs and pharmaceuticals
c) Medicinal value –Medicines, drugs and pharmaceuticals. Many plant genetic resources are used from derivation of basic drugs. These plant resources vary from actinomycetes and fungi to large trees. Traditional knowledge of indigenous people still keeps an edge over the scientific knowledge in this field. This benefit of biodiversity is still unexplored as the scientists could assess a small fraction of biodiversity for their potential for medicine and agriculture. Aesthetic value – Man has always been fascinated by the natural beauty and nature has inspired him resulting in development of his moral and ethical values. This intrinsic value of plants and animals are independent of their economic and commercial value. Wonderful plants and animals of this planet not only reflect their aesthetic value but they can make us think of the creator. This opens doors for spiritually which envisages to live in harmony with the nature.
 Medicinal value –Medicines, drugs and pharmaceuticals. Many plant genetic resources are used from derivation of basic drugs. These plant resources vary from actinomycetes and fungi to large trees. Traditional knowledge of indigenous people still keeps an edge over the scientific knowledge in this field. This benefit of biodiversity is still unexplored as the scientists could assess a small fraction of biodiversity for their potential for medicine and agriculture. Aesthetic value – Man has always been fascinated by the natural beauty and nature has inspired him resulting in development of his moral and ethical values. This intrinsic value of plants and animals are independent of their economic and commercial value. Wonderful plants and animals of this planet not only reflect their aesthetic value but they can make us think of the creator. This opens doors for spiritually which envisages to live in harmony with the nature.")
28
Threats to Biodiversity
Growing human population - specific types of human actions that threatened biodiversity and ecosystems and causes to extinction of many species. Over-hunting/over-exploitation Habitat loss/ degradation/fragmentation Deforestation Invasion of non-native species (Alien species) Pollution Climate change Cultural impacts
 Pollution. Climate change. Cultural impacts.")
29
Threat/Loss of biodiversity
Based on the degree of threats face by the species, species are categories into different conservation category i.e. Extinct, Endangered, Vulnerable and Risk. Therefore, it is pertinent to protect and conserve the existing biodiversity for the socio-economic development and ecological balance. Every species have its role in the environment. "Silent Spring" is a book written by Rachel Carson (1962). This book brought together research on toxicology, ecology and epidemiology to suggest that agricultural pesticides were building to catastrophic levels. This was linked to damage to animal species and to human health. It shattered the assumption that the environment had an infinite capacity to absorb pollutants. This book inspired widespread public concerns with pesticides and pollution of the environment. Silent Spring facilitated the ban of the pesticide DDT in 1972 in the Unites States.
. This book brought together research on toxicology, ecology and epidemiology to suggest that agricultural pesticides were building to catastrophic levels. This was linked to damage to animal species and to human health. It shattered the assumption that the environment had an infinite capacity to absorb pollutants. This book inspired widespread public concerns with pesticides and pollution of the environment. Silent Spring facilitated the ban of the pesticide DDT in 1972 in the Unites States.")
30
THREAT CATEGORIES Extinct (EX) Extinct Extinct in the Wild (EW)
Critical (CR) Endangered (EN) Vulnerable (VU) Conservation Dependent (CD) Threatened Non-threatened Low Risk (LR) Near-threatened (NT) Of less concern Abundant Data Deficient (DD) Not evaluated (EV) ALL SPECIES
 Endangered (EN) Vulnerable (VU) Conservation Dependent (CD) Threatened. Non-threatened. Low Risk (LR) Near-threatened (NT) Of less concern. Abundant. Data Deficient (DD) Not evaluated (EV) ALL SPECIES.")
31
Threatened Species Categories (According to IUCN)
Extinct (E) A taxon is Extinct when there is no reasonable doubt that that the last individual has died. Critically Endangered (CR) A taxon is Critically Endangered when it is facing an extremely high risk of extinction in the wild in the immediate future. Endangered (EN) A taxon is Endangered when it is not Critically Endangered but facing a very high risk of extinction in the wild in the near future. Vulnerable (VU) A taxon is Vulnerable when it is not Critically Endangered but facing a high risk of extinction in the wild in the medium-term future. Lower Risk (LR) A taxon is Lower Risk when it has been evaluated, does not satisfy the criteria for any of the categories CR, E, or VU. Endemic species : Species restricted to a particular region or ecosystem due to various environmental factors or due to the barriers of dispersal. Rare species: Some species are naturally rare due to presence in small numbers.
 A taxon is Extinct when there is no reasonable doubt that that the last individual has died. Critically Endangered (CR) A taxon is Critically Endangered when it is facing an extremely high risk of extinction in the wild in the immediate future. Endangered (EN) A taxon is Endangered when it is not Critically Endangered but facing a very high risk of extinction in the wild in the near future. Vulnerable (VU) A taxon is Vulnerable when it is not Critically Endangered but facing a high risk of extinction in the wild in the medium-term future. Lower Risk (LR) A taxon is Lower Risk when it has been evaluated, does not satisfy the criteria for any of the categories CR, E, or VU. Endemic species : Species restricted to a particular region or ecosystem due to various environmental factors or due to the barriers of dispersal. Rare species: Some species are naturally rare due to presence in small numbers.")
32
IUCN Red List International Union for Conservation of Nature Conservation status by risk of extinction Extinct Extinct Extinct in the Wild Threatened Critically Endangered Endangered Vulnerable At lower risk Conservation Dependent Near Threatened Least Concern

33
Threatened species of India
Taxonomic group Number of threatened species Mammals 86 Birds 70 Reptiles 25 Amphibians 3 Fish Molluscs 2 Other Invertebrates 21 Plants 244 Total 459 Source: IUCN (2000)
")
34
Protecting biodiversity: legal and non-legal bindings

35
Terrestrial Biodiversity Management/Land Use
State-owned Forests National parks Sanctuaries Reserved forests Community Conserved Forests Community owned areas Community reserves Sacred groves Private/Corporate Forests

36
Biodiversity Conservation through PA Network Planning
Biogeographical Classification of India 10 Biogeographical Zones 27 Biogeographical Provinces

37
2009 Category 1988 2009 Nos. Area (km2) % National Parks 54 21,003 0.64 99 39,155 1.19 Wildlife Sanctuaries 372 88,649 2.70 513 118,417 3.60 Community Reserve - 3 17.8 0.005 Conservation Reserve 43 1155 0.035 Protected Areas 426 109,652 3.34 658 158,745 4.83

38
NATIONAL PARKS Definition: An area dedicated by statute for all time, to conserve the scenery and natural and historical objects of national significance, to conserve wild life therein and to provide for the enjoyment of the same in such manner and by such means as will leave them unimpaired for the enjoyment of future generations, with such modifications a local conditions may demand”. (IBWL 1952)
")
39
WILD LIFE SANCTUARY Definition: It is an area where killing and capturing of any species of birds or animals is prohibited except under orders of competent authority and whole boundaries and characteristics should be sacrosanct (free from outrage) as far as possible”. (IBWL 1952)
 as far as possible . (IBWL 1952)")
40
Aims of establishment of NP and WLS
The sanctuaries and national parks (Protected areas) are established with the view to:- Adequate representation of bio-geographic diversity Proper geographic distributions of PAs across prominent wilderness belts. Setting-up new PAs rationalizing boundaries of existing ones so as to meet the imperative in the above 1 & 2. Overcoming management deficiencies in PAs. Promoting corridor values (conducive to movement of major mammals and long terms, long ranging gene-travel of all species of flora and fauna) through forests and multiple-use areas that lie between PAs in a given wilderness belt. Establishing a monitoring mechanism to access the viability of network of PAs.
 are. established with the view to:- Adequate representation of bio-geographic diversity. Proper geographic distributions of PAs across prominent wilderness belts. Setting-up new PAs rationalizing boundaries of existing ones so as to meet the imperative in the above 1 & 2. Overcoming management deficiencies in PAs. Promoting corridor values (conducive to movement of major mammals and long terms, long ranging gene-travel of all species of flora and fauna) through forests and multiple-use areas that lie between PAs in a given wilderness belt. Establishing a monitoring mechanism to access the viability of network of PAs.")
41
Differences between National Parks and Wildlife Sanctuary
National park is declared by the state government under section 35(1) of the Wild Life (Protection) Act, 1972; whereas sanctuary is declared under section 18(1) of the Act. In NP, the boundary is well-defined and accurate at the time of its declaration; while the boundary is demarcated approximately at the time of its declaration in sanctuary. The claim of right of land of the people is settled before its declaration in NP; whereas in case of sanctuary the same is settled after its declaration. No alternation of the boundaries of the NP shall be made except on a resolution passed by Legislative Assembly of the State Government; but on contrary, in sanctuary, such alternation may be done by the order of the state Government.
 of the Wild Life (Protection) Act, 1972; whereas sanctuary is declared under section 18(1) of the Act. In NP, the boundary is well-defined and accurate at the time of its declaration; while the boundary is demarcated approximately at the time of its declaration in sanctuary. The claim of right of land of the people is settled before its declaration in NP; whereas in case of sanctuary the same is settled after its declaration. No alternation of the boundaries of the NP shall be made except on a resolution passed by Legislative Assembly of the State Government; but on contrary, in sanctuary, such alternation may be done by the order of the state Government.")
42
Contd. In NP grazing is not permissible while in sanctuary grazing and movement of the cattle may be permitted for the benefit of wild animals. In sanctuary, the Chief Wildlife warden may pass his/her order after getting concurrence of the state Government to kill or catch the certain wild animal for the welfare of wild community and he/she is also empowered to dismiss the order; but in case of NP, such order is governed by the state Government itself and then the Chief Wild Life warden issues the concerned order which cannot de dismissed by him/her. The status and degree of permanency and protection is, therefore, much higher in NP than in a sanctuary.

43
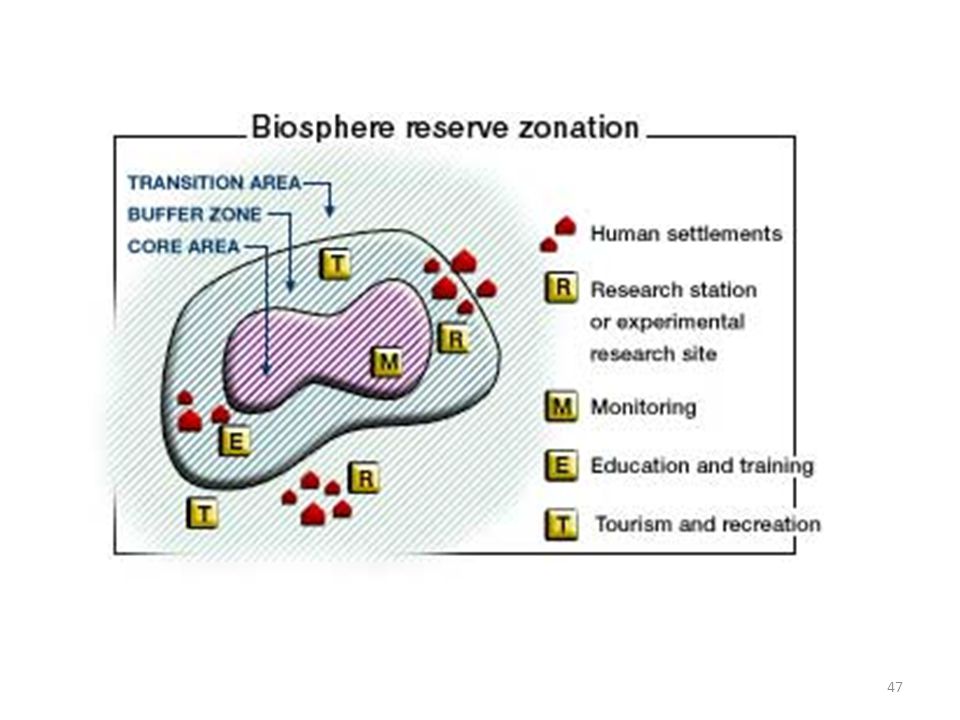
BIOSPHERE RESERVES Biosphere reserves are areas of terrestrial and coastal ecosystems promoting solutions to reconcile the conservation of biodiversity with its sustainable use. They are internationally recognized, nominated by national governments and remain under sovereign jurisdiction of the states where they are located. Biosphere reserves serve in some ways as 'living laboratories' for testing out and demonstrating integrated management of land, water and biodiversity. Collectively, biosphere reserves form a World Network. Within this network, exchanges of information, experience and personnel are facilitated. There are over 480 biosphere reserves in over 100 countries.

44
To prevent loss of biodiversity, the Government of India is setting up 17 biosphere reserves in different parts of the country. (Ministry of Environment and Forests: "Annual Report ") These are multipurpose protected areas to preserve the genetic diversity in different ecosystems. Seven of the seventeen biosphere reserves are a part of the World Network of Biosphere reserves, based on the UNESCO Man and the Biosphere (MAB) Programme list. Namely, Nilgiri, Gulf of Mannar, Sundrbans, Nanda Devi, Nokrek, Pachmarhi, and Similipal Biosphere Reserves
 Programme list. Namely, Nilgiri, Gulf of Mannar, Sundrbans, Nanda Devi, Nokrek, Pachmarhi, and Similipal Biosphere Reserves.")
45
Functions of biosphere reserves
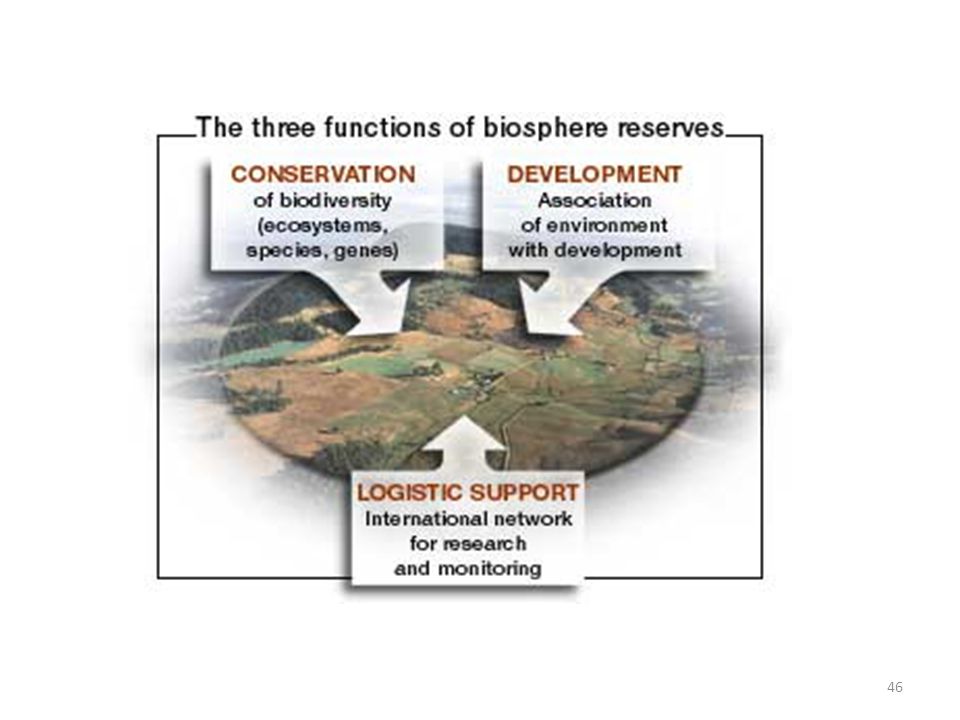
Each biosphere reserve is intended to fulfil 3 basic functions, which are complementary and mutually reinforcing: a conservation function - to contribute to the conservation of landscapes, ecosystems, species and genetic variation; a development function - to foster economic and human development which is socio-culturally and ecologically sustainable; a logistic function - to provide support for research, monitoring, education and information exchange related to local, national and global issues of conservation and development.

48
Sacred grove Sacred groves are the tract of virgin forest harbouring rich biodiversity, protected by the local people based on the ground of beliefs of culture, religion and taboos of indigenous people. They are the repositories of rare and endemic species and can easily be thought of as remnants of primary forest left untouched by the local inhabitants and protected by them due to the consideration that deities resides in these forests. It is one of the oldest form of conservation of nature, practiced by the indigenous communities and rural people. The inextricable link between present society to the past in terms of biodiversity, culture, religious and ethnic heritage has been found in sacred groves. It is believed that sacred virgin forest dates back to several thousands of years when human society was in the primitive state. Historical links of the sacred groves has been traced from pre- agricultural, hunting and gathering stage of societies and believed to be pre-Vedic in origin. 48

49
The groves have evolved under different socio-ecological and cultural situations. Every sacred grove carries its own legends, lore and myths which form the integral part of the oral traditions of local people. This unique community-linked forest conservation concept is still followed in many tribal and agrarian regions of the world. For example, a number of human societies in Asia, Africa, Europe, America and Australia had long preservation sections of their natural environment as sacred groves. The protection and conservation of groves depends entirely on the control of the community over the forest and the people. They have been survived for many hundreds of years and today they serve as reservoir of much local biodiversity. Groves provides many ecological, environmental and socio-cultural functions to the society. In the context of the recent concern over the high rates of deforestation and natural resource use, the sacred groves offer a potential tool and model to revisit and explore the possibilities of conservation of biological diversity.

50
CLASSIFICATION OF SACRED GROVES
Traditional Sacred Groves – It is the place where the village deity resides, who is represented by an elementary symbol Temple Groves – Here a grove is created around a temple and conserved. Groves around the burial or cremation grounds. (Source: Pandey, A., and Venkata Rao, P., Impact of Globalisation on culture of Sacred Groves)
")
51
Sacred grove (Meghalaya)
Konthoujam Lairembi sacred grove (Manipur) Sacred grove (Kerala) Sacred stone of Ebudhou Marjing in Heingang Marjing sacred grove (Manipur)
 Sacred grove (Kerala) Sacred stone of Ebudhou Marjing in. Heingang Marjing sacred grove (Manipur)")
52
conservation of species
People’s attitude and social changes Lost of religious beliefs Conversion of religion SACRED GROVE Repository of species Unique centre for the conservation of species Religious beliefs Fragmentation Encroachment Developmental activities (Modernization and urbanization) Increased population Exploitation of resource Taboos Socio-cultural practices Habitat degradation Maintain ecological balance Supply of resources (Economic support) Conservation of biodiversity Figure . Diagrammatic representation of sacred grove: it’s benevolent to human and nature, and fortune due to human impacts. (Source: Khumbongmayum, et al )
 Increased. population. Exploitation of. resource. Taboos. Socio-cultural. practices. Habitat. degradation. Maintain. ecological. balance. Supply of. resources. (Economic. support) Conservation. of. biodiversity. Figure . Diagrammatic representation of sacred grove: it’s benevolent to human and nature, and fortune due to human impacts. (Source: Khumbongmayum, et al 2004)")
53
Legal status Sacred groves did not enjoy protection via federal legislation in India. Some NGOs work with local villagers to protect such groves. Traditionally, and in some cases even today, members of the community take turns to protect the grove. However, the introduction of the protected area category community reserves under the Wildlife (Protection) Amendment Act 2002 has introduced legislation for providing government protection to community held lands, which could include sacred groves.
 Amendment Act 2002 has introduced legislation for providing government protection to community held lands, which could include sacred groves.")
54
Conservation of Biodiversity
Conservation of biodiversity is essential for the human survival, notably through health, food and industry. All forms of life-human, animal and plants, are so closely interlinked that disturbance in one gives rise to imbalance in the others. If species of plants and animals become endangered they signify degradation in the environment, which may threaten man’s own existence. The maintenance of biodiversity at all levels is fundamentally the maintenance of viable population of species or identifiable populations. Approaches of biodiversity conservation should be concise with due consideration of national problems. Priority should be given first to conserve those species which have vital resource which benefit to mankind at shorter duration and also to conserve threatened, endangered and rare species of the nation. Contd.

55
In situ and ex situ conservation of biodiversity should be done for those species which are threatened, rare, endangered as well as species expenditure. Extraction of timber from the forest areas should be based on ecological planning by taking into the consideration of stability of ecosystem. The scientific knowledge of biodiversity conservation should not be restricted on paper that should be spread among the people through the mass communication, training, awareness programmes at the grassroots level. An approaches of sustainable harvest or exploitation of the species will be helpful for the conservation of biodiversity, offering all the basic necessities for the subsistence of man's life. Therefore, Sustainable use of resources and sustainable development are highly needed in order to save the loss of biodiversity.

56
BIODIVERSITY OF NORTHEAST INDIA
Northeast India is blessed with a wide range of physiography and ecoclimatic conditions. It represents the transition zone between the Indian, Indo-Malayan and Indo-Chinese biogeographic regions and a meeting place of the Himalayan Mountains and Peninsular India. The region is one of the richest in biological values. It is in this lowland-highland transition zone that the highest diversity of biomes or ecological communities can be found, and species diversities within these communities are also extremely high.

57
Flora The NE region accounts for nearly 50% of the total number of plant species in India as a whole. The region has at least 7,500 flowering plants, 700 orchids, 58 bamboos, 64 citrus, 28 conifers, 500 mosses, 700 ferns and 728 lichen species. Some of the important gene pools of citrus, banana and rice have been reported to be originated from this region (Anonymous 1996). Out of the 315 families of Angiosperms in India, more than 200 are represented in NE India. It is of interest to note that about one third of the flora of NE India is endemic to this region.
. Out of the 315 families of Angiosperms in India, more than 200 are represented in NE India. It is of interest to note that about one third of the flora of NE India is endemic to this region.")
58
Siroy lily (Lilium mackliniae) a ground lily that produces beautiful flowers, is a narrow endemic found in the eastern border area of Manipur in Ukhurl district. The carnivorous/ Pitcher plant (Nepenthes khasiana) is endemic to Meghalaya and is listed in Appendix I of CITES and placed in Schedule VI of the wildlife (Protection) Act, 1972.
 is endemic to Meghalaya and is listed in Appendix I of CITES and placed in Schedule VI of the wildlife (Protection) Act,")
59
Agarwood (Aquilaria malaccensis) that occurs in the tropical forests of the NE regions is highly prized and is listed in Appendix II of CITES Schedule VI of the Wildlife (Protection) Act, 1972.
 that occurs in the tropical forests of the NE regions is highly prized and is listed in Appendix II of CITES Schedule VI of the Wildlife (Protection) Act, 1972.")
60
Taxus baccata The yew tree (Taxus baccata) is a highly toxic plant that has occasionally been used medicinally, mainly in the treatment of chest complaints. Modern research has shown that the plants contain the substance 'taxol' in their shoots. Taxol has shown exciting potential as an anti-cancer drug, particularly in the treatment of ovarian cancers. ….. Taxus baccata found in West Kameng and Tawang district of Arunachal Pradesh are cut down by the local people and exploit for commercial purpose. Due to the large scale destruction, the survival of species are threatened and immediate conservation is needed. Therefore, in Bomdila a nursery of Taxus baccata is set up and helping from the verge of extinction.
 is a highly toxic plant that has occasionally been used medicinally, mainly in the treatment of chest complaints. Modern research has shown that the plants contain the substance taxol in their shoots. Taxol has shown exciting potential as an anti-cancer drug, particularly in the treatment of ovarian cancers. ….. Taxus baccata found in West Kameng and Tawang district of Arunachal Pradesh are cut down by the local people and exploit for commercial purpose. Due to the large scale destruction, the survival of species are threatened and immediate conservation is needed. Therefore, in Bomdila a nursery of Taxus baccata is set up and helping from the verge of extinction.")
61
Rhododendron The genus Rhododendron of Ericaceae is another remarkable group of showy plants with nearly 98% of the total Rhododendrons reported from India are confined to Himalayan region (Singh et al. 2003). In total 72 species, 20 sub species and 19 varieties listed from India, eastern Himalaya region harbors 71 species. Out of 12 species, 2 sub species and 5 varieties of Rhododendron endemic to India, in north eastern region, Arunachal Pradesh has maximum number of endemic species with 9 species and 1 sub species, followed by Manipur and Sikkim with 3 species and 1 sub species and Mizoram with 2 species (Mao et al 2001).
. In total 72 species, 20 sub species and 19 varieties listed from India, eastern Himalaya region harbors 71 species. Out of 12 species, 2 sub species and 5 varieties of Rhododendron endemic to India, in north eastern region, Arunachal Pradesh has maximum number of endemic species with 9 species and 1 sub species, followed by Manipur and Sikkim with 3 species and 1 sub species and Mizoram with 2 species (Mao et al 2001).")
62
Orchid Orchidaceae, the most fascinating and highly evolved groups of plants with 1229 species belonging to 184 genera in India (Singh & Chauhan 1999), about 700 species have been reported from north eastern region of India. Of these, 545 species belonging to 122 genera are reported from only Arunachal Pradesh (Chowdhery 1998). Of which 12 species are under endangered category, 16 species vulnerable and 31 species threatened.
, about 700 species have been reported from north eastern region of India. Of these, 545 species belonging to 122 genera are reported from only Arunachal Pradesh (Chowdhery 1998). Of which 12 species are under endangered category, 16 species vulnerable and 31 species threatened.")
63
Threatened orchids of Sikkim

64
Variety of orchids Orchids, believed to have evolved in this region, form a very noticeable feature of the vegetation here. Of about 1300 species of orchids, belonging to 158 genera reported from India, NE India sustains the highest concentration with about 700 species. Arunachal Pradesh alone accounts 500 species of orchids – the highest number in any state of India. Rhynchostele cordata Dendrobium equitans Rhynchostylis gigantea Dendrobium engae Dendrobium densiflorum

65
Fauna The region is equally rich in faunal diversity. An estimated 3,624 species of insects, 50 molluscs, 236 fishes, 64 amphibians, 137 reptiles, 541 birds and 160 mammalian species have been so far described (Anonymous 1998b). Primates Three families of primates’ occur in India with 15 known species, nine of these species occur in North east India (Mohnot 1980 and Roonwal and Mohnot 1977). The Golden Langur (Trachypithecus geei) is a Schedule I animal and is also listed in the Appendix I of CITES. The Slow Loris (Nycticebus bengalensis) is an inhabitant of tropical forests south of the Brahmaputra River in Northeast India. This highly endangered animal is listed as Schedule I animal, and in Appendix I of the CITES.
. Primates. Three families of primates’ occur in India with 15 known species, nine of these species occur in North east India (Mohnot 1980 and Roonwal and Mohnot 1977). The Golden Langur (Trachypithecus geei) is a Schedule I animal and is also listed in the Appendix I of CITES. The Slow Loris (Nycticebus bengalensis) is an inhabitant of tropical forests south of the Brahmaputra River in Northeast India. This highly endangered animal is listed as Schedule I animal, and in Appendix I of the CITES.")
66
Carnivores Of the six largest cats of the world recorded from India, state of Arunachal Pradesh only sustain four of them - the Tiger (Panthera tigris), Leopard (Panthera pardus), Snow Leopard (Uncia uncia) and the Clouded Leopard (Neofelis nebulosa). Red Panda, protected under Schedule I of the Indian Wildlife (Protection) Act, 1972 and listed in Appendix I of CITES and as ‘Endangered, by IUCN is also predominantly available in the region.
, Leopard (Panthera pardus), Snow Leopard (Uncia uncia) and the Clouded Leopard (Neofelis nebulosa). Red Panda, protected under Schedule I of the Indian Wildlife (Protection) Act, 1972 and listed in Appendix I of CITES and as ‘Endangered, by IUCN is also predominantly available in the region.")
67
Ungulates The foothill grasslands and broadleaf forest harbor important population of Asian elephant, one horned rhinoceros and wild water buffalo. In Northeast India Great Indian Rhinoceros (Rhinoceros unicornis) is now restricted to Kaziranga, Pabitora and Orang in Assam. The Brow-antlered Deer (Cervus eldi eldi), locally known as Sangai is endemic to Manipur and one of rarest and the most localized subspecies of deer in the world. The Pygmy Hog (Sus salvanius) is the smallest and the rarest wild suid in the world, and only a few isolated wild populations survive in Northeast India.
 is now restricted to Kaziranga, Pabitora and Orang in Assam. The Brow-antlered Deer (Cervus eldi eldi), locally known as Sangai is endemic to Manipur and one of rarest and the most localized subspecies of deer in the world. The Pygmy Hog (Sus salvanius) is the smallest and the rarest wild suid in the world, and only a few isolated wild populations survive in Northeast India.")
68
Birds From Arunachal Pradesh over 760 bird species have been reported (Borang 2004). Greater Adjutant (Leptoptilos dubius) is a globally threatened bird with the majority of the world’s population now found in Assam. Spot-billed Pelican (Pelicanus philippensis), Blacknecked Stork (Ephippiorhyncus asiaticus), Lesser Adjutant (Leptotilos javanicus), and Pale-capped Pigeon (Columba punicea), are only to name a few of the globally threatened birds found in the region. Swamp Francolin (Francolinus gularis), found in Northeast India, is endemic to the Indian subcontinent.
 is a globally threatened bird with the majority of the world’s population now found in Assam. Spot-billed Pelican (Pelicanus philippensis), Blacknecked Stork (Ephippiorhyncus asiaticus), Lesser Adjutant (Leptotilos javanicus), and Pale-capped Pigeon (Columba punicea), are only to name a few of the globally threatened birds found in the region. Swamp Francolin (Francolinus gularis), found in Northeast India, is endemic to the Indian subcontinent.")
69
Lower Vertebrates So far 137 species of reptiles have been recorded from Northeast India which has the greatest affinity to the Oriental, Indo – Malayan and Indo – Chinese regions. 20 lizard species from the State of Assam, and 18 species from the tiny state of which is profoundly influenced by the Indo-Chinese connection have been recorded so far. Of the three species of Monitor Lizards found in the region, Varanus flavescens is listed in Schedule I under Wildlife (Protection) Act, 1972 and listed in Appendix I of CITES. The Tokay Gecko (Gekko gekko) is the largest gecko alive today and is found in northeast India. Fifty eight species of snakes have been recorded in Assam, 34 from Manipur and 92 from Arunachal Pradesh. Python reticulatus, the largest snake in India, is found in northeast India and Python molurus bivittatus is the most commonly known in the region. So far 64 species of amphibians have been recorded from the Northeast India.
 Act, 1972 and listed in Appendix I of CITES. The Tokay Gecko (Gekko gekko) is the largest gecko alive today and is found in northeast India. Fifty eight species of snakes have been recorded in Assam, 34 from Manipur and 92 from Arunachal Pradesh. Python reticulatus, the largest snake in India, is found in northeast India and Python molurus bivittatus is the most commonly known in the region. So far 64 species of amphibians have been recorded from the Northeast India.")
70
Invertebrates The Biodiversity Strategy and Action Plan for Northeast Ecoregion suggests that 3,624 species of insects and 50 molluscs are recorded from the region (Tripathi and Barik 2003). Butterflies and moths are by far the best-studied invertebrate organisms in Northeast India, and the region contributes the maximum number of species for the group in the country.
. Butterflies and moths are by far the best-studied invertebrate organisms in Northeast India, and the region contributes the maximum number of species for the group in the country.")
71
THANK YOU

Similar presentations