Download presentation
Presentation is loading. Please wait.

2
What’s it all about???

5
How do we compare? Selected Industrial Nations Public Sector Net Debt as a Percentage of GDP (2012)
")
6
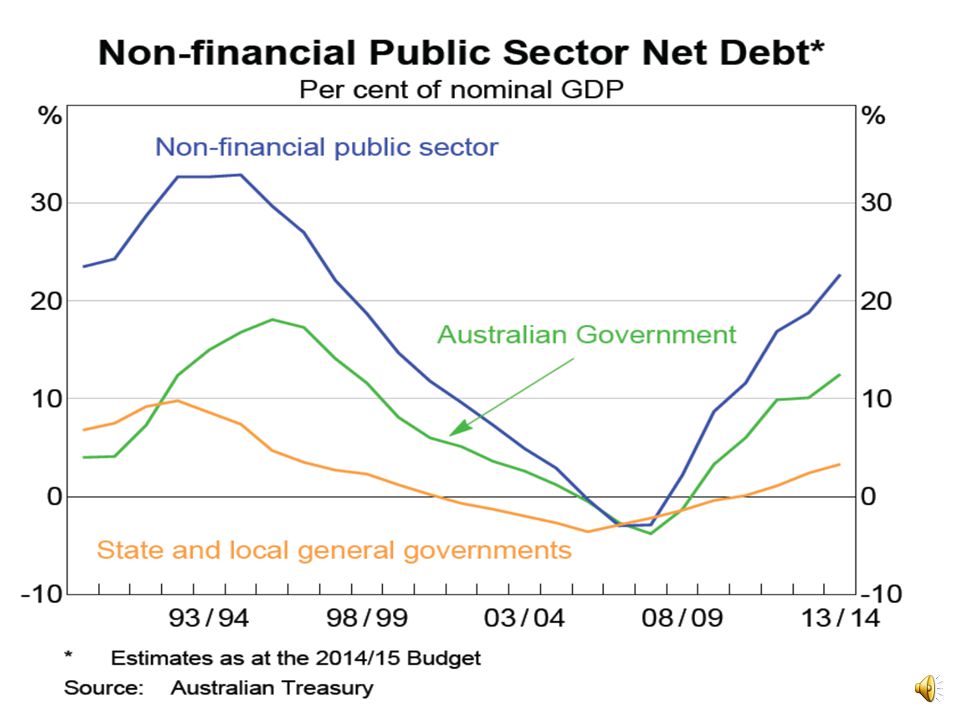
The 2014-15 Budget The 2014-15 underlying cash balance has been reduced from a deficit of $ 49.9 billion (-3.1% of GDP) in 2013-14 to a $29.8 billion deficit (-1.8% of GDP)
 in to a $29.8 billion deficit (-1.8% of GDP)")
7
Who wins and who loses?

9
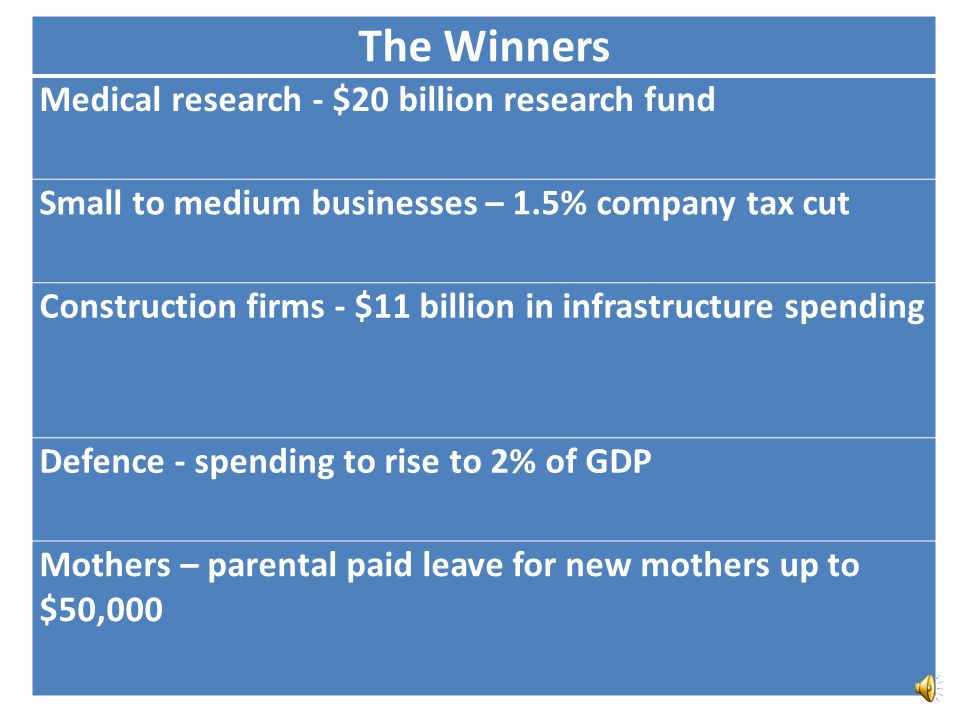
The Winners Medical research - $20 billion research fund Small to medium businesses – 1.5% company tax cut Construction firms - $11 billion in infrastructure spending Defence - spending to rise to 2% of GDP Mothers – parental paid leave for new mothers up to $50,000

10
The Losers The sick - $7 increase for GP’s fees and cuts to hospital funding University students – higher fees to study and increased loan repayments Public Servants – 16,500 job loses Pensioners – pension age to rise to 70 by 2035 and benefits cut Families – cuts to Family Tax Benefit B Tighter eligibility criteria for disability support pensions

11
Losers Foreign Aid budget – cut by $7.9 billion over five years Young unemployed – have to wait 6 months to get a lower unemployment payment Motorists – indexation of petrol excise, one cent a litre. High income earners – over $180,000 pay a 2% income tax levy for three years. Indigenous people - $500 million cut to indigenous programs over five years.

Similar presentations