Download presentation
Presentation is loading. Please wait.

1
HEMODYNAMICS OF AS

2
Aortic Stenosis Etiology based on location Supravalvular Subvalvular-
Congenital Bicuspid Rheumatic Senile degenerative

3
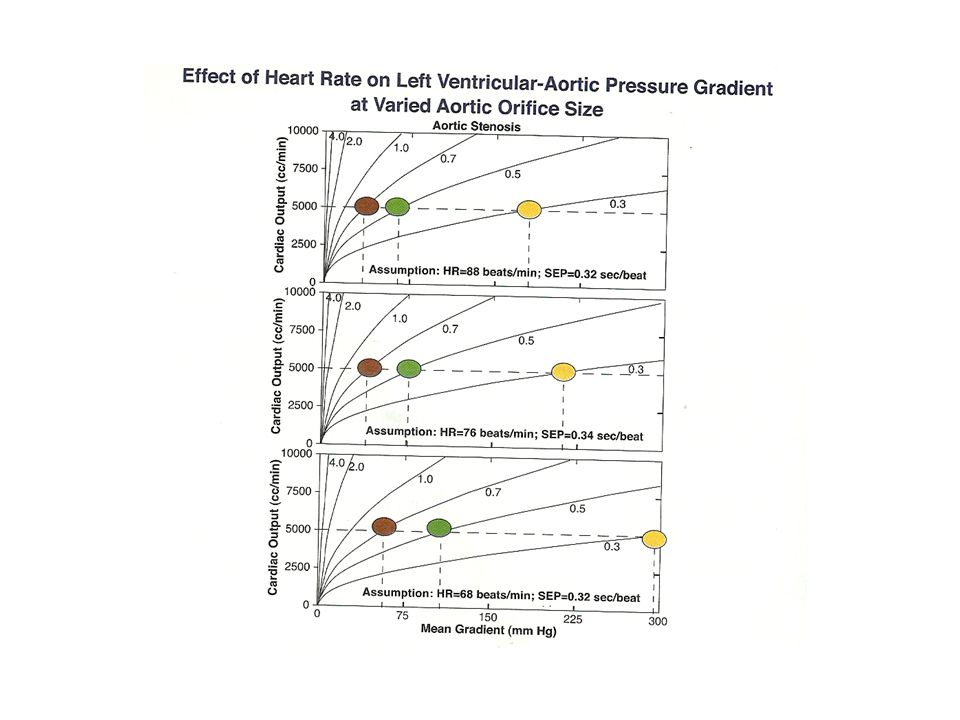
Pathophysiology Pressure gradient across the aortic valve increases exponentially (not linearly) with decreasing aortic valve area
 with decreasing aortic valve area.")
6
Pathophysiology Increase in afterload
Progressive hypertrophy-Concentric hypertrophy-- II sarcomeres Decrease in systemic and coronary flow

8
Compensatory Mechanisms
Adaptive and maladaptive Progressive worsening of left ventricular outflow obstruction leads to hypertrophy Compensatory hypertrophy required to maintain wall stress (afterload) Augmented preload with increased atrial kick preserve LV systolic function
 Augmented preload with increased atrial kick preserve LV systolic function.")
9
Subendocardial ischemia
Perivascular fibrosis- ECM ellaboration Large diameter myocytes impairing O2 diffusion Hgh LVEDP- dec cor diastolic perfusion pr Inc O2 consumption from inc mass and wall stress Epicardial CAD

11
increased - Afterload “ mismatch” increased preload- noncompliant vent
↓ I EF:- 1) NL Contractility increased - Afterload “ mismatch” increased preload- noncompliant vent asynchronous uncoordinated contraction- wall stress 2) decreased contractility- multifactorial ↓ s upply to endocardium ↓ cor flow reserve cytoskeletal abnormalities diastolic dysfunction pathological LVH
 NL Contractility. increased - Afterload mismatch increased preload- noncompliant vent. asynchronous uncoordinated contraction- wall stress. 2) decreased contractility- multifactorial. ↓ s upply to endocardium. ↓ cor flow reserve. cytoskeletal abnormalities. diastolic dysfunction. pathological LVH.")
17
In mild AS, intracardiac pressures and CO - normal
As the valve becomes more stenotic- normal at rest, unable to increase CO during exercise Progressive narrowing of the valve leads to decreased stroke volume and cardiac output even at rest In moderate to severe AS, patients may develop elevated filling pressures to compensate for the increase in LV end-diastolic pressure In a minority of patients LV systolic failure occurs- further elevation in intracardiac pressures

20
the degree to which hypertrophy may go on is limited by the coronary blood flow
The aortic obstruction imposes some limits on the perfusion pressure available for the coronary vessels, and also on the output available for them. Moreover, the increased systolic resistance to flow in the hypertrophied muscle cuts down on whatever coronary flow normally does occur in systole. As the obstruction progresses to a critical level, the high afterload “overwhelms” the left ventricle and systolic function begins to decrease. With continued severe afterload excess, myocyte degeneration and fibrosis occurs and produces irreversible left ventricular systolic dysfunction

26
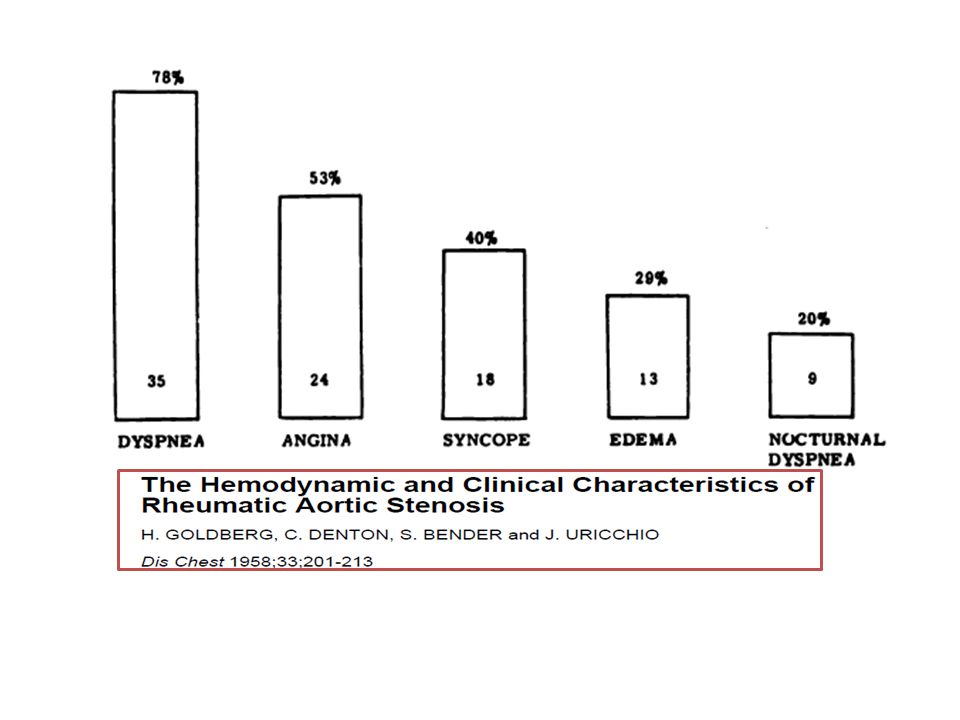
Angina Progressive LV hypertrophy from aortic stenosis leads to increased myocardial oxygen needs Hypertrophy may compress the coronary arteries Reduced diastolic filling may result in classic angina, even in the absence of coronary artery disease 35% presentation 50% die in 5 years

27
Syncope Cardiac output no longer increases with exercise
A drop in systemic vascular resistance that normally occurs with exertion may lead to hypotension and syncope Rest- arrythmias, av block 15% presentation 50% die in 3 years

28
Heart Failure Changes in LV function may no longer be adequate to overcome the outflow obstruction Hypertrophic remodeling leads to diastolic dysfunction Afterload excess results in decreased ejection fraction – systolic dysfunction 50% presentation 50% die in 2 years

30
There may be a plateau or an anacrotic pulse or a late peaking and small volume pulse, pulsus parvus, and tardus The pulse pressure may be reduced In supravalvular AS, the right brachial and carotid pulsations are of greater amplitude than the left-sided ones

31
Mask severity High CO & elastic vessels Increased stiffness in elderly AR HTN Exaggerate severity LV Systloic dysfn MS Hypovolemia

32
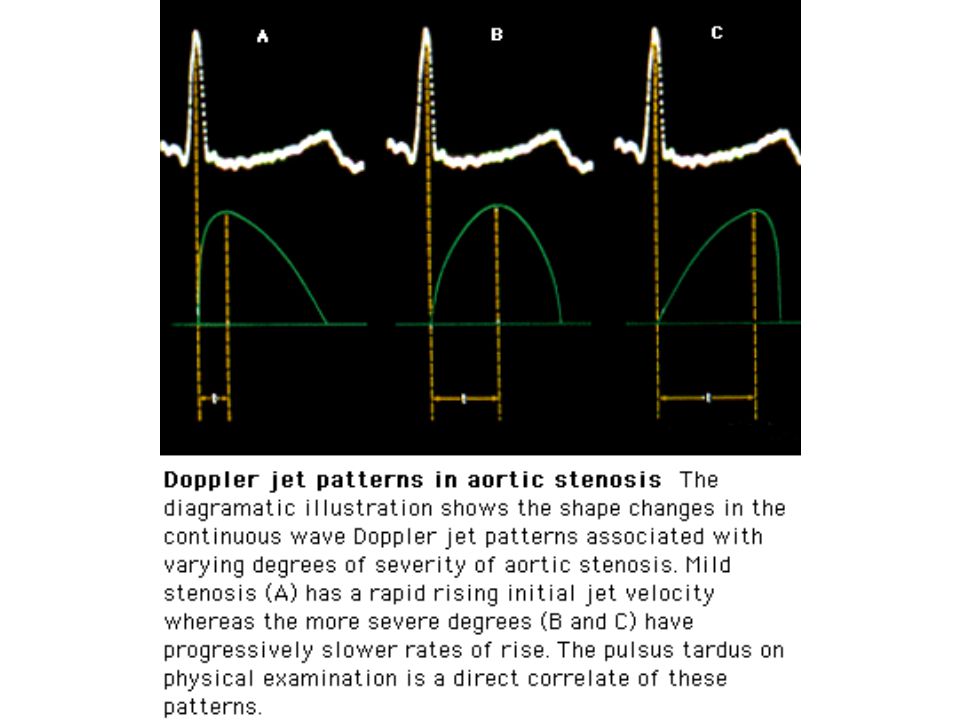
Timing and amplitude of the carotid pulse –severity
When the upstroke is delayed due to significant aortic stenosis, the rise is slow and sustained” In normals, most of the stroke volume is ejected during the first third of systole In aortic stenosis, this rapid ejection cannot occur- takes all of systole to eject the same volume. decreased mass or volume ejected per unit time leads to a considerable decrease - ejection momentum despite increased velocity of ejection In addition, the increased velocity of flow caused by the significant pressure gradient between the left ventricle and the aorta caused by the stenosis produces a Venturi effect on the lateral walls of the aorta. This has the effect of significantly reducing the net pressure rise in the aorta

33
In supravalvular AS- the right brachial pulse and the carotid may be stronger than the left brachial
Coanda effect -properly directed jet , attach to a convex surface instead of moving in a straight line Obstruction in the supravalvular AS is such that the high-velocity jet is directed towards the right innominate artery

34
The apex beat is hyperdynamic and sustained due to associated left ventricular hypertrophy. A thrill in the aortic area indicates AS not severity

35
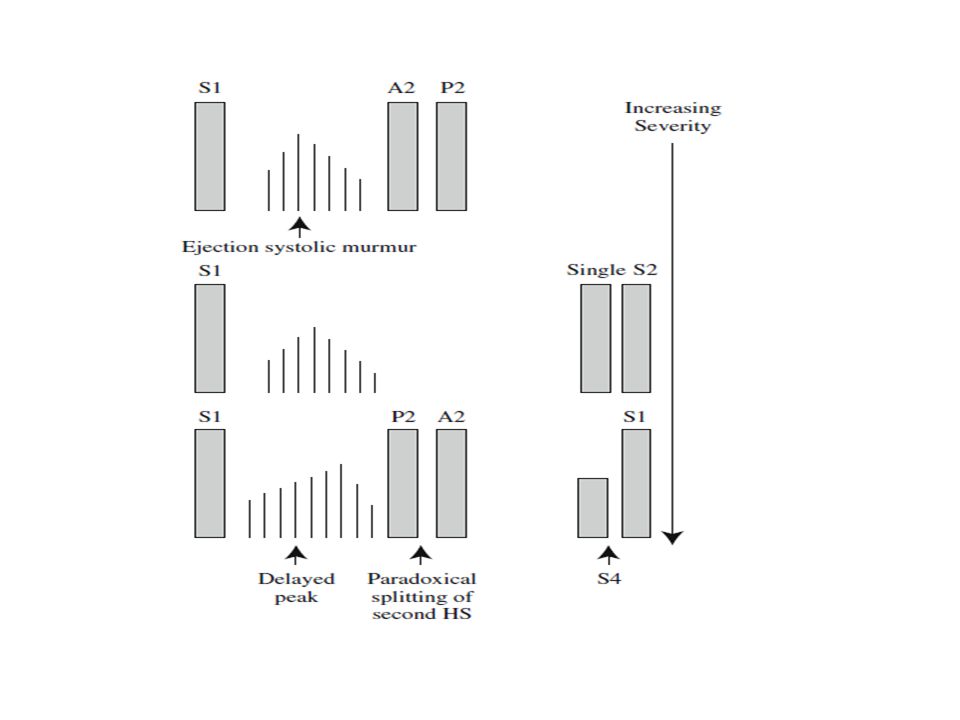
INTENSITY NL- Pliable, thin valves –BAV without calcification Dec –thickened rigid valves , calcification Severe -the stroke volume is ejected slowly and over a longer period and also leads to poor distension of the aortic root--softer A2 SPLITTING A2 moves into P2- 1) ↑ LV ejection 2) longer time for LV pr to drop below aortic at end systole Single Paradoxical splitt
 ↑ LV ejection 2) longer time for LV pr to drop below aortic at end systole. Single. Paradoxical splitt.")
37
S4 Correlates wit large LV-AO gradient and abnormally elevated LVEDP

38
AEC Localises and suggests etiology
sudden cessation of opening motion of abnormal valve leaflets(doming) Lost with calcification and thickening High frequency msec after S1 – best heard at apex-constant
 Lost with calcification and thickening. High frequency msec after S1 – best heard at apex-constant.")
39
Aortic ejection sounds and clicks, when present, are usually heard over the left sterna border and the apex. However, when caused by aortic root aneurysm they may be louder at the second and third right intercostal space at the sternal border

41
MURMUR Crescendo –decrescendo – shape of the pr diff bet LV-Ao
Site of max intensity and radiation- Length of the murmur-severity - time to peak intensity- 2nd half Frequency and pitch- rough ,grunting Harsh- mixed frequency at base – effect of jet to Ao high freq musical- vib fom leaflets with intact commissures , at apex Gallavardin murmur Amplitude - generally louder –severe - nonspecific

42
SEVERITY

43
Classification of Severity
Aortic Jet Velocity (m/s) Mean Gradient (mm Hg) Aortic valve Area (cm2) Normal < 2.5 =4(velocity)2 Bernoulli’s equation 3 – 4 Mild 2.5 – 2.9 < 25 1.5 – 2 Moderate 25 – 40 1 – 1.5 Severe > 4 > 40 < 1
 Mean Gradient (mm Hg) Aortic valve Area (cm2) Normal. < 2.5. =4(velocity)2. Bernoulli’s equation. 3 – 4. Mild. 2.5 – 2.9. < – 2. Moderate. 25 – – 1.5. Severe. > 4. > 40. < 1.")
45
However, calculated mean P Grd are comparable
Doppler data Peak instantaneous gradient over time Cath data Peak to peak data However, calculated mean P Grd are comparable

46
AORTIC STENOSIS- (LV-AO)
METHOD EASE OF USE DISADVANTAGE PULLBACK +++++ LEAST ACCURATE FEMORAL SHEATH PRESSURE AMPLIFICATION ILIAC ARTERY STENOSIS DOUBLE ARTERIAL PUNCTURE +++ EXTRA VASCULAR ACCESS RISK PIG TAIL- DOUBLE LUMEN DAMPING PIG TAIL + PRESSURE EXPENSE TRANSEPTAL ++ RISK

47
AVA Pull back hemodynamics : Peak – peak gradient alignment mismatch
Distortion of pulse - femoral artery peripheral pulse amplification catheter in LVOT central aorta - pressure recovery Carballo’s sign

48
AO & peripheral aorta (femoral sheath) showing peripheral amplification of 20 mmHg
 showing peripheral amplification of 20 mmHg")
50
Pull back

53
pulse pressure will increase after a PVC (negative Brockenbrough sign)
Brockenbrough sign post PVC compensatory pause causes increased filling, and increased preload. Frank-Starling law causes post PVC increased LV contraction with characteristically increased gradient pulse pressure will increase after a PVC inAS(negative Brockenbrough sign)
")
56
LVSP = left ventricular systolic pressure;
Schematic representation of the flow and static pressure across the left ventricular (LV) outflow tract, aortic valve, and ascending aorta during systole LVSP = left ventricular systolic pressure; MGnet= transvalvular pressure gradient after pressure recovery MGvc = transvalvular pressure gradient at the venacontracta SAP= systolic aortic pressure SAPvc = systolic aortic pressure at the vena contracta; SV = stroke volume Svi= stroke volume index ZVA= valvulo-arterial impedance.
 outflow tract, aortic valve, and ascending aorta during systole. LVSP = left ventricular systolic pressure; MGnet= transvalvular pressure gradient after pressure recovery. MGvc = transvalvular pressure gradient at the venacontracta. SAP= systolic aortic pressure. SAPvc = systolic aortic pressure at the vena contracta; SV = stroke volume. Svi= stroke volume index. ZVA= valvulo-arterial impedance.")
57
Downstream from the orifice, the flow stream expands and decelerates with a corresponding decrease in kinetic and increase in potential energy, a phenomenon called “pressure recovery” Thus, the net P between the LV and the mid-ascending aorta is lower than the pressure drop immediately adjacent to the valve Doppler measures velocity at the narrowest orifice, thus Doppler Ps are higher than the net P . The clinical impact of pressure recovery usually is small but can be significant with mild stenosis and a small aortic root or with a doming congenitally stenotic valve

58
PRESSURE RECOVERY Fluid energy= pressure energy+ kinetic energy
Narrowed orifice (vena contracta) highest velocity Downstream - flow stream expands Deccleration (decreased velocity- kinetic) Conversion kinetic – pressure (pressure recovery)
 highest velocity. Downstream - flow stream expands. Deccleration (decreased velocity- kinetic) Conversion- kinetic – pressure. (pressure recovery)")
59
Doppler derived gradients- using CW doppler @ vena contracta
Catheter derived gradients- downstream vena contracta- pressure recovery GRADIENT DERIVED BY CATH IS LOWER THAN DOPPLER DERIVED GRADIENT Pressure recovery- exaggerated in Smaller aorta Stiffer aorta Hypertension

60
Hypertension may mask the severity of stenosis, an Presence of stenosis may affect the optimal treatment of hypertension Combination of AS and hypertension- “double-loads” th ventricle Total afterload = the valve obstruction + elevated SVR stenosis severity Underestimated- “recovered” pressure, rather than vencontracta pressure, is rec

61
Stenotic valve area Torricelli’s law F = A X V A = F / V A = F / V Cc
F- Flow A- Valve area V- Velocity of flow Cc- coefficient of contraction

64
Mitral Valve = constant 0.7 (later changed 0.85)
Aortic valve: assumed to be 1

65
GORLIN FORMULA Empirical constant includes
Conversion of cms H2o to units of pressure Contraction co-efficient Velocity co-efficient Difference- valve area calculated- and valve area at surgery

66
GORLIN FORMULA Problems cardiac output Fick - oxygen consumption
Thermodilution- low output state - significant TR Duration of flow (SEP-DFP) Alignment mismatch Calibration errors
 Alignment mismatch. Calibration errors.")
68
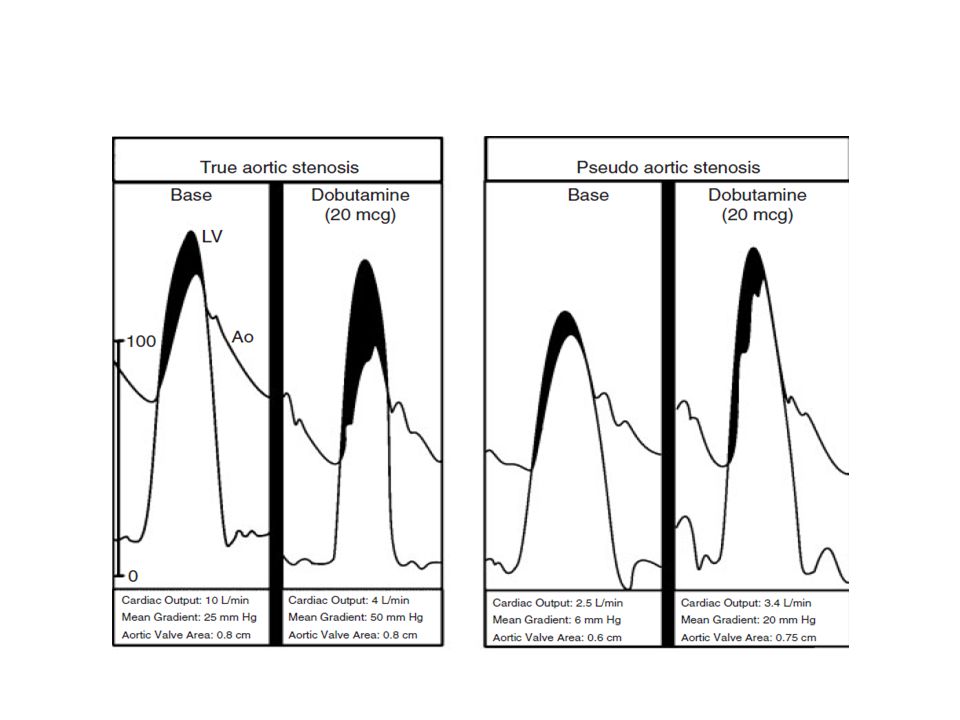
LOW OUTPUT LOWGRADIENT AS
Mean gradient < 40 in the setting of EF < 40 % Dobutamine Stoppage pnt- 40µ / kg / min - mean gradient > 40 mm hg -CO inc by 50 % -HR inc to < 140 / min - intolerable symptoms / side effects True stenosis-mean gradient > 30 mm hg - AVA remains 1.2 cm2 / less

70
Aortic valve area (AVA) is calculated based on the principle that volume flow proximal to the valve equals volume flow through the narrowed orifice
 is calculated based on the principle that volume flow proximal to the valve equals volume flow through the narrowed orifice")
71
Continuity equation V/S bernoulli
Co-existing AR LV-dysfunction

72
Simplification of the continuity equation is the
Dimensionless ratio of outflow tract to aortic velocity: Velocity ratio= (VLVOT) / VAS Reflects the relative valve si ze compared with the area of the patient’s outflow track Particularly useful when images of outflow tract diameter are suboptimal Ratio approaches 1 with a normal valve A ratio 0.25 indicates a valve area 25% of expected-severe stenosis
 / VAS. Reflects the relative valve si ze compared with the area of the patient’s outflow track. Particularly useful when images of outflow tract diameter are suboptimal. Ratio approaches 1 with a normal valve. A ratio 0.25 indicates a valve area 25% of expected-severe stenosis.")
73
M- mode Maximal aortic cusp separation (MACS)
Vertical distance between right CC and non CC during systole Stenotic AV → decreased MACS

74
M- mode Maximal aortic cusp separation (MACS) Vertical distance between right CC and non CC during systole Stenotic AV → decreased MACS AVA MACS N > 2cm2 N > 15 mm < cm2 < 8 mm > 1 cm2 > 12 mm gray area 8 – 12 mm

83
CATH

85
30% of patients with mild-to-moderate AS have clinical evidence of coronary disease; at pre-operative catheterization, significant coronary disease is present in about 50%

86
LV systolic dysfunction is an uncommon consequence of AS =about 5% of patients

87
Survival among Patients with Severe Symptomatic Aortic Stenosis Who Underwent Valve Replacement and Similar Patients Who Declined to Undergo Surgery10

89
AS w/ low output/low gradient

Similar presentations


 Chapter 8 Are G. Talking, MD, FACC Instructor Patricia L. Thomas, MBA, RCIS.>")


 CPP = aortic diastolic.>")


