Download presentation
Presentation is loading. Please wait.

1
Characteristics of Fairfax County That Contribute to Deer/Vehicle Collisions

2
Executive Summary Thousands of deer related accidents are reported each year Virginia Ranks 7 th in the nation for deer related accidents CNN online, 2006

3
Executive Summary The 2006 Deer Management Study conducted by the Virginia Department of Game and Inland Fisheries states that “Deer/vehicle collisions are one of the most critical types of deer damage in Virginia”.

4
Executive Summary Solutions: When addressing deer management solutions, cost and urban growth play a big part in the decision making process Management practices used in the past include: –managed deer hunts –citizen awareness programs

5
Executive Summary Solutions : –Fairfax County completed a “Crash Abatement Program” funded by VDOT. Roadside reflectors were installed on 7 sections of county roadway –Both Virginia and Fairfax County governments have deer management programs –Deer/vehicle collisions have been addressed in the plans

6
Executive Summary Urban sprawl is the root of the problem X Leveling the human population X Building moratoriums X Cease new road projects All are unrealistic!

7
Executive Summary Continued Deer Management Studies Decrease the deer population More effective deer management practices such as road barriers, signs and reduced speed limits on selective roadways. More realistic and cost-effective solutions!

8
Executive Summary What characteristics of Fairfax County contribute to deer and vehicle accidents?

9
Goals Use GIS to identify the characteristics of Fairfax County that contribute to deer/vehicle collisions Analyze roads, human population, deer population, and deer habitat to prove or disprove that they were contributing factors Apply deer/vehicle collision data to the characteristics and analyzed the results for relationships.

10
Objectives Research related studies Develop a plan and scope for the project Identify the Fairfax County characteristics that I would analyze Identify the data I would need for analysis Make a data model

11
Objectives Collect data Manipulate the data files for use in the GIS Extract the necessary data I needed Import the files into my personal geodatabase Begin project analysis

12
Data Model Project Goal Accident Data VDOT Deer Population VDGIF Land cover USGS Roads FFX GIS Human Population US Census Virginia Boundary FFX GIS

13
Data The data used in the deer/vehicle project were obtained from local and national sources: –Fairfax County GIS Department –Virginia Department of Transportation –The Weldon Cooper Center at UVA –USGS – Virginia Department of Game and Inland Fisheries.

14
Data VDGIF “Virginia Deer Management Plan 2006-2015 –Deer population abundance data was taken from the PowerPoint version of the plan –All of the data is freely available to the public on the web The Virginia Department of Transportation –Deer and vehicle accident data for 2003 – 2005 through the Freedom of Information Act –The files were in vector format and ready for analysis.

15
Data Fairfax County GIS –Available free of charge for educational purposes –Basic Fairfax County vector data in a geodatabase The Weldon Cooper Center at the University of Virginia –provided the human population data –downloaded for free at: http://www3.ccps.virginia.edu/demographics/estimate s/2005/0-main.html

16
Metadata, Projection and Storage Metadata was included with most of the Fairfax County GIS data Basic metadata was created for the data that I generated or converted Personal geodatabase: –ensure the integrity of my original data files –prevent any data corruption during the analysis phase –make it easier to find the files

18
Metadata, Projection and Storage Fairfax County GIS data - Virginia State Plane FIPS 4501 (Feet) Applied this projection to all of the unprojected data except land cover raster data Landcover dataset - NAD83 Albers Conical Equal Area Converted the Fairfax County shapefile to a raster file and changed the projection
 Applied this projection to all of the unprojected data except land cover raster data Landcover dataset - NAD83 Albers Conical Equal Area Converted the Fairfax County shapefile to a raster file and changed the projection")
19
Analysis The goal of this project was to identify the characteristics of Fairfax County that contribute to deer/vehicle collisions 1)Analyzed the incidents of deer/vehicle incidents in Virginia and Fairfax County 2)Applied data from five basic areas: deer population, human population, roads, and land use 3)Analyzed the resulting data to establish a relationship between the focus areas and deer/vehicle accidents in the county
Analyzed the incidents of deer/vehicle incidents in Virginia and Fairfax County 2)Applied data from five basic areas: deer population, human population, roads, and land use 3)Analyzed the resulting data to establish a relationship between the focus areas and deer/vehicle accidents in the county")
20
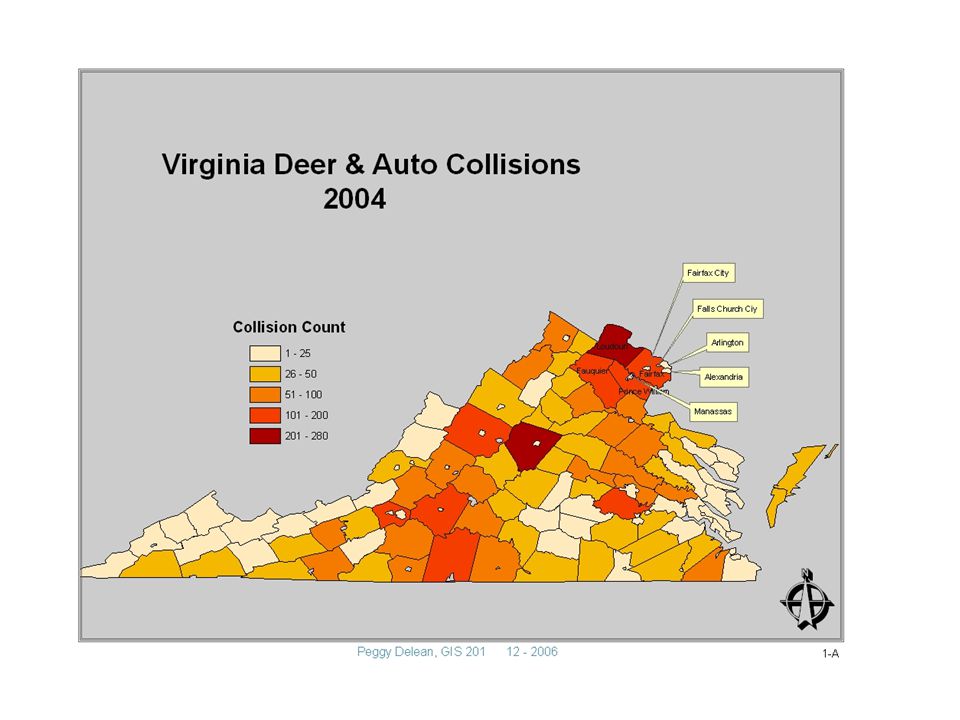
Analysis – Deer/Vehicle Accidents How Fairfax County ranks in relation to other Virginia counties Increase in incidents from one year to the next in Fairfax County *The incident data from VDOT was a spreadsheet of all vehicle accidents reported for the years 2002 – 2005. I used the data from 2003 – 2004.

21
Analysis - Collisions Analysis- 1.VDOT excel incident report > format each year (2003, 2004) > convert to dBase file > join with Virginia county shapefile > select by attribute “deer” collisions > new layers of deer/vehicle incidents in Virginia per county per year > layout > MAP 1-A 2. For 2003 and 2004 select by attribute “Fairfax County” > new layers of incidents in Fairfax County per year > summarize the total incidents per year > calculate the change between 2003 and 2004 > layout > MAP 1-B

24
Analysis-Deer Population The deer population in Virginia, as measured by VDGIF, is an estimate Deer population for Fairfax County is not comparable to the other counties mostly due to firearm restrictions in the county It is manipulated by VDGIF Used VDGIF data to show the “suggested” relationship to other Virginia Counties The relationship is informative Provides a comparative reference for the deer population in Fairfax County.

25
Analysis Analysis-Deer Population 1.PowerPoint data > Excel spreadsheet > Format > Database file 2.Database file > join to Virginia boundary shapefile > “VA deer population” layer 3.From “VA deer population” and “Deer density” layers > apply quantity symbology > graduated color map of the deer population in Virginia per county > layout > MAP 2-A

27
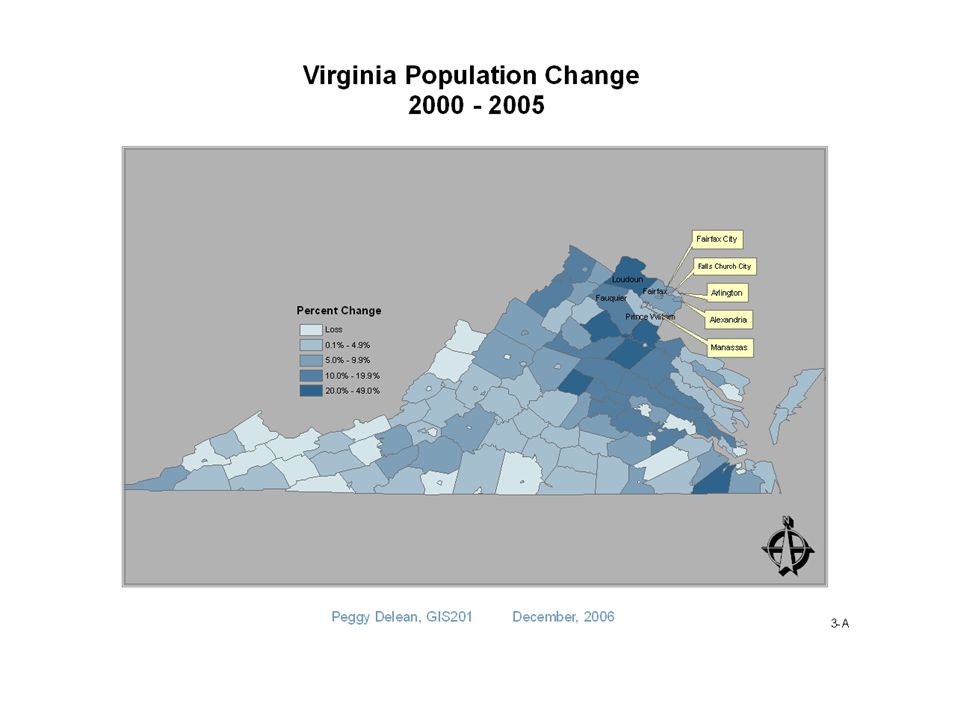
Analysis – Human Population Assumption - the population in Fairfax County has an indirect relationship in the study Increase of people in a defined area –less deer habitat –more cars on the road –more roadways –more deer/ vehicle collisions The population for surrounding counties was important to analyze because of the nature of the workforce in the Northern Virginia area

28
Analysis Analysis-State and N. VA Counties 1.UVA data > Excel spreadsheet > Format > Database file 2.Database file > join to Virginia Counties shapefile > “VA population” layer 3.From “VA population” layer > apply quantity symbology > graduated color map of the population in Virginia > layout > MAP 3-A

30
Analysis - Roads Three thousand, one hundred and twenty eight miles of roadway crisscross through Fairfax County Four interstates, three U.S. roads, and 18 state roads which alone account for 14% of measured roadway More vehicles will choose the major road routes over the secondary roads resulting in a higher chance of deer/vehicle collisions Speed is a factor in many vehicle collisions and I assume that deer collisions are not the exception.

31
Analysis - Roads Assumption: Road characteristics would have an impact on the number of deer/ vehicle collisions in Fairfax County Total length- total length of the major and secondary road data from Fairfax County GIS Type- Interstate, primary, secondary Speed- attribute of the road data

32
Analysis-Roads Analysis-Total Length and Type 1.Major roads and secondary roads > use summarize to get the total length of roads in Fairfax County 2.Major roads and secondary roads > use layer properties to symbolize unique values (NAME Field) > Layout > MAP 4-A
 > Layout > MAP 4-A")
34
Analysis-Roads Analysis-Speed Road shapefile > select roads with a speed limit greater than or equal to 45 mph. > Select by location all 2004 deer/vehicle collisions that intersect the selected roads > create layer of 2004 deer/vehicle incidents on roads that have a speed limit of 45 mph or more > layout > MAP 4-B

36
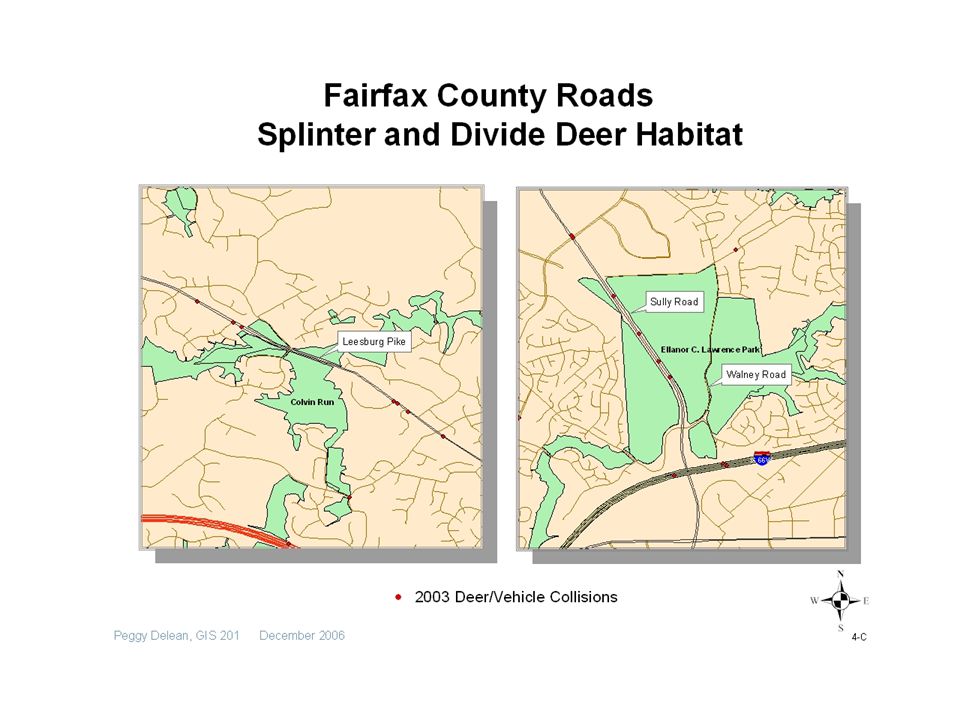
Analysis – Road Length and Location Assumption: the length and location of roads in Fairfax County affects the area of continuous deer habitat Deer will wander from one habitat area to another looking for food, water, coverage or space Analyzed the FCPA and NON-FCPA shapefiles from Fairfax GIS with relation to the road files to see if the habitat (parks) were splintered or divided by a roadway.
 were splintered or divided by a roadway.")
37
Analysis-Roads Analysis-Habitat (Parks) FCPA and NON-FCPA parks > add road shapefiles > select by location FCPA parks that intersect roads > add to the selection all NON-FCPA parks that intersect roads > zoom in to selected park areas > analyze for those parks that are divided or splintered by roads > layout > MAP 4-C
 FCPA and NON-FCPA parks > add road shapefiles > select by location FCPA parks that intersect roads > add to the selection all NON-FCPA parks that intersect roads > zoom in to selected park areas > analyze for those parks that are divided or splintered by roads > layout > MAP 4-C")
39
Analysis – Land Use Fact: the quantity and quality of deer habitat directly affects the deer population Assumption: The land use patterns in Fairfax County affect the total area of deer habitat Deer habitat, as defined by VDGIF, is the sum of forested, open/agriculture, and wetland land areas

40
Analysis – Land Use 2001 U.S. Geological Survey’s National Land Cover Dataset (NLCD) Deer Habitat = deciduous forest, evergreen forest, mixed forest, shrub/scrub, sedge/herbaceous, pasture/hay, cultivated crops, woody wetlands, and estuarine scrub/shrub wetland According to figures based on the 1992 Land Cover Dataset, 61 percent of the land in Fairfax County was deer habitat (VDGIF Deer Management Plan)***
 Deer Habitat = deciduous forest, evergreen forest, mixed forest, shrub/scrub, sedge/herbaceous, pasture/hay, cultivated crops, woody wetlands, and estuarine scrub/shrub wetland According to figures based on the 1992 Land Cover Dataset, 61 percent of the land in Fairfax County was deer habitat (VDGIF Deer Management Plan)***.")
41
Analysis-Land Use Analysis 1.Fairfax County boundary shapefile > use project raster > new raster file of the boundary that has the same projection as the land cover raster file 2.Use raster calculator to select data classes for deer habitat area > new raster file of deer habitat area in Fairfax County > calculate the percent of deer habitat in Fairfax County > reclassify > MAP 5-A

43
Conclusion The deer/vehicle collisions in Fairfax County are the third highest in the state of Virginia All characteristics of Fairfax County contribute to deer/vehicle accidents Not one single characteristic can be identified as the “main” reason

44
Conclusion Deer population in the county is steady Their mere presence in an urban area like Fairfax County is a contributing factor in the study Deer are forced to cross roads for food, water and coverage and their habitat is slowly being divided or encroached upon Length of roads and the posted speed limits on the roads also seem to impact the deer/auto collision rate in the county The higher speed limits and sheer number of cars on the roads result in a higher chance of hitting a deer

45
Conclusion A consistent human population growth in the county and in the Northern Virginia area seems to impact all of the characteristics analyzed in the study The continued influx of people into Fairfax County and the surrounding metropolitan area creates a need for more houses, buildings, and roads. Each need impacts the overall deer/vehicle collision rate.

46
Conclusion The solution to the deer/vehicle collision rate in Fairfax County is as complex as the characteristics that contribute to it The most effective solutions like placing a moratorium on building or roads are highly unlikely Cost effective solutions that should be considered: 1.electrical road signs at “hot spots” 2.reduced speed limits during the deer mating season 3.public awareness 4.Managed deer hunts

47
Future Research Deer management and study should be an ongoing project “Hot spot areas” can be studied Take the findings from this study and conduct a more in depth analysis Results from deer management practices already in use should be analyzed for effectiveness.

48
REFERENCES Virginia Department of Game and Inland Fisheries. 2006. Virginia Deer Management Plan; 2000-2015 U.S. Department of Interior, Geological Survey. 2001. National Land Cover Dataset. Digital Data The Waldon Cooper Center For Public Services, University of Virginia. 2005. Population Estimates. Digital Data Fairfax County GIS Department, Fairfax County. Geographic Information Services. GIS Data. 2006. Fairfax, Virginia 22035 Virginia Department of Transportation. Public Information Department. 2003-2005. GIS Data

Similar presentations


>")


