Download presentation
Presentation is loading. Please wait.

1
David Granatstein WSU Center for Sustaining Agriculture and Natural Resources Wenatchee, WA Orchard Floor Management

2
FunctionsImpacted by: Water intake/storageUnderstory species Physical supportUnderstory canopy Gas exchange for rootsIrrigation system Nutrient cycling/storageNutrient inputs Habitat (micro, macro)Spray drip Micro-climateOrganic inputs
Spray drip Micro-climateOrganic inputs")
3
Orchard Floor Management Review Microclimate: soil temperature inverse to the amount of herbage or mulch plant mulch dampens extremes of daily soil temperature plant cover reduces minimum air temperature by 0.5-1.0 o C bare, compacted wet soil raised minimum air temperature by as much as 2 o C dwarf rootstocks grow best at 14 o C vs. up to 27 o C for seedling rootstocks (Skroch & Shribbs, 1986)
.")
4
Orchard Floor Management Review Soil quality: avoid cultivation favorable soil effects: legumes > grass > mulch > bare ground > cultivation Water: soil moisture availability mulch > bare soil > minimal cultivation > grass > legumes >continuous cultivation mowing decreases water use (Skroch & Shribbs, 1986)
")
5
SOIL Complex, dynamic living medium as indispensable to plant growth as sunlight and air. Civilizations have fallen throughout history due to failure to maintain the quality of soils. Source and medium of delivery of most water and nutrients for plants. Defined by its physical, chemical, and biological properties..

6
SOIL QUALITY Definition “Capacity of a soil to function within ecosystem boundaries to: sustain biological productivity Maintain environmental quality promote plant and animal health.” Not a soil property, but a value based on human needs. Soil health and quality are used interchangeably.

7
Soil Quality Chemical BiologicalPhysical Dynamic interplay of 3 aspects Short-term and long-term changes Influenced by environment (climate, geology, plants) Influenced by human activity (erosion, fertilization, irrigation, plants)
 Influenced by human activity (erosion, fertilization, irrigation, plants)")
8
Soil Quality Reference Point Current System Native Ecosystem Reference Point Dryland wheat (KS) PrairiePrairie Rainfed corn (WI) Temperate forest Pasture ? Paddy rice (Asia) Tropical rainforest ?? Irrigated potatoes (ID) Shrub-steppe Pasture ? Orchard (Yakima) Shrub-steppe ??
 Tropical rainforest . Irrigated potatoes (ID) Shrub-steppe Pasture . Orchard (Yakima) Shrub-steppe .")
9
INDICATORS OF IMPROVED SOIL QUALITY Increasing:Decreasing: InfiltrationBulk density Aggregate stabilitySoil resistance MacroporesRunoff AerationErosion Biological activityNutrient losses Water-holding capacityDiseases Soil organic matterProduction costs

10
Carbon – the key ingredient Carbon (C), the basis of Soil Organic Matter, which affects: Physical – bulk density, aggregate stability, water-holding capacity Chemical – cation exchange capacity, nutrient release Biological – energy source for microbes, base of the soil food web, nutrient turnover, soil-borne diseases
, the basis of Soil Organic Matter, which affects: Physical – bulk density, aggregate stability, water-holding capacity Chemical – cation exchange capacity, nutrient release Biological – energy source for microbes, base of the soil food web, nutrient turnover, soil-borne diseases")
11
SOIL ORGANIC MATTER Friends:Enemies: No-tillTillage MulchingErosion Organic amendmentsFumigation Cool temperaturesHerbicides, bare ground Nutrient balanceLeaching, nutrient export

12
Carbon Budget Inputs Crop residues – leaves, roots, prunings Green manures Animal manures Imported organics – compost, yard debris, etc. Losses Background soil respiration Tillage – accelerated mineralization Erosion – wind, water Crop export – roots Burning

13
Soil Quality Testing Chemical BiologicalPhysical Integration Soil Quality Index

14
Testing Approaches Soil – physical, chemical, biological Plant – bioassay Ecosystem – watershed, energy, diversity

15
Soil Quality Index – Orchard Systems Four soil functions (after Karlen et al., 1994): Accommodate water entry (weight 0.20) Facilitate water transfer and absorption (weight 0.20) Resist degradation (weight 0.20) Sustain fruit quality and productivity (weight 0.40) (Glover et al., 1998)
: Accommodate water entry (weight 0.20) Facilitate water transfer and absorption (weight 0.20) Resist degradation (weight 0.20) Sustain fruit quality and productivity (weight 0.40) (Glover et al., 1998)")
16
Soil Quality Index Function: Accommodate water entry Weight Indicator:Infiltration0.40 Aggregate stability0.30 Surface bulk density0.20 Earthworms0.10 (Glover et al., 1998)
")
17
Soil Quality Index Function: Facilitate water transfer and absorption Weight Indicator:Water filled pore space0.40 Porosity (0-15 cm)0.30 Organic C (0-15 cm)0.15 Earthworms0.15 (Glover et al., 1998)
0.30 Organic C (0-15 cm)0.15 Earthworms0.15 (Glover et al., 1998)")
18
Soil Quality Index Function: Resist degradation Weight Indicator:Aggregate stability0.60 Microbial processes0.40 (Glover et al., 1998)
")
19
Soil Quality Index Function: Sustain fruit quality and productivity Weight Indicator:Rooting environment0.27 Water relations0.27 Nutrient relations0.26 Chemical barriers0.20 (Glover et al., 1998)
")
20
Soil Quality Index for 1998 WSU Orchard Systems Trial – Zillah, WA Orchard System Function ConventionalIntegrated Organic Water entry0.09 0.140.17 Water transfer0.17 b 0.19 a0.17 b Resist degrad.0.14 b 0.20a0.16 ab Sustain product.0.13 b 0.34 a0.36 a Total0.71 b 0.87 a0.86 a (Glover et al., 1998)
")
21
WSU Orchard Systems Trial - Zillah, WA Soil Organic Matter Content (0-15 cm)
")
22
Soil Biology The last frontier ? The ultimate black box ? Microbe - Microbe Microbe - Macrofauna Microbe - Plant

23
Effect of Apple Replant Disease – Gala/M26, Moxee, WA Replant soil‘Virgin’ soil

24
Growth of ‘Gala’ Apple Seedlings in Soil from Orchard Blocks of Varying Age

25
Changes in Relative Recovery of Specific Microorganisms with Increasing Age of WVC Orchard Blocks

26
Cover Crops and Fallow No change in disease pressure with one-year fallow Wheat cover crops effective in reducing Rhizoctonia, Pythium, Pratylenchus penetrans; inducing microbial shifts; and enhancing tree seedling growth Effect of wheat is very cultivar-specific Rapeseed cover crop moderately effective, but soil amendment with rapeseed meal is promising

27
Growth of ‘Gala’ Apple Seedlings in CV Orchard Replant Soil Following Planting with Different Wheat Cultivars

28
Other Cultural Controls Autumn trenching nearly as effective as soil fumigation Planting new tree rows in former drive aisles also effective Alternating between apple and non-susceptible perennial crop (e.g. cherry) Plant more resilient or vigorous rootstocks
 Plant more resilient or vigorous rootstocks.")
29
Trench Control

30
Recovery of Fungi from Apple Roots at CV Orchard

31
Organic Amendments

32
Evaluating Compost Quality for Orchard Use What end use? Absence of contaminants Maturity Moisture content Organic matter Electrical conductivity (EC) pH Total N Available N
 pH Total N Available N.")
34
Nutrient Content of WA Composts Parameter Chicken (3)Cow (4) Yard (3) Org. Matter (%) 4-78 30-5030-50 pH 6.3-8.3 6.1-8.96.3-7.6 E.C. (mmho/cm) 25-30 7-25 2-13 C:N 10-38 10-3213-23 Total N (%) 1.1-4.2 0.9-1.90.8-2.0 NO 3 -N (ppm) 162-2460 36-2081 8-1421 NH 4 -N (ppm)3600-9780 16-306 17-50 Total P (%) 0.9-1.8 0.2-0.8 0.2-0.3 Total K (%) 0.6-2.5 0.3-1.4 0.4-1.1 (Granatstein, 1996)
 pH E.C. (mmho/cm) C:N Total N (%) NO 3 -N (ppm) NH 4 -N (ppm) Total P (%) Total K (%) (Granatstein, 1996).")
35
Comparison of Testing Labs Mean RangeC.V. pHChicken 6.6 5.7 – 7.7 10 Yard 6.9 6.5 – 7.3 5 E.C.Chicken 25 14 – 38 34 (mmho/cm)Yard 7 4 – 11 36 Total NChicken 3.6 2.9 – 4.2 12 (%)Yard 1.2 0.9 – 1.4 16 NH4-NChicken86206700 – 10500 19 (ppm)Yard 370 17 - 1400158 Low C.V. – pH, total N, total P, organic matter
Yard 7 4 – Total NChicken – (%)Yard – NH4-NChicken – (ppm)Yard Low C.V. – pH, total N, total P, organic matter.")
36
Compost Costs $/wet ton $/wet ton $/dry ton $/lb N FOB Freight Delivered dry Chicken manure 40301071.31 compost Dairy manure 2417801.74 compost Yard debris 1426702.69 compost

37
Nutrient $ Value of Compost Value $/wet ton TotalAvailableNutrient Chicken manure compost$41-53$13-14 (4% total N) Yard debris compost$20-23 $5 (2% total N) Includes N, P, K, Ca, S, Zn (37¢lb N; 40-90¢/lb P; 21¢/lb K; 9¢/lb Ca; 11¢/lb S; $1.40/lb Zn) Based on fertilizer prices of 2/98.
 Yard debris compost$20-23 $5 (2% total N) Includes N, P, K, Ca, S, Zn (37¢lb N; 40-90¢/lb P; 21¢/lb K; 9¢/lb Ca; 11¢/lb S; $1.40/lb Zn) Based on fertilizer prices of 2/98.")
38
Organic N Sources and Costs

39
Disease Suppression with Compost Need sufficient organic matter to support microbial growth/activity General Suppression – occurs as compost matures and limits readily available substrate; effective on Pythium, Phytophthora Specific Suppression – requires colonization by microbial antagonists of pathogen; needed for Rhizoctonia Suppressive ability hard to predict in terms of range and longevity of control; influenced by compost feedstocks, production process

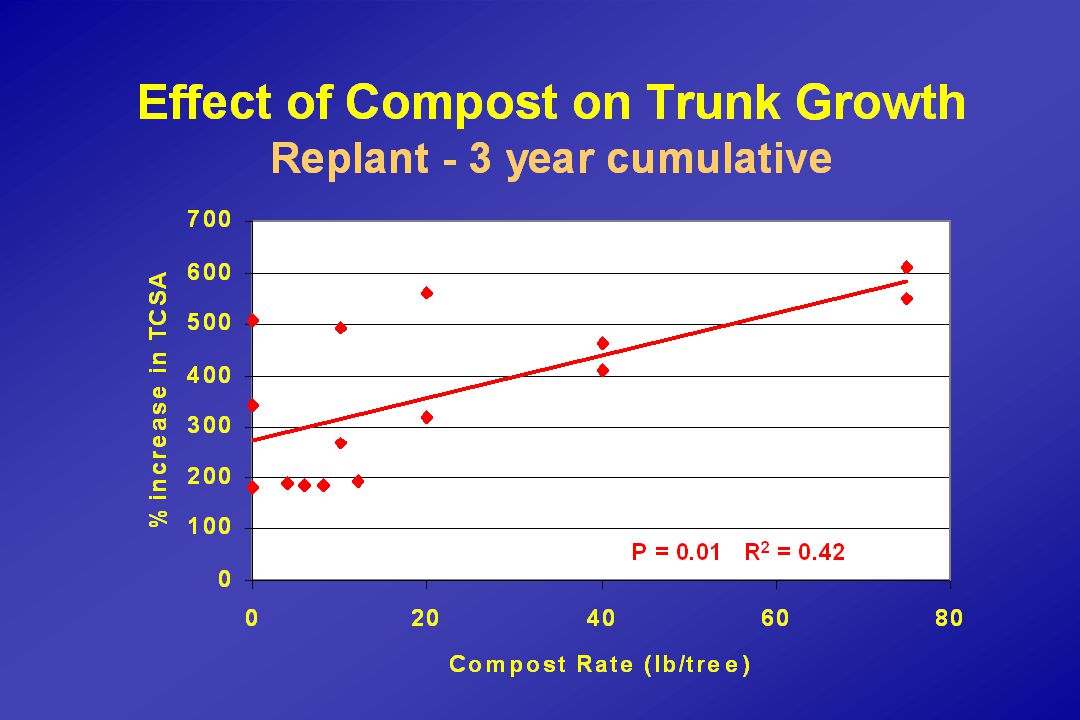
41
Effect of Compost on Trunk Growth New orchard sites - 3 year cumulative P = 0.04 R 2 = 0.22

42
Foliar Disease Control with Compost Tea – Oregon, 1996 No Water Compost Best Crop/DiseaseTrt Control Tea Fungicide - - - - - - % infection or infestation - - - - - - Apple/Scab Leaves41--4013 Fruit52--3711 Cherry Blossom blight11-- 6 3 Cherry leaf spot62--42 5 Grape/Powdery Mildew Leaves--2519 8 Clusters--251710 (H. Wittig, 1997)
.")
43
Compost Tea and Pathogens Can Human Pathogens Grow In Compost Tea? Addition of molasses led to Salmonella growth (3 log or more) No growth without molasses Tea sprayed on strawberry plants, pathogens grew on leaves (B. Duffy, USDA-ARS)
 No growth without molasses Tea sprayed on strawberry plants, pathogens grew on leaves (B. Duffy, USDA-ARS).")
44
Orchard Mulching and Cover Crops Weed control – non-herbicide; suitable for organic production Moisture conservation Fertility management, soil quality Pest management ?

45
Orchard Cover Crops Purposes: Prevent erosion, dust Reduce effects of equipment on compaction Improve soil quality and nutrient cycling Improve orchard IPM

46
Orchard Cover Crops A good cover crop… Limited competition with the tree Poor habitat for rodents, other pests Good habitat for beneficial species Improves soil quality

47
Area and Timing of Weed Control – New York ‘Imperial Gala/M.26 Weed-freeCum. YieldCum. Growth area (ft 2 ) (kg/tree) TCSA (cm 2 ) 0 14.9 20.0 22 41.0 25.5 43 38.2 25.6 65 41.1 24.7 LSD(.05) 11.0 5.1 Planted in 1991; cumulative data for 1991-1995. (Merwin & Ray, 1997)
 (kg/tree) TCSA (cm 2 ) LSD(.05) Planted in 1991; cumulative data for (Merwin & Ray, 1997).")
48
Area and Timing of Weed Control – New York ‘Imperial Gala/M.26’ Weed Control TimeCumulative Yield (days) (month) (kg/tree) 0check15.0 30May34.4 30June34.5 30July30.7 30August36.6 60Ma, Jn46.3 60Jn,Jy42.7 60Jy, Au40.5 90Ma, Jn, Jy51.9 90Jn, Jy, Au46.0 (Merwin & Ray, 1997)
 (month) (kg/tree) 0check May June July August Ma, Jn Jn,Jy Jy, Au Ma, Jn, Jy Jn, Jy, Au46.0 (Merwin & Ray, 1997)")
49
Costs of Orchard Weed Control – New York Cost (US$/acre/yr) SystemMaterials Labor Total Hay-straw mulch300-400 145300-550 Wood chip mulch 0-20 295130-315 Weed collar TM 9800 200 10,000 1.2 mil polyethylene 150 35 185 Belton-Sarlon plastic 735 35190-770* Warren’s Weed-arrest TM 1800 35395-1835* Herbicide strip 10 5 15-50 Mowed sodgrass 30 40 70-100 Clean cultivation 15 35 50 *cost based on 1-4 yr life of material (Merwin, 1995)
 SystemMaterials Labor Total Hay-straw mulch Wood chip mulch Weed collar TM , mil polyethylene Belton-Sarlon plastic * Warren’s Weed-arrest TM * Herbicide strip Mowed sodgrass Clean cultivation *cost based on 1-4 yr life of material (Merwin, 1995)")
50
Orchard Floor Management – New York Soil Changes Over 5 Years SOM NO 3 -N P K Treatment (g/kg soil) (kg/ha) (kg/ha) (kg/ha) Mowed sod5.6 6.3 5.7 209 Straw mulch6.237.628.51230 Glyph. 5’ strip4.9 8.3 6.4 201 Tilled4.553.2 4.7 188 LSD(.05)1.030.112.0 163 (Merwin & Stiles, 1994)
 (Merwin & Stiles, 1994).")
51
Effect of Orchard Floor Management on Tree Mortality After 6 Years - New York (Merwin & Stiles, 1994)
")
52
Wood chip mulch, Wenatchee, WA.

53
Shredded paper mulch, Wenatchee, WA

56
Fall-planted Dwarf white clover

57
Fall-planted Oriental mustard

61
Spray-on paper mulch

62
Orchard Mulching Trials – Summerland, BC Bulk Density: biosolids treatments 0.92 vs. check 1.51 Moisture Retention: biosolids, composted biosolids sign. >> check Soil Temperature: maximums lower under mulches, except greatest (+10 o C) under geotextile Infiltration Rate: inhibited by geotextile; all other mulches sign. >> check
 under geotextile Infiltration Rate: inhibited by geotextile; all other mulches sign. >> check.")
63
Orchard Mulching Trials – Summerland, BC 5 th Leaf Spartan / M.9 TCSA Roots Yield (mm 2 ) (g/0.018m 3 ) (kg/tree) 1. Check (glyphosate)1011 b 11.3 c 10.3 c 2. Biosolids (Vancouver)1052 b 16.9 bc 11.2 bc 3. Paper mulch1565 a 28.7 abc 13.0 ab 4. 2 + 31490 a 41.8 a 13.9 a 5. Composted biosolids + 31406 a 38.7 a 14.9 a 6. Alfalfa hay1203 b 35.2 ab 14.0 a 7. Geotextile1125 b 19.1 bc 12.7 abc (Hogue et al., 2000)
1011 b 11.3 c 10.3 c 2. Biosolids (Vancouver)1052 b 16.9 bc 11.2 bc 3. Paper mulch1565 a 28.7 abc 13.0 ab a 41.8 a 13.9 a 5. Composted biosolids a 38.7 a 14.9 a 6. Alfalfa hay1203 b 35.2 ab 14.0 a 7. Geotextile1125 b 19.1 bc 12.7 abc (Hogue et al., 2000).")
64
WVC Mulch Trial Treatments compared to Control: 3-yr 2-yr 2001 TCSAYieldYld Eff. Alfalfa+63%+40% +60 (ns) Clover+30%+35%+130% Woodchip+26%+ 0%+105%
 Clover+30%+35%+130% Woodchip+26%+ 0%+105%.")
65
WVC Mulch Trial

66
N Release from Clover Living Mulch A = Control + CoverD = Clover – Cover + Clippings B = Control + Cover + ClippingsE = Control (no tube) C = Clover + Cover + ClippingsF = Clover (no tube)
 C = Clover + Cover + ClippingsF = Clover (no tube)")
67
N Release from Clover Living Mulch A = Control + CoverD = Clover + Cover B = Control + Cover + ClippingsE = Control (no tube) C = Clover + Cover + ClippingsF = Clover (no tube)
 C = Clover + Cover + ClippingsF = Clover (no tube)")
68
WVC Mulch Trial Weed Biomass 9/99 a a a b 9/21/99

69
WVC Mulch Trial Weed Control by Mulches – 6/1/00

70
Effect of Mulches on Nematodes in Orchard Soil - Summerland, BC (Hogue et al., 1998)
")
71
Pest Reduction with Cover Crops Cover crops can control tree vigor through regulation of N and water. Apple (WV) – lower aphid populations in trees with cover crop than with herbicide strip; also 50% less powdery mildew, slightly less scab, and no fireblight with lower vigor (Brown & Schmitt, 1996) Apple (BC) – much less aphid infestation with white clover/grass cover vs. rye, herbicide strip, weed barrier; clover mix competed with trees, reduced vigor, which reduced aphids (Haley & Hogue, 1990)
 – lower aphid populations in trees with cover crop than with herbicide strip; also 50% less powdery mildew, slightly less scab, and no fireblight with lower vigor (Brown & Schmitt, 1996) Apple (BC) – much less aphid infestation with white clover/grass cover vs. rye, herbicide strip, weed barrier; clover mix competed with trees, reduced vigor, which reduced aphids (Haley & Hogue, 1990).")
72
Pest Reduction with Cover Crops Successful examples usually involve a specific pest- predator relation. Pecans (GA) – control of pecan aphid with convergent lady beetle; grow cover crop of hairy vetch; produced two generations of lady beetles, reaching 143,000/acre; migrated from ground cover (senescing) to pecan trees at time when aphids are reaching peak levels; effective biocontrol achieved (Tedders, 1983) Citrus (China) – control of citrus red mite by natural enemies (Amblyseius spp.) encouraged on the weed Ageratum conyzoides; cover is planted or conserved; used on over 135,000 ha of citrus (Liang & Huang)
 – control of pecan aphid with convergent lady beetle; grow cover crop of hairy vetch; produced two generations of lady beetles, reaching 143,000/acre; migrated from ground cover (senescing) to pecan trees at time when aphids are reaching peak levels; effective biocontrol achieved (Tedders, 1983) Citrus (China) – control of citrus red mite by natural enemies (Amblyseius spp.) encouraged on the weed Ageratum conyzoides; cover is planted or conserved; used on over 135,000 ha of citrus (Liang & Huang).")
73
Cover Crops in Apples – Royal City, WA Pest / beneficial ratios 3 best3 worst Bug ‘n Breakfast Mix5.6Grass B331.8 Special Insectary6.2Grass BP17.9 Special cover7.0Grass B114.6 (Granatstein, 1995)
")
74
Spiders Harvestmen Effect of mowing on insect fauna in pears Hood River, OR (Horton, 1998) Density (ratio to weekly mowing) Floor Monthly Unmowed
 Density (ratio to weekly mowing) Floor Monthly Unmowed")
75
(Horton, 1998) Effect of mowing on insect fauna in pears Hood River, OR Unmowed Monthly Density (ratio to weekly mowing) Floor
 Effect of mowing on insect fauna in pears Hood River, OR Unmowed Monthly Density (ratio to weekly mowing) Floor")
76
Effect of mowing on insect fauna in pears Hood River, OR Monthly Unmowed Density (ratio to weekly mowing) Floor (Horton, 1998)
 Floor (Horton, 1998)")
77
Effect of mowing on insect fauna in pears Hood River, OR (Horton, 1998) Density (ratio to weekly mowing) Monthly Unmowed Tree
 Density (ratio to weekly mowing) Monthly Unmowed Tree")
78
Effect of mowing on insect fauna in pears Hood River, OR Tree (Horton, 1998) Density (ratio to weekly mowing) Monthly Unmowed
 Density (ratio to weekly mowing) Monthly Unmowed")
79
Effect of mowing on insect fauna in pears Hood River, OR Density (ratio to weekly mowing) (Horton, 1998) Monthly Unmowed Floor
 (Horton, 1998) Monthly Unmowed Floor")
80
Enviroscan Mulch Trial An automated system that continuously measures soil moisture content.

81
Enviroscan probe Individual sensors Access tube

82
WVC – Enviroscan Results Mulch No mulch Wood chip mulch led to 20-25% less moisture depletion between irrigations.

86
Summerland, BC - Cumulative Water Use 0 200 400 600 800 1000 1200 051015202530354045 Trunk Diameter (mm) L H 2 O used (15/06 to 23/08) Mulch No mulch
 L H 2 O used (15/06 to 23/08) Mulch No mulch")
87
Mulching Summary Moisture monitoring alone reduced irrigation frequency by 50% Mulching reduced moisture depletion another 20-25% on established trees Mulches can provide adequate weed control Low-cost approaches are needed to make mulching practical

88
Good Bets for Soil Health Reduce tillage, stop erosion, maintain soil structure Keep the soil covered Maintain adequate C, N inputs Promote diversity, rotate crops Monitor soil moisture to avoid excess

89
Knowledge Gaps Pest ecology in complex systems Pest / nutrition interactions Manipulation of rhizosphere Chemical ecology of plants Nutrient flow through orchard

90
Orchard Floor Management Net effect is the interaction of: plant species management nutrient levels pests weather irrigation Harder to predict single component impacts.

Similar presentations


 with contribution from Willie Towers (MLURI) Soils in Scotland / Soil quality Biomass production impacts.>")


