Download presentation
Presentation is loading. Please wait.

1
© 2012 by ACT, Inc. All rights reserved. ACT — Cognitive and Non- Cognitive Factors that Determine Student College and Career Readiness April Hansen, Postsecondary Director George Schlott, Senior Consultant for Program Solutions ACT, Inc. – Midwest Region-Lincolnshire IL

2
What is College and Career Readiness? Ensuring that all students, graduating from high school, have acquired the skills in English, mathematics, reading, and science that they need to be ready for entry-level college courses without remediation

3
Planning for School Improvement Improving Course Rigor Measuring Student Progress Toward College and Career Readiness Research EXPLORE 8 th & 9 th grade curriculum- based educational and career planning program PLAN 10 th grade curriculum- based educational and career planning program The ACT 11 th & 12 th grade curriculum- based measureme nt for learning outcomes ENGAGE Middle and High School assessment that measures factors of academic success QualityCore Research- driven solutions for strengthening curriculum & instruction CoreWork Diagnostics Online service to diagnose and improve content and practice areas ACT College Readiness Standards ACT College Readiness Benchmarks ACT Core Course Standards WorkKeys Job skill assessments and portable credentials necessary for career pathways College & Career Readiness Information System Core Practice Audit Online service to diagnose and improve content and practice areas

4
Through collaborative research with postsecondary institutions nationwide, ACT has established the following college readiness benchmarks*: * Minimum score needed on an ACT subject-area test to indicate a 50% chance of obtaining a B or higher or a 75% chance of obtaining a C or higher in the corresponding first-year credit-bearing college course. TestCollege CourseACT English English Composition 18 Math College Algebra 22 Reading Social Science 21 Science Biology 24 TestCollege Course EXPLORE 8EXPLORE 9PLAN 10ACTCOMPASS English English Composition Math College Algebra Reading Social Science Science Biology 13 17 15 20 14 18 16 20 15 19 17 21 18 22 21 24 69 65 88 NA

5
Students who are college/career ready when they leave high school have a significantly higher likelihood of: –Enrolling in a postsecondary program, –Enrolling in credit bearing courses without the need for remediation, –Succeeding in entry level postsecondary course work, –Persisting in their postsecondary education, –Completing a postsecondary degree or training program, and –Entering the job market with significantly higher lifetime earning potential. Regardless of ethnicity and SES Value of College Readiness

6
© 2012 by ACT, Inc. All rights reserved.6 Many students are not prepared to meet the hurdles they face throughout the academic pipeline, and they don’t persist and succeed. NCES 2010 What can we do to improve student success and persistence? Enter 9 th grade HS Graduate Enter College College Graduate (Bachelor’s) ~100%96.9%74.9%52.5%29.0% Leaky Educational Pipeline
 ~100%96.9%74.9%52.5%29.0% Leaky Educational Pipeline.")
7
Pop Quiz What’s the number of American high school students who drop out of school, every day, bored, frustrated, or so far behind that they’ve given up? 6,000

8
Two-year schools -- 54 % Four-year private colleges -- 73% Four-year public -- 71% * *Wes Habley, ACT, January 2009 By 2020: Cost of the average private--$60-70,000 per year Cost of the average public--$17,500-27,500 per year In 2008: Out of approx. 1.8 million first year college students, 450,000 did not return to the college or university where they began their college career.* That’s 25%. *Bryan Matthews, Retention Matters, Inside Higher Ed, Nov. 2, 2009 Attrition Costs Money

9
If you have an incoming class of 1000, and lose even 10% of the class (100 students), that’s 100 x $30,000 = $3 million $3 million x 4 years = $12 million Retaining students allows you to maintain revenue streams while keeping tuition increases down. It’s the low hanging fruit. Do the Math!

10
evaluate students’ personal, behavioral, and academic skills critical to high school and college achievement determine their levels of academic risk apply specific interventions to help them persist in their studies and achieve academic success identify student strengths and areas for improvement in student motivation, social engagement, and self-regulation predict college retention for each incoming freshman What if you had an assessment that would:

11
Research is the Foundation 1.The strongest predictors of college persistence and degree completion are: prior academic achievement and course selection (rigorous high school classes). 2.Prior academic achievement and cognitive ability surpass all other factors in their influence on student performance. 3.Non-academic factors can influence academic performance, retention and persistence, but cannot substitute for it.

13
Grades 6-9 Grades 10-12 College Teacher You Do!

14
© 2012 by ACT, Inc. All rights reserved.14 Create a comprehensive assessment system that predicts success in education and work Tailor assessments for critical transition points and context Measure characteristics amenable to change Help educators connect students’ needs to interventions

15
© 2012 by ACT, Inc. All rights reserved.15 A chievement Grades CollegeWork 6789101112 EXPLORE ® PLAN ® ACT ® COMPASS ® ENGAGE and ENGAGE Teacher Edition ENGAGE B ehavior WorkKeys ® Talent ACT Interest Inventory & Map of College Majors C areer Fit

16
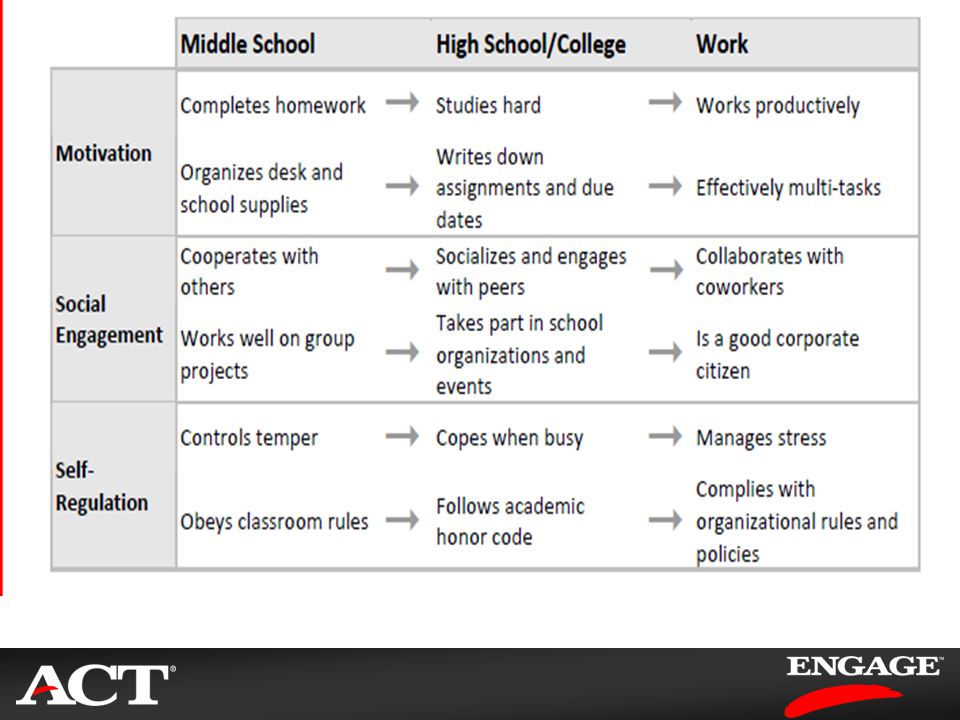
© 2012 by ACT, Inc. All rights reserved.16 Students’ personal characteristics and psychosocial development influence their ability to stay in school and be successful ACT research shows that psychosocial/behavioral development can be structured into 3 broad domains: –Motivation –Social Engagement –Self-Regulation ACT’s academic behavior assessments measure these domains

17
© 2012 by ACT, Inc. All rights reserved.17 Student Grade Levels 6789101112 ENGAGE Grades 6-9 ENGAGE Grades 10-12 ENGAGE College ENGAGE Teacher Ed. Grades 6-9 ENGAGE Teacher Ed. Grades 10-12 College Student reported (surveys) Teacher reported (teacher ratings)
 Teacher reported (teacher ratings).")
18
© 2012 by ACT, Inc. All rights reserved.18 Surveys (Student reported) –ENGAGE Grades 6-9 (typically in 6th & 9th grade) –ENGAGE Grades 10-12 (typically in 11th grade) –ENGAGE College (typically early in 1st semester) Behavioral Measures (Teacher reported) –ENGAGE Teacher Edition for Grades 6-9 and 10-12 (completed by teachers 2-3x per year for each student) COMING SOON!
 –ENGAGE Grades 6-9 (typically in 6th & 9th grade) –ENGAGE Grades (typically in 11th grade) –ENGAGE College (typically early in 1st semester) Behavioral Measures (Teacher reported) –ENGAGE Teacher Edition for Grades 6-9 and (completed by teachers 2-3x per year for each student) COMING SOON!.")
19
© 2012 by ACT, Inc. All rights reserved.19 DomainENGAGE Grades 6-9 ENGAGE Grades 10-12 & College Motivation (Getting work done) Academic Discipline Commitment to School Optimism Academic Discipline Commitment to College Goal Striving General Determination Study Skills Communication Skills Social Engagement (Getting along) Family Attitude toward Education Family Involvement Relationships w/ School Personnel School Safety Climate Social Activity Social Connection Self-Regulation (Keeping your cool) Managing Feelings Thinking Before Acting Orderly Conduct Academic Self-Confidence Steadiness
 Academic Discipline Commitment to School Optimism Academic Discipline Commitment to College Goal Striving General Determination Study Skills Communication Skills Social Engagement (Getting along) Family Attitude toward Education Family Involvement Relationships w/ School Personnel School Safety Climate Social Activity Social Connection Self-Regulation (Keeping your cool) Managing Feelings Thinking Before Acting Orderly Conduct Academic Self-Confidence Steadiness.")
22
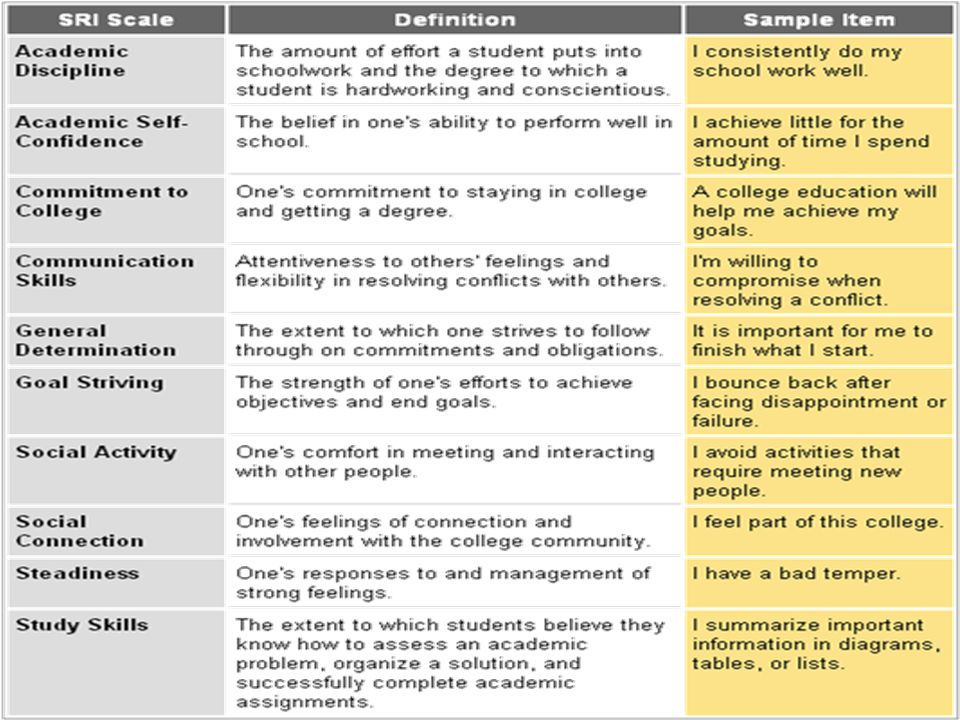
© 2012 by ACT, Inc. All rights reserved.22 Measures students’ perceptions of themselves, their families’ commitment to education, school- related factors, and important behavioral data Developed to predict academic success and high school graduation Low stakes, self-report instrument, 4 th -grade reading level 10 scales Online administration

23
© 2012 by ACT, Inc. All rights reserved.23 Measures students’ psychosocial attributes, determines level of risk, and helps identify interventions to promote successful transition to postsecondary studies Developed to predict academic success and retention in the first year of college Low stakes, self-report instrument, 6 th -grade reading level 10 scales Online administration

24
© 2012 by ACT, Inc. All rights reserved.24 Academic Success and Graduation/Retention Indices Student profiles can be used to: –Identify relative strengths and needs –Inform student advising –Match students’ needs to interventions Aggregate reports Roster reports All reports available online 24/7

25
© 2012 by ACT, Inc. All rights reserved.25 Profile of scores Success Indices (only on Advisor Report) Interpretive feedback, sorted from strengths to needs
 Interpretive feedback, sorted from strengths to needs.")
26
© 2012 by ACT, Inc. All rights reserved.26

27
© 2012 by ACT, Inc. All rights reserved.27 ENGAGE: Sample Intepretative Reports

28
© 2012 by ACT, Inc. All rights reserved.28

29
© 2012 by ACT, Inc. All rights reserved.29

30
© 2012 by ACT, Inc. All rights reserved.30 Grounded in research –Developed based on meta-analysis of predictors of academic performance and persistence (Robbins et al., 2004) –Validated across many studies (e.g., Allen et al., 2010; Casillas et al., in press; Robbins et al., 2006, 2008) Helps educators to consider the whole student –Provides profile of relative strengths and needs Practical and flexible –Administer online at any time –Reports available online 24/7 –Identify areas of challenge for students –Create a crosswalk of ENGAGE scales to existing services
 –Validated across many studies (e.g., Allen et al., 2010; Casillas et al., in press; Robbins et al., 2006, 2008) Helps educators to consider the whole student –Provides profile of relative strengths and needs Practical and flexible –Administer online at any time –Reports available online 24/7 –Identify areas of challenge for students –Create a crosswalk of ENGAGE scales to existing services.")
31
© 2012 by ACT, Inc. All rights reserved.31 Percentage of students accurately identified as having a 9th-grade GPA <2.0 Selection MethodHit Rate Random24% EXPLORE Composite only69% ENGAGE Grades 6-9 only80% EXPLORE & ENGAGE83%

32
© 2012 by ACT, Inc. All rights reserved.32 Average Early High School GPA, by EXPLORE and ENGAGE Grades 6-9 Scores

33
© 2012 by ACT, Inc. All rights reserved.33 Percentages of Students Accurately Identified as Being at High Risk for Dropping Out Selection MethodHit Rate Random17% EXPLORE Composite only37% ENGAGE Grades 6-9 Grad. Index only42% EXPLORE & ENGAGE Grad. Index52%

34
© 2012 by ACT, Inc. All rights reserved.34 Persistence Rates, by EXPLORE and ENGAGE Grades 6-9 Graduation Index Levels

35
© 2012 by ACT, Inc. All rights reserved.35 Use of ENGAGE College to Identify Students Academically at Risk Note. Students scoring in the bottom 5% of each of these populations were flagged. Accuracy of Identification Selection MethodDrop OutAcademic Difficulty Random10%20% ENGAGE Success Indices 24%46%

36
© 2012 by ACT, Inc. All rights reserved.36 Designed to assess and monitor students’ development Students are rated by teachers who know them well Requires each student to be rated by at least one teacher Used to 2-3 times per year Scales are “anchored” with behavioral statements to enhance accuracy and reliability Same dimensions for Grades 6-9 and 10-12, but rating scales are made up of different items.

37
© 2012 by ACT, Inc. All rights reserved.37 DomainScales Motivation (Getting work done) Initiative Planning & Organizing Sustained Effort Performance Social Engagement (Getting along) Communication Working with Others Self-Regulation (Keeping your cool) Managing Feelings Orderly Conduct
 Initiative Planning & Organizing Sustained Effort Performance Social Engagement (Getting along) Communication Working with Others Self-Regulation (Keeping your cool) Managing Feelings Orderly Conduct.")
38
© 2012 by ACT, Inc. All rights reserved.38 Combining Assessment and Interventions to Promote Student Success ENGAGE Teacher Edition Support Resources & Interventions Reduced Risk Continued Evaluation & Feedback

39
© 2012 by ACT, Inc. All rights reserved.39 Example Crosswalk between Interventions and Areas of Need Interventions Areas of Need Goal Setting & Time Management Mentoring Cross-Age Tutoring Community Service Group Work & Communication Skills Self- Confidence Workshop How to Follow Rules Motivation xxxx Social Engagement xxxx Self- Regulation x xx

40
© 2012 by ACT, Inc. All rights reserved.40 Behavioral Education Solutions Grade 6-12 curriculum –Units designed to help students build behavioral skills –Based on carefully developed Behavioral Learning Objectives –Fully developed and structured lesson plans and activities ENGAGE Tool Shop (Postsecondary) –Several tools available for each ENGAGE scales to address students’ needs –Can be completed by students on their own or as part of FYE courses or other group settings COMING SOON!
 –Several tools available for each ENGAGE scales to address students’ needs –Can be completed by students on their own or as part of FYE courses or other group settings COMING SOON!.")
41
© 2012 by ACT, Inc. All rights reserved.41 ENGAGE Tool Shop (College)
")
42
© 2012 by ACT, Inc. All rights reserved.42 Intervention Research University of North Texas –Large university (36,000 students) –Administers ENGAGE to all incoming 1 st -year students –Identify at-risk students and follow up with immediate individualized intervention Northern Arizona University –4-year public institution serving 13,000 students –Use ENGAGE to guide intrusive interventions with those students who need the most help
 –Administers ENGAGE to all incoming 1 st -year students –Identify at-risk students and follow up with immediate individualized intervention Northern Arizona University –4-year public institution serving 13,000 students –Use ENGAGE to guide intrusive interventions with those students who need the most help.")
43
© 2012 by ACT, Inc. All rights reserved.43 UNT Face-to-Face Meeting Advisor or student affairs staff meet with student during first 5-6 weeks of semester Present ENGAGE results by focusing first on strengths, then needs Focus resources to aid student in: –building on one strength and addressing one area for improvement –using crosswalk of ENGAGE to campus resources

44
© 2012 by ACT, Inc. All rights reserved.44 Sample Crosswalk of Resources SRI ScaleDefinitionResources Academic DisciplineEffort put into school work and the degree to which students see themselves as hardworking and conscientious. Learning Center Office of Exploring Majors UNT Math Tutor Lab UNT Student Writing Lab Social ConnectionFeelings of connection and involvement with school and community. Off-Campus Student Services Transfer Center Residence Life Recreation Center Academic Self- Confidence Belief in ability to perform well in school. Learning Center Counseling and Testing Office of Exploring Majors

45
© 2012 by ACT, Inc. All rights reserved.45 www.act.org/engage/index.html

46
© 2012 by ACT, Inc. All rights reserved.46 www.act.org/engage/index.html For each version of ENGAGE, website contains: –Features and Benefits –Testing Timeline –Program Materials –Research –Results and Reports

Similar presentations


 Tools for the Evaluation of Motivation-Related Outcomes of Math and Science Instruction Martin Maehr>")


