Download presentation
Presentation is loading. Please wait.

1
Data Management and Analysis Migration and Diversity in London BSPS Day Seminar City Hall 2 nd May 2006 Senior Research and Statistical Analyst Ethnic Demography DMAG Thanks to John Hollis for his help

2
Data Management and Analysis Outline London - yesterday, today and tomorrow Diversity in London Ethnic Segregation in London Ethnic Migration patterns, 2001 Census More Recent Change - Monitor

3
Data Management and Analysis Context: London How is London central to this debate: Historical Current Future

4
Data Management and Analysis

9
Expectation of Life at Birth - years Males Females Ken & Chelsea78.683.9 Harrow78.183.0 Richmond77.982.2 Barnet77.781.8 London75.980.8 Islington73.779.3 Newham73.578.9 Lambeth73.479.4 Tower Hamlets72.879.0

10
Data Management and Analysis

11
Boroughs: Total Fertility Newham2.30 children per woman (through her life) Hackney2.12 Tower Hamlets1.88 Barking & Dag1.88 Wandsworth1.35 Camden1.33 K&C1.28 Westminster1.27
 Hackney2.12 Tower Hamlets1.88 Barking & Dag1.88 Wandsworth1.35 Camden1.33 K&C1.28 Westminster1.27")
12
Data Management and Analysis Mortality (2001) Standardised Mortality Rates –Number of actual deaths in an area compared to number expected if national age/gender specific death rates applied –100 is ‘average’ London = 98 ie about 2% better ‘health’ than UK –Inner = 105 –Outer = 95 Lambeth & Wandsworth (110) Lewisham (114) Islington & Newham (115) Tower Hamlets (119) K&C (73) Harrow (79) Richmond (86) Barnet (89) Bromley (90)
 Standardised Mortality Rates –Number of actual deaths in an area compared to number expected if national age/gender specific death rates applied –100 is ‘average’ London = 98 ie about 2% better ‘health’ than UK –Inner = 105 –Outer = 95 Lambeth & Wandsworth (110) Lewisham (114) Islington & Newham (115) Tower Hamlets (119) K&C (73) Harrow (79) Richmond (86) Barnet (89) Bromley (90)")
13
Data Management and Analysis

19
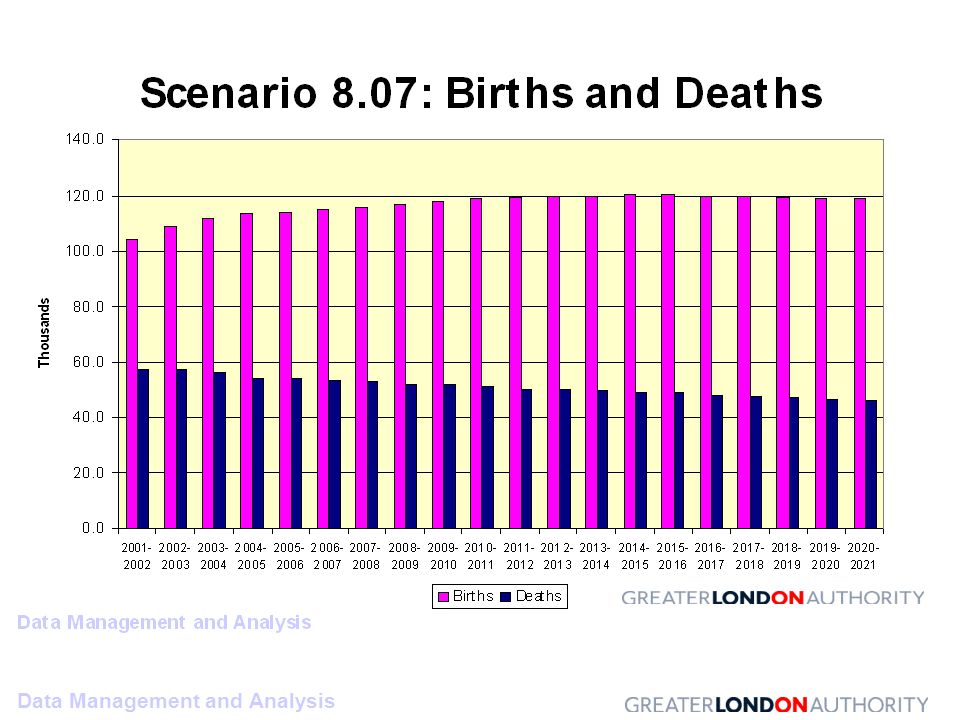
Scenario 8.07: Components of change

20
Data Management and Analysis

21
Diversity in London

22
Data Management and Analysis London in the national* context LONDON 32 Boroughs & the City 649 Wards 14% of total population 44% of total BME population 23% of Londoners aged <18 42% of total migrant population *England & Wales Source: 2001 Census

23
Data Management and Analysis BME* Population in London, 2001 * All ethnic groups other than White British

24
Data Management and Analysis Londoners born outside UK by region, 2001 Source: 2001 Census, ST102 27% of Londoners were born outside UK (~ 2 million)
")
25
Data Management and Analysis Londoners by Religion, 2001 Source: 2001 Census, KS07 %

26
Data Management and Analysis An example of change Source: 1991 Census, LBS06 and 2001 Census, KS06 ©Crown Copyright. All rights reserved Greater London Authority (LA100032379) 2005 1991 2001
")
27
Data Management and Analysis Diversity Indices Aim: To quantify and measure the ethnic diversity of London Allow for national comparisons At borough and ward levels More statistically sophisticated Simpson’s Diversity Index Richness & Equitability

28
Data Management and Analysis Diversity Index Formula 1 D = _____________ {( P i ) 2 } D = Simpson’s Diversity Index P = population in ethnic group i as a proportion of total population
 2 } D = Simpson’s Diversity Index P = population in ethnic group i as a proportion of total population")
29
Data Management and Analysis Worked example 1

30
Data Management and Analysis Worked example 2

31
Data Management and Analysis Methodology »Application to 3 aggregates of 2001 Census ethnic groups (16, 5 & 10) »All LADs in England & Wales »All wards in England & Wales »Rankings of Diversity Index
 »All LADs in England & Wales »All wards in England & Wales »Rankings of Diversity Index")
32
Data Management and Analysis Results 1

33
Data Management and Analysis

34
National Ethnic Diversity Rankings, Top 20 E&W = 1.303 London = 2.660

35
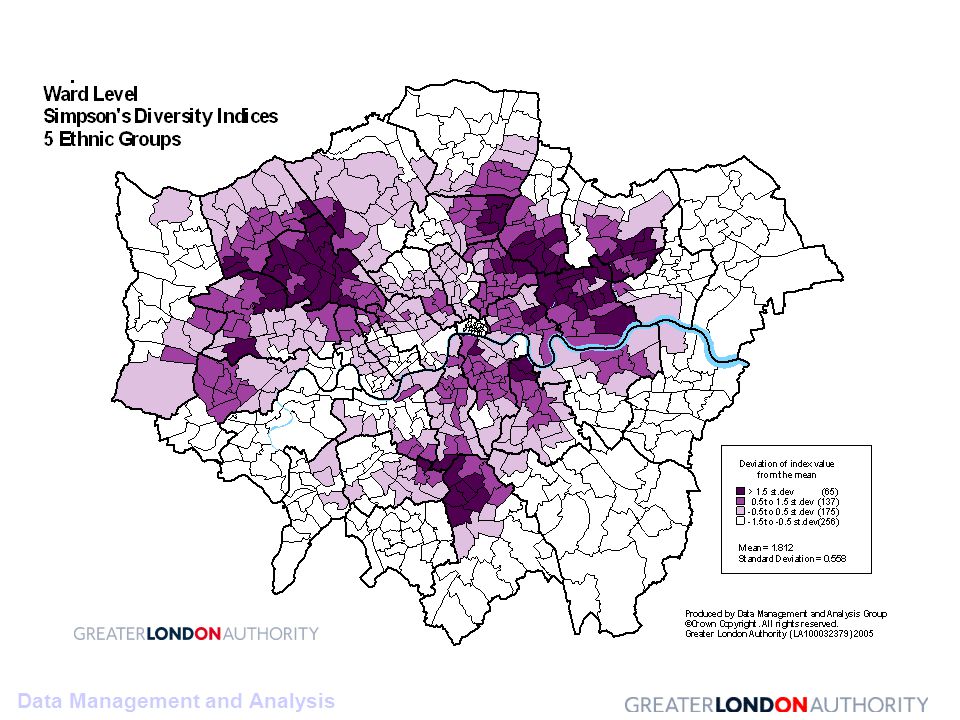
Data Management and Analysis Mapping London’s Diversity Indices Very high Index value is greater than the mean plus 1.5 standard deviations High Index value is between the mean plus half and 1.5 standard deviations Average Index value is the mean plus or minus half the standard deviation Low Index value is between the mean and minus half and minus 1.5 standard deviations Very Low Index value is less than the mean minus 1.5 standard deviations

36
Data Management and Analysis

42
Patterns of Ethnic Segregation in London

43
Data Management and Analysis Media Debate – ‘Ghetto’ The ‘new geography’ of ethnicity in Britain Dr Michael Poulsen “Sleepwalking our way to segregation” Trevor Phillips Post 7/7 Need for London specific analysis at a more appropriate geography.

44
Data Management and Analysis What we did Take Poulsen’s criteria and applied at the ward level nationally for 2001. Comparison between 1991 and 2001 for London Three criteria for segregation are: 1) Where the host population (White) forms less than a third of the total population of the ward this is referred to as a mixed enclave.
 Where the host population (White) forms less than a third of the total population of the ward this is referred to as a mixed enclave..")
45
Data Management and Analysis If this condition is satisfied then: 2) The population of the ward from an ethnic group other than White must have one dominant ethnic community that comprises more than two thirds of the population of that ward. This is known as a polarised enclave.

46
Data Management and Analysis If this condition is satisfied then: 3) The dominant ethnic community is present in that ward such that over 30 per cent of the community living in the local authority district are present in this ward. This is an extreme polarised enclave, more commonly referred to as a ‘ghetto’.

47
Data Management and Analysis Results 1 20 wards in London that fulfil the first criteria where over two-thirds of the population is from an ethnic group other than White. No wards go on to fulfil the second of the three criteria. Two wards outside London, in Latimer in Leicester and Whitefield in Pendle fulfil the first two of the three criteria as ‘polarised enclaves’.

48
Data Management and Analysis Results 2 No wards in England or Wales fulfil all three criteria therefore there are no ‘extreme polarised enclaves’, commonly referred to as ghettos. This is the case in both 1991 and 2001 in London

49
Data Management and Analysis Results 3 Since 1991 there has been an increase in the number of wards which have ethnic minority populations of over 66.6 per cent, from seven in 1991 to 20 in 2001. Segregation has declined over the decade since in 1991 there was one London ward that fulfilled the first two criteria of segregation, Southall Broadway. In 2001 there were no London wards that fulfilled both criteria.

50
Data Management and Analysis Results 4 Two wards, Southall Broadway and Spitalfields & Banglatown, with high proportions of ethnic minority communities in 1991 saw a decline in the proportions of these communities in 2001. Evidence of dispersal is present in these analyses, eg Little Ilford in Newham

51
Data Management and Analysis

55
Patterns of Ethnic Migration in London

56
Data Management and Analysis

62
Monitoring more recent changes

63
Data Management and Analysis PLASC 2003-2005

64
Data Management and Analysis 2001 Census v PLASC 2003

65
Data Management and Analysis Change in the percentage of primary pupils from BME ethnic groups, 2003-5

66
Data Management and Analysis Change in the percentage of secondary pupils from BME ethnic groups, 2003-5

67
Data Management and Analysis Any Questions? Contact Details: Baljit Bains Baljit.Bains@london.gov.uk Tel: 020 7986 4613

Similar presentations


 Local.>")
