Download presentation
Presentation is loading. Please wait.

1
James S. Henry Economic Transparency 2010 Annual Conference

2
Economic Transparency What Is It? Why Do We Care? What Do We Need?

3
Summary Metrics drive policy Go to the front (vs. “abstract empiricism”) Tax evasion/money laundering: a huge global polluter o Global “pirate banking” industry o Banks’ role in story is crucial: (debt-flight-debt-flight) o Vs. “havens,” “offshore industry,” endogenous “corruption” This is not 1986 o Huge offshore private untaxed wealth stock o Need to be creative about bringing the money back “ Offshore” moving “onshore” o “ First World” now the heavily-indebted source of capital flight o “Third World private banking”
 Tax evasion/money laundering: a huge global polluter o Global pirate banking industry o Banks’ role in story is crucial: (debt-flight-debt-flight) o Vs. havens, offshore industry, endogenous corruption This is not 1986 o Huge offshore private untaxed wealth stock o Need to be creative about bringing the money back Offshore moving onshore o First World now the heavily-indebted source of capital flight o Third World private banking .")
4
What’s “Economic Transparency?” … depends..”

8
Why do we care?

9
(C)JSH 2008 9 Numbers drive policy.…(+…disclo se new worlds..)
JSH Numbers drive policy.…(+…disclo se new worlds..)")
10
If you cannot express it in numbers, your knowledge is of a meager and unsatisfactory kind. -- Lord Kelvin, 1889 “Just use the inter-ocular significance test. Look at the fuckin’ data.” -- John Tukey, 1985

11
The Author 1890 – GGF leaves Norway-> clarinetist in Minneapolis 1966 - $1/hr making pizzas 1973 - Sachs and Pinera 1976 - “Calling in Big Bills” – demand for US currency 1979 - Fed Res data, Castle Bank, Income Tax Compliance 1986 - “Debt Hoax” - relation between debt and flight Sachs runs Bolivia; Pinera buys LAN Chile 1996 - “Banqueros y Lavadolares” – first book on int’l tax havens Sachs & Co. ruins Russia; Pinera is a billionaire 2003 - “Blood Bankers” - dirty debt book 2005 - “Private Banking for the Poor” 2006 – Film about Evo: “Cocalero” 2008 – Oxfam GB cap flight estimates for G20 2010 – Estimate of untaxed offshore wealth (Forbes, etc.) – “Pirate Bankers” in works – $1/ hr pizzas; return to Norway Pinera is President of Chile; Sachs is a Deity
 – Pirate Bankers in works – $1/ hr pizzas; return to Norway Pinera is President of Chile; Sachs is a Deity.")
12
(C)JSH 200912
JSH")
13
“Unusual” Demand for US Currency - Key Indicators, 1970-2007 Source: December data on currency outstanding from US Treasury Bulletin; $GNI estimates from World Bank-WDI(2008); JSH analysis © JS Henry, 2008 GNI Velocity US Currency Per Capita ($) Argentina’s banking crisis Early clues and leads….
; JSH analysis © JS Henry, 2008 GNI Velocity US Currency Per Capita ($) Argentina’s banking crisis Early clues and leads….")
14
Growing Haven Role -- US Foreign Bank Liabilities, 1978-2007 Total = $4.721 Trillion, December 2007 Source: US Treasury TIC data (2005), author’s analysis
, author’s analysis")
15
World Current Deficit Discrepancy - Key Components ($95 Billions) Source: IMF(2005) data, author’s analysis Early clues….
 Source: IMF(2005) data, author’s analysis Early clues….")
16
(C)JSH 2008 16 Where Did The Money Go? First clues – offshore currency demand, growth of “inbound” US bank deposits via havens “Dubious debt” *** –Lousy projects (artificial economics) –Roundtrips (Philippines, Nicaragua, etc.) –Privatization fiascos (Mexico, Arg., Indonesia,etc.) Financing initial capital flight Flight wealth: on-going tax evasion and money laundering Human capital flight *** For examples, see The Blood Bankers (NY:Basic Books, 2005)
 –Roundtrips (Philippines, Nicaragua, etc.) –Privatization fiascos (Mexico, Arg., Indonesia,etc.) Financing initial capital flight Flight wealth: on-going tax evasion and money laundering Human capital flight *** For examples, see The Blood Bankers (NY:Basic Books, 2005).")
17
(C)JSH 200917 More capital than ever before for developing countries…..(including poor ones, the subprime equivalent…)
JSH More capital than ever before for developing countries…..(including poor ones, the subprime equivalent…)")
18
(C)JSH 200918 Disappointing Real Growth (1980 - 2005) ChinaIndia Poorest (UN) All Other Developing Countries High Income World Countries (n) 114910554210 % of Pop --1980 -- 2005 22.1% 20.3% 14.4% 17.1% 8.1% 11.4% 33.0% 35.8% 22.5% 15.3% 100% % of Real Income ($95 PPP) 3.2% 13.6% 3.5% 6.3% 1.9% 29.3% 24.5% 62% 54% 100% Real Income Per Capita 2005 ($ 95 PPP) $4,972$2,752 $1,249 $5,123 $26,191$7,428 1980-2005 RAAGR (%) 8.1%3.8%.7%.8% 1.9%1.6% 2005 Population (B) 1.31.1.742.3.986.43 © JSH 2008Source: World Bank data (2008), JSH analysis
JSH Disappointing Real Growth ( ) ChinaIndia Poorest (UN) All Other Developing Countries High Income World Countries (n) % of Pop % 20.3% 14.4% 17.1% 8.1% 11.4% 33.0% 35.8% 22.5% 15.3% 100% % of Real Income ($95 PPP) 3.2% 13.6% 3.5% 6.3% 1.9% 29.3% 24.5% 62% 54% 100% Real Income Per Capita 2005 ($ 95 PPP) $4,972$2,752 $1,249 $5,123 $26,191$7, RAAGR (%) 8.1%3.8%.7%.8% 1.9%1.6% 2005 Population (B) © JSH 2008Source: World Bank data (2008), JSH analysis")
19
(c) JSH, 200819 The Philippines Long-Term Development - Real Per Capita Incomes, Five Asian Economies (1972 = 100) Source: WB (WDI Data), 2003, author’s analysis © JS Henry, 2003 Underground roots of the global development crisis
 JSH, The Philippines Long-Term Development - Real Per Capita Incomes, Five Asian Economies (1972 = 100) Source: WB (WDI Data), 2003, author’s analysis © JS Henry, 2003 Underground roots of the global development crisis")
20
Roberto Benedicto$747.6 million Marcos family members$726.5 Roberto Cuenca$676.9 Herminio Disini$258.4 Eduardo Cojuangco $201.2 Jobo Fernandez$180.0 “Kokoy” Romualdez $150.4 Manual Elizalde Jr.$104.1 Jose de Venecia$71.4 Lucio C. Tan$51.8 Placido Mapa Jr.$50.6 Ramon Cojuangco$30.9 Ricardo Silverio$30.6 Juan Ponce Enrile$28.6 Vicente Chiudian$15.6 Roberto Villafuerte$15.2 Bienvenido Tantoco $6.0 Salvador Laurel$5.8 Other Marcos allies: $134.4 TOTAL: $3.58 billion OTHER (not identifiable:) $3.4 billion Insider Recipients - Philippine Central Bank loans ($mm outstanding, 1986) Source: JS Henry, The Blood Bankers (2003)
 $3.4 billion Insider Recipients - Philippine Central Bank loans ($mm outstanding, 1986) Source: JS Henry, The Blood Bankers (2003).")
21
Other Cases Citibank (LA) UBS (world) JP Morgan (Brazil)…. Chase (Venezuela, Iran) Deutsche Bank (Iraq) Chile privatization fiasco (BT) Sandinista debt deal… Haiti and West Africa (BNP) Chief Justice Brazil’s S Ct. Drinking with Lula Goni’s gas tale Carlos Andres’ offshore fund… Noriega’s phone calls… Stroessner’s phone calls Nixon’s offshore accounts
 Deutsche Bank (Iraq) Chile privatization fiasco (BT) Sandinista debt deal… Haiti and West Africa (BNP) Chief Justice Brazil’s S Ct. Drinking with Lula Goni’s gas tale Carlos Andres’ offshore fund… Noriega’s phone calls… Stroessner’s phone calls Nixon’s offshore accounts.")
22
Flight Capital Estimation Process - Russia Example Debt Flows ($B) Net Foreign Investment ($B) Total Sources ($B) Reported CA Deficit Ch in Reserves Total Observed Uses ($B) Annual CF Estimate ($B current) Annual CF Estimate ($B US 95) 1994 -5.80.4-5.47.83.411.35.96.0 1995 2.11.53.57.0-4.92.15.6 1996 7.13.710.8 6.116.927.727.2 1997 5.43.08.4-0.1-0.4-0.57.97.6 1998 46.32.248.50.210.510.759.256.3 1999 0.70.81.524.6-5.419.220.719.4 2000 -12.6-0.4-13.046.8-18.927.914.913.7 2001 -3.30.7-2.633.8-12.021.819.117.1 2002 -5.62.6-2.929.1-12.816.313.411.9 2003 28.6-1.427.335.8-27.28.635.931.2 Total $62.8$13.2$76.0$196.0$-61.6$134.4$210.4$195.9 Source: data from IMF/World Bank (2008), JSH analysis
 Net Foreign Investment ($B) Total Sources ($B) Reported CA Deficit Ch in Reserves Total Observed Uses ($B) Annual CF Estimate ($B current) Annual CF Estimate ($B US 95) Total $62.8$13.2$76.0$196.0$-61.6$134.4$210.4$195.9 Source: data from IMF/World Bank (2008), JSH analysis")
23
(C)JSH 2010 Year$ ShiftTax Loss 2000 * $131 BN$44.5 BN 2001 * $156 BN$53.1 BN 2002 $251 BN$85.2 BN 2003 $143 BN$48.7 BN 2004 $267 BN$90.9 BN 2005 $252 BN$85.6 BN Pak and Zdanowicz (2006): estimates based on authors’ special Access to US Customs data on product values reported for imports and exports. Year$ ShiftTax Loss 2000 * $131 BN$44.5 BN 2001 * $156 BN$53.1 BN 2002 $251 BN$85.2 BN 2003 $143 BN$48.7 BN 2004 $267 BN$90.9 BN 2005 $252 BN$85.6 BN Pak and Zdanowicz (2006): estimates based on authors’ special Access to US Customs data on product values reported for imports and exports. Estimated US Corporate Tax Losses Due to Trade Misinvoicing
: estimates based on authors’ special Access to US Customs data on product values reported for imports and exports. Estimated US Corporate Tax Losses Due to Trade Misinvoicing.")
24
Capital Flight Outflows From Key East Asian Countries, 1970-2007 (Real $2000 Billions) Source: data from IMF/World Bank (2008): JSH analysis ** Insufficient data for Cambodia, Fiji, French Polynesia, Guam, Kiribati, DRK, Laos, Myanmar, PNG, Samoa, Solomon Islands, Tonga, Vanuatu, and Vietnam $764.7, EAST ASIA MAJORS 1970-2007 (c) JSH 2008 Revised 10-08 $218.2 $ 139.4 $106.2 $51.6 $ 62.0 $ 187.2 *1976-2007
 Source: data from IMF/World Bank (2008): JSH analysis ** Insufficient data for Cambodia, Fiji, French Polynesia, Guam, Kiribati, DRK, Laos, Myanmar, PNG, Samoa, Solomon Islands, Tonga, Vanuatu, and Vietnam $764.7, EAST ASIA MAJORS (c) JSH 2008 Revised $218.2 $ $106.2 $51.6 $ 62.0 $ *")
25
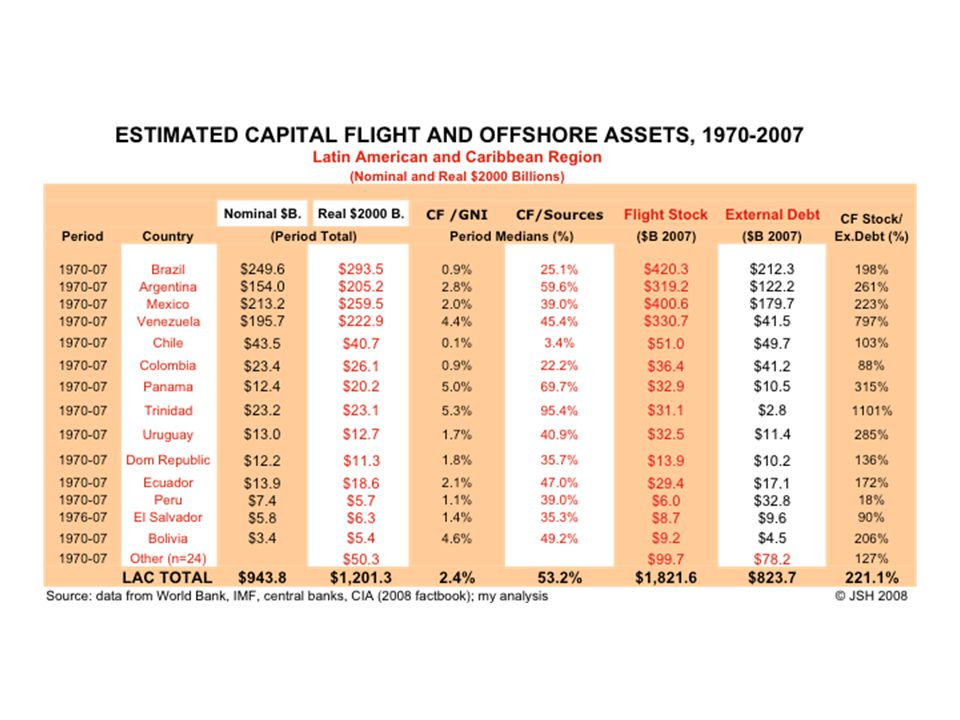
Capital Flight Outflows from Latin America, 1970-2007 (Real Value of Cumulative Net Outflows by Period, $2000 Billions) Source: data from World Bank/ IMF (1979-2008); JSH analysis $298.4 $268.3 $226.5 $208.9 $ 40.4 $ 25.4 $ 21.5 $19.6 = $ 26.9 **19 other Latin American and Caribbean countries $1231.1, LAC REGION, 1970-2007 (c) JSH 2008 Revised 10-08 Huge debt- and oil-financed real flight flows by region…
 Source: data from World Bank/ IMF ( ); JSH analysis $298.4 $268.3 $226.5 $208.9 $ 40.4 $ 25.4 $ 21.5 $19.6 = $ 26.9 **19 other Latin American and Caribbean countries $1231.1, LAC REGION, (c) JSH 2008 Revised Huge debt- and oil-financed real flight flows by region…")
26
Capital Flight Outflows From FSU, 1976-2007 ($2000 Billions) Source: data from IMF (2005), World Bank (2005); JSH analysis Revised 10-08 © JSH 2008 $911.6, FSU COUNTRIES 1976-2007
 Source: data from IMF (2005), World Bank (2005); JSH analysis Revised © JSH 2008 $911.6, FSU COUNTRIES")
27
Source: World Bank/ IMF data (2008); JSH analysis Annual Flight Flows** – All China (1982-2007, $2000 Billions) ** ”Sources and uses residual” CF measure for China Mainland, HK SAR, and Macao SAR. Includes “roundtripping” through offshore havens. (c) JSH 2008 Revised 10-08
 JSH 2008 Revised")
28
(C)JSH 2008 28
JSH")
30
Flight Capital Outflow as a % of National Income, by Source Country, 1970-2007 Source: IMF/ World Bank data (2008); JSH analysis (c) JSH 2008 Revised 10-08 Significant yearly “tax” on domestic savings…
; JSH analysis (c) JSH 2008 Revised Significant yearly tax on domestic savings…")
31
External Debt Vs. Estimated Flight Wealth, By Key Country - ( 2007 $Billions) Source: data from IMF/World Bank (2008); JSH analysis © JSH 2008
 Source: data from IMF/World Bank (2008); JSH analysis © JSH")
32
(C)JSH 2008 32 Compare current $700 billion+ US bank bailout, 500 billion UK bailout, $135 billion (so far) AIG bailout, $200 billion Fannie/Freddie bailout, etc..
JSH Compare current $700 billion+ US bank bailout, 500 billion UK bailout, $135 billion (so far) AIG bailout, $200 billion Fannie/Freddie bailout, etc..")
33
(C)JSH 2008 33 Source: World Bank (’05), IMF (’09), WDI (’06), OECD (’06); author’s analysis * In addition to US participation in Paris Club debt relief ©JSH, 2008 ** Excluding Russia = $161 Billion = $149 Billion = $310 Billion, 2005 NPV*** ***Most likely expected value as of mid-2006
JSH Source: World Bank (’05), IMF (’09), WDI (’06), OECD (’06); author’s analysis * In addition to US participation in Paris Club debt relief ©JSH, 2008 ** Excluding Russia = $161 Billion = $149 Billion = $310 Billion, 2005 NPV*** ***Most likely expected value as of mid-2006")
34
Highly-Skilled Labor Emigration Rates, Sub-Saharan Countries (2000) Source: OECD(2005); Barro and Lee (2000); Cohen and Soto (2001), my analysis **”Higher-skilled” includes post-secondary college and vocational training
 Source: OECD(2005); Barro and Lee (2000); Cohen and Soto (2001), my analysis ** Higher-skilled includes post-secondary college and vocational training")
35
(C)JSH 2008 35
JSH")
36
(C)JSH 2008 36
JSH")
37
(C)JSH 2008 37
JSH")
38
(C)JSH 2008 38
JSH")
39
(C)JSH 2008 39
JSH")
40
(C)JSH 2008 40
JSH")
41
(C)JSH 2008 41
JSH")
42
Foreign Ownership of US Long-Term Securities, 2007 Source: US Federal Reserve Bank of NY, my analysis (100% = $9.136 trillion, June 2007)
")
43
(C)JSH 2008 43 “What Goes Around…..” –1960s/70s Rise of International banking, fueled by oil price spike, CA deficits, FW slow-down 3W Debt Surge - unregulated, highly profitable, unproductive, and “insured” by FW taxpayers 3W Debt-Flight cycle -- private wealt accumulated offshor,public debts at home Rise of international private banking, global haven network –1980s Third World Debt Crisis/ Stagnation IMF/ World Bank “Structural Adjustment” failed to work quickly, sustain growth Banks get Bailouts, Brady Plans; countries continue paying –1990s-2008 Limited 3W Debt Relief, Continued Stagnation Outside BRIC FSU provides more debt/flight fuel More IMF/ World Bank “Structural Adjustment” failures Banks Turn Attention Back to First World Rubin Treasury institutions QI, check the box regs Takeoff of domestic LLCs, asset protection trusts BRIC Opts for Reserve Accumulation (vs. risk of more IMF fiasco) Increased Deregulation, Globalization, Haven-eering Ultra-deregulation: banks, securitization, hedge funds, insurance Loose Fed, fiscal policy: balooning FW CA deficits Huge reverse flows from BRIC to FW Countries Accumulated Offshore Flight Capital also Fuels Rise of FW IMF, World Bank are marginalized Unregulated mortage lending boom -- unregulated, highly profitable, unproductive –2008-2010+: FW mortgage/ housing market craters FW Banking, Insurance, Hedge Funds, Pension Funds: massive exposure BRIC exposure by way of MSBs, FW bonds Huge Bailouts for Financial Institutions; limited ones for borrowers so far IMF gets back in the game Crisis spreads to weaker 3W, heavily indebted EU countries
 Increased Deregulation, Globalization, Haven-eering Ultra-deregulation: banks, securitization, hedge funds, insurance Loose Fed, fiscal policy: balooning FW CA deficits Huge reverse flows from BRIC to FW Countries Accumulated Offshore Flight Capital also Fuels Rise of FW IMF, World Bank are marginalized Unregulated mortage lending boom -- unregulated, highly profitable, unproductive – : FW mortgage/ housing market craters FW Banking, Insurance, Hedge Funds, Pension Funds: massive exposure BRIC exposure by way of MSBs, FW bonds Huge Bailouts for Financial Institutions; limited ones for borrowers so far IMF gets back in the game Crisis spreads to weaker 3W, heavily indebted EU countries.")
44
Summary Metrics drive policy Go to the front (vs. “abstract empiricism”) Tax evasion/money laundering: a huge global polluter –Global “pirate banking” industry –Banks’ role in story is crucial: (debt-flight-debt-flight) –Vs. “havens,” “offshore industry,” endogenous “corruption” This is not 1986 –Huge offshore private untaxed wealth stock –Need to be creative about bringing the money back “ Offshore” moving “onshore” –“ First World” now the heavily-indebted source of capital flight –“Third World private banking”
 Tax evasion/money laundering: a huge global polluter –Global pirate banking industry –Banks’ role in story is crucial: (debt-flight-debt-flight) –Vs. havens, offshore industry, endogenous corruption This is not 1986 –Huge offshore private untaxed wealth stock –Need to be creative about bringing the money back Offshore moving onshore – First World now the heavily-indebted source of capital flight – Third World private banking .")
46
(C)JSH 200946
JSH")
47
(C)JSH 2008 47
JSH")
48
(c) JSH 2008 Latin American majors’ flight consumed most of their trade/aid revenues
 JSH 2008 Latin American majors’ flight consumed most of their trade/aid revenues")
51
CONVENTIONAL ECONOMIC ASSUMPTION - “POOR COUNTRIES NEED FOREIGN CAPITAL (INCLUDING BANK LOANS)” Low-income countries: lower net savings rates (after accounting for other social expenditures)
 Low-income countries: lower net savings rates (after accounting for other social expenditures)")
52
Capital Flight Outflows From Sub-Saharan Africa, 1970-2007 (Real $2000 Billions) Source: data from World Bank/ IMF (2008); JSH analysis $ 104.3 $ 45.6 $22.6 $16.8 $ 21.6 $ 2.1 $222.1, SUB-SAHARAN AFRICA 1970-2007 (c) JSH 2008 Revised 10-08
 Source: data from World Bank/ IMF (2008); JSH analysis $ $ 45.6 $22.6 $16.8 $ 21.6 $ 2.1 $222.1, SUB-SAHARAN AFRICA (c) JSH 2008 Revised 10-08")
53
“Apparent” Capital Flight From China, Hong Kong SAR and Macao SAR, 1982-2007 (Real $2000 Billions) Source: World Bank/IMF data (2008); JSH analysis $663.9 $196.2 $8.6 *HK data: 1998-2007; **Macao data, 2002-2006 (c) JSH 2008 $860.3, CHINA 1982-2007 Revised 10-08 China’s apparent flight is exaggerated, due to round tripping…
 Source: World Bank/IMF data (2008); JSH analysis $663.9 $196.2 $8.6 *HK data: ; **Macao data, (c) JSH 2008 $860.3, CHINA Revised China’s apparent flight is exaggerated, due to round tripping…")
54
1970s Rise of International banking, fueled by oil price spike, CA deficits, First World slow 3W Debt surge - unregulated, highly profitable, unproductive, and “insured” by FW taxpayers 3W Debt-Flight cycle -- private wealth accumulated public debts at home Drug money boom 1970: CTRs Rise of international private banking, global haven network 1976 – “Calling in Big Bills” 1978 – FR data: Miami/Texas surpluses 1979 – Senate testimony re role of offshore cash demand, weird ME flows (C)JSH 2008 54
JSH")
56
Middle East Capital Flight, 1976-2007 ($2000 Billions) Source: data from IMF (2005), World Bank (2005); JSH analysis $ 223.9 $ 135.0 $ 93.1 $73.9 $62.2 $ 52.0 © JSH 2008
 Source: data from IMF (2005), World Bank (2005); JSH analysis $ $ $ 93.1 $73.9 $62.2 $ 52.0 © JSH 2008")
57
Cumulative Flight by Region (1977-2003, $95 Billions) Source: data from IMF (2005), World Bank (2005); JSH analysis**Excluding Kuwait and Saudi Arabia © JSH 2008
 Source: data from IMF (2005), World Bank (2005); JSH analysis**Excluding Kuwait and Saudi Arabia © JSH 2008")
58
Global Flight Wealth - Key Countries, Including China ($2007 Billions) Source: data from IMF/ World Bank (2008); JSH analysis = $ 6.209 Trillion © JSH 2008
 Source: data from IMF/ World Bank (2008); JSH analysis = $ Trillion © JSH 2008")
59
Global Flight Wealth, Vs. All Developing Country Debt** (1975-2003) (Billions US $Current) Source: data from IMF (2005), World Bank (2005); JSH analysis First crossover: 1989-90 Including China Flight Wealth “Surplus” © JSH 2008
 (Billions US $Current) Source: data from IMF (2005), World Bank (2005); JSH analysis First crossover: Including China Flight Wealth Surplus © JSH")
Similar presentations


 The value of all final goods and services.>")


