Download presentation
Presentation is loading. Please wait.

1
AI – CS289 Fuzzy Logic - Labs Fuzzy Logic – Lab 2 12 th October 2006 Dr Bogdan L. Vrusias b.vrusias@surrey.ac.uk

2
AI – CS289 Fuzzy Logic - Labs 12 th October 2006Bogdan L. Vrusias © 20062 Exercise 1 Tipping example You will be building the system using the graphical user interface (GUI) tools provided by Matlab’s Fuzzy Logic Toolbox. Start Matlab and the Fuzzy Inference System (FIS) editor (see previous Lab how to launch Matlab). NOTE: It is possible to use the Fuzzy Logic Toolbox by working strictly from the command line, but in general it is easier to build a system graphically. Example taken from: www.mathworks.com/access/helpdesk/help/toolbox/fuzzy/index.html?/access/helpdesk/help/toolbox/fuzzy/fp754.html
 tools provided by Matlab’s Fuzzy Logic Toolbox. Start Matlab and the Fuzzy Inference System (FIS) editor (see previous Lab how to launch Matlab). NOTE: It is possible to use the Fuzzy Logic Toolbox by working strictly from the command line, but in general it is easier to build a system graphically. Example taken from: /access/helpdesk/help/toolbox/fuzzy/fp754.html.")
3
AI – CS289 Fuzzy Logic - Labs 12 th October 2006Bogdan L. Vrusias © 20063 Exercise 1 – GUI tools The FIS Editor handles the high-level issues for the system: –How many input and output variables? –What are their names? The Membership Function Editor is used to define the shapes of all the membership functions associated with each variable. The Rule Editor is for editing the list of rules that defines the behaviour of the system. The Rule Viewer and the Surface Viewer are used for looking at, as opposed to editing, the FIS. They are strictly read-only tools. –The Rule Viewer is a MATLAB based display of the fuzzy inference diagram shown at the end of the last section. Used as a diagnostic, it can show (for example) which rules are active, or how individual membership function shapes are influencing the results. –The Surface Viewer is used to display the dependency of one of the outputs on any one or two of the inputs.
 which rules are active, or how individual membership function shapes are influencing the results. –The Surface Viewer is used to display the dependency of one of the outputs on any one or two of the inputs..")
4
AI – CS289 Fuzzy Logic - Labs 12 th October 2006Bogdan L. Vrusias © 20064 Example – Getting Started The Basic Tipping Problem Given a number between 0 and 10 that represents the quality of service at a restaurant (where 10 is excellent), and another number between 0 and 10 that represents the quality of the food at that restaurant (again, 10 is excellent), what should the tip be? The starting point is to write down the three golden rules of tipping, based on years of personal experience in restaurants: 1.If the service is poor or the food is rancid, then tip is cheap. 2.If the service is good, then tip is average. 3.If the service is excellent or the food is delicious, then tip is generous. We'll assume that an average tip is 15%, a generous tip is 25%, and a cheap tip is 5%.
, and another number between 0 and 10 that represents the quality of the food at that restaurant (again, 10 is excellent), what should the tip be. The starting point is to write down the three golden rules of tipping, based on years of personal experience in restaurants: 1.If the service is poor or the food is rancid, then tip is cheap. 2.If the service is good, then tip is average. 3.If the service is excellent or the food is delicious, then tip is generous. We ll assume that an average tip is 15%, a generous tip is 25%, and a cheap tip is 5%..")
5
AI – CS289 Fuzzy Logic - Labs 12 th October 2006Bogdan L. Vrusias © 20065 Example – Getting Started It is also useful to have a vague idea of what the tipping function should look like: Obviously the numbers and the shape of the curve are subject to local traditions, cultural bias, and so on, but the three rules are pretty universal.

6
AI – CS289 Fuzzy Logic - Labs 12 th October 2006Bogdan L. Vrusias © 20066 Example – The FIS Editor The FIS Editor displays general information about a fuzzy inference system. There is a simple diagram at the top that shows the names of each input variable on the left, and those of each output variable on the right. Below the diagram is the name of the system and the type of inference used. The default, Mamdani-type inference, is what we'll continue to use for this example. Below the name of the fuzzy inference system, on the left side of the figure, are the pop-up menus that allow you to modify the various pieces of the inference process. On the right side at the bottom of the figure is the area that displays the name of either an input or output variable, its associated membership function type, and its range.

8
AI – CS289 Fuzzy Logic - Labs 12 th October 2006Bogdan L. Vrusias © 20068 Example – The FIS Editor The generic untitled FIS Editor opens, with one input, labelled input1, and one output, labelled output1. For this example, we will construct a two-input, one output system, so go to the Edit menu and select Add variable. A second yellow box labelled input2 will appear. The two inputs we will have in our example are service and food. Our one output is tip. We'd like to change the variable names to reflect that: 1.Click once on the box (yellow) on the left marked input1 (the box will be highlighted in red). 2.In the white edit field on the right, change input1 to service and press Return. 3.Click once on the box (yellow) marked input2 (the box will be highlighted in red). 4.In the white edit field on the right, change input2 to food and press Return. 5.Click once on the box (blue) on the right marked output1. 6.In the white edit field on the right, change output1 to tip. 7.From the File menu, select Export and then To Workspace... 8.Enter the variable name tipper and click OK.
 on the left marked input1 (the box will be highlighted in red). 2.In the white edit field on the right, change input1 to service and press Return. 3.Click once on the box (yellow) marked input2 (the box will be highlighted in red). 4.In the white edit field on the right, change input2 to food and press Return. 5.Click once on the box (blue) on the right marked output1. 6.In the white edit field on the right, change output1 to tip. 7.From the File menu, select Export and then To Workspace... 8.Enter the variable name tipper and click OK..")
9
AI – CS289 Fuzzy Logic - Labs 12 th October 2006Bogdan L. Vrusias © 20069 Example – Membership Function Next define the membership functions associated with each of the variables. To do this, open the Membership Function Editor: –Within the FIS Editor window, select Edit > Membership Functions.... (or double- click the icon for the output variable, tip) On the upper left side of the graph area in the Membership Function Editor is a "Variable Palette" that lets you set the membership functions for a given variable. To set up your membership functions associated with an input or an output variable for the FIS, select an FIS variable in this region by clicking on it. Next select the Edit pull-down menu, and choose Add MFs.... A new window will appear, which allows you to select both the membership function type and the number of membership functions associated with the selected variable. In the lower right corner of the window are the controls that let you change the name, type, and parameters (shape), of the membership function, once it has been selected.
 On the upper left side of the graph area in the Membership Function Editor is a Variable Palette that lets you set the membership functions for a given variable. To set up your membership functions associated with an input or an output variable for the FIS, select an FIS variable in this region by clicking on it. Next select the Edit pull-down menu, and choose Add MFs.... A new window will appear, which allows you to select both the membership function type and the number of membership functions associated with the selected variable. In the lower right corner of the window are the controls that let you change the name, type, and parameters (shape), of the membership function, once it has been selected..")
11
AI – CS289 Fuzzy Logic - Labs 12 th October 2006Bogdan L. Vrusias © 200611 Example – Membership Function The process of specifying the input membership functions for this two input tipper problem is as follows: 1.Select the input variable, service, by double-clicking on it. Set both the Range and the Display Range to the vector [0 10]. 2.Select Add MFs... from the Edit menu. Use the tab to choose gaussmf for MF Type and 3 for Number of MFs. This adds three Gaussian curves to the input variable service. 3.Click once on the curve with the leftmost hump. Change the name of the curve to poor. To adjust the shape of the membership function, either use the mouse, as described above, or type in a desired parameter change, and then click on the membership function. The default parameter listing for this curve is [1.5 0]. 4.Name the curve with the middle hump, good, and the curve with the rightmost hump, excellent. Reset the associated parameters if desired. 5.Select the input variable, food, by clicking on it. Set both the Range and the Display Range to the vector [0 10]. 6.Select Add MFs... from the Edit menu and add two trapmf curves to the input variable food. 7.Click once directly on the curve with the leftmost trapezoid. Change the name of the curve to rancid. To adjust the shape of the membership function, either use the mouse, as described above, or type in a desired parameter change, and then click on the membership function. The default parameter listing for this curve is [0 0 1 3]. 8.Name the curve with the rightmost trapezoid, delicious, and reset the associated parameters if desired

12
AI – CS289 Fuzzy Logic - Labs 12 th October 2006Bogdan L. Vrusias © 200612 Example – Membership Function Next you need to create the membership functions for the output variable, tip. To create the output variable membership functions, use the Variable Palette on the left, selecting the output variable, tip. The inputs ranged from 0 to 10, but the output scale is going to be a tip between 5 and 25 percent. Use triangular membership function types for the output. First, set the Range (and the Display Range) to [0 30], to cover the output range. Initially, the cheap membership function will have the parameters [0 5 10], the average membership function will be [10 15 20], and the generous membership function will be [20 25 30]. Your system should look something like this:
 to [0 30], to cover the output range. Initially, the cheap membership function will have the parameters [0 5 10], the average membership function will be [ ], and the generous membership function will be [ ]. Your system should look something like this:.")
13
AI – CS289 Fuzzy Logic - Labs 12 th October 2006Bogdan L. Vrusias © 200613 Example – Rule Editor Now that the variables have been named, and the membership functions have appropriate shapes and names, you're ready to write down the rules. To call up the Rule Editor, go to the View menu and select Rules. The Rule Editor allows you to construct the rule statements automatically, by clicking on and selecting one item in each input variable box, one item in each output box, and one connection item. Choosing none as one of the variable qualities will exclude that variable from a given rule. Choosing not under any variable name will negate the associated quality. To insert the first rule in the Rule Editor, select the following: 1.poor under the variable service 2.rancid under the variable food 3.The or radio button, in the Connection block 4.cheap, under the output variable, tip. The resulting rule is: 1.If (service is poor) or (food is rancid) then (tip is cheap)
 or (food is rancid) then (tip is cheap).")
15
AI – CS289 Fuzzy Logic - Labs 12 th October 2006Bogdan L. Vrusias © 200615 Example – Rule Editor Follow a similar procedure to insert the second and third rules in the Rule Editor to get: 1.If (service is poor) or (food is rancid) then (tip is cheap) 2.If (service is good) then (tip is average) 3.If (service is excellent) or (food is delicious) then (tip is generous) At this point, the fuzzy inference system has been completely defined, in that the variables, membership functions, and the rules necessary to calculate tips are in place. Now look at the fuzzy inference diagram presented at the end of the previous section and verify that everything is behaving the way you think it should. This is exactly the purpose of the Rule Viewer.
 or (food is rancid) then (tip is cheap) 2.If (service is good) then (tip is average) 3.If (service is excellent) or (food is delicious) then (tip is generous) At this point, the fuzzy inference system has been completely defined, in that the variables, membership functions, and the rules necessary to calculate tips are in place. Now look at the fuzzy inference diagram presented at the end of the previous section and verify that everything is behaving the way you think it should. This is exactly the purpose of the Rule Viewer..")
16
AI – CS289 Fuzzy Logic - Labs 12 th October 2006Bogdan L. Vrusias © 200616 Example – Rule Viewer From the View menu, select Rules. The Rule Viewer displays a roadmap of the whole fuzzy inference process. it is based on the fuzzy inference diagram described in the previous section. –You see a single figure window with 10 small plots nested in it. The three small plots across the top of the figure represent the antecedent and consequent of the first rule. Each rule is a row of plots, and each column is a variable. –The first two columns of plots (the six yellow plots) show the membership functions referenced by the antecedent, or the if-part of each rule. –The third column of plots (the three blue plots) shows the membership functions referenced by the consequent, or the then-part of each rule. –If you click once on a rule number, the corresponding rule will be displayed at the bottom of the figure. Notice that under food, there is a plot which is blank. This corresponds to the characterization of none for the variable food in the second rule. –The fourth plot in the third column of plots represents the aggregate weighted decision for the given inference system. This decision will depend on the input values for the system. –The Rule Viewer allows you to interpret the entire fuzzy inference process at once, and also shows how the shape of certain membership functions influences the overall result
 show the membership functions referenced by the antecedent, or the if-part of each rule. –The third column of plots (the three blue plots) shows the membership functions referenced by the consequent, or the then-part of each rule. –If you click once on a rule number, the corresponding rule will be displayed at the bottom of the figure. Notice that under food, there is a plot which is blank. This corresponds to the characterization of none for the variable food in the second rule. –The fourth plot in the third column of plots represents the aggregate weighted decision for the given inference system. This decision will depend on the input values for the system. –The Rule Viewer allows you to interpret the entire fuzzy inference process at once, and also shows how the shape of certain membership functions influences the overall result.")
18
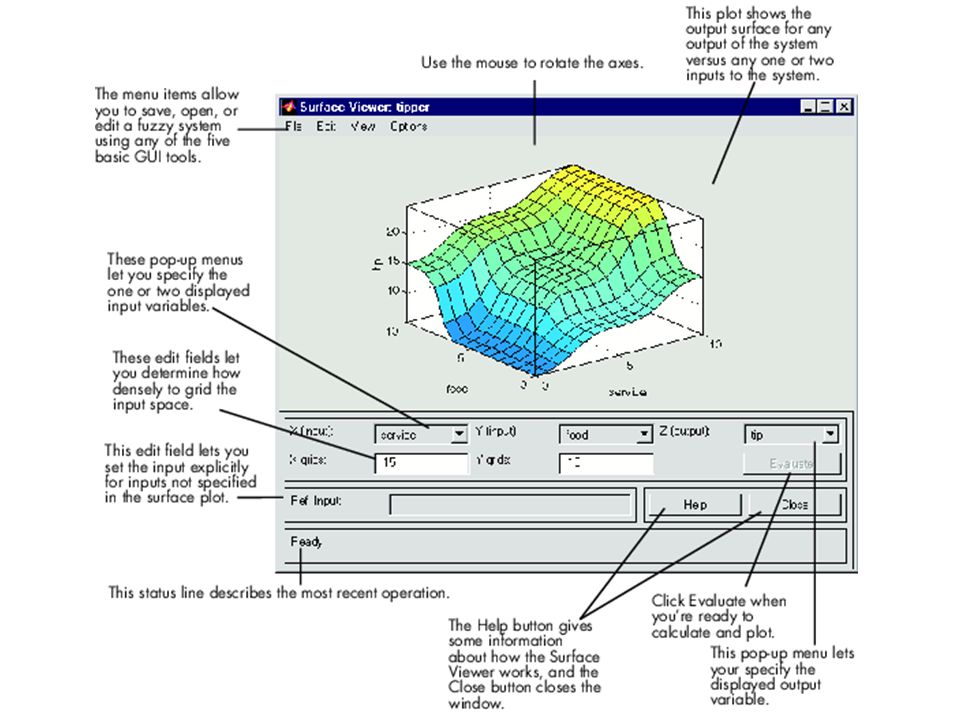
AI – CS289 Fuzzy Logic - Labs 12 th October 2006Bogdan L. Vrusias © 200618 Exercise – Surface Viewer If you want to see the entire output surface of your system, that is, the entire span of the output set based on the entire span of the input set, you need to open up the Surface Viewer. Open it by selecting Surface from the View menu. Upon opening the Surface Viewer, we are presented with a three- dimensional curve that represents the mapping from food and service quality to tip amount. Since this is a two-input one-output case, we can see the entire mapping in one plot. When we move beyond three dimensions overall, we start to encounter trouble displaying the results. Accordingly, the Surface Viewer is equipped with pop-up menus that let you select any two inputs and any one output for plotting.

20
AI – CS289 Fuzzy Logic - Labs 12 th October 2006Bogdan L. Vrusias © 200620 Exercise - Conclusions Your system is now “complete” and ready to be tested. 1.Try to save the system to your home directory. When you save a fuzzy system to disk, you're saving an ASCII text FIS file representation of that system with the file suffix.fis. If you do not save your FIS to your disk, but only save it to the MATLAB workspace, you will not be able to recover it for use in a new MATLAB session. 2.Use the Rule Viewer to test your system with different inputs. 3.Think again about the input and output fuzzy sets. Try to change the shapes and ranges of each (or some) of the sets to see how this will affect the output. 4.Try to add a new input financial status to the system, which describes the financial status of the customer: ranging from 0 for poor, to 10 for rich. 5.Think about the new rules you need to construct and add the new rules to the system (e.g. poor financial status cheap tip, rich financial status generous tip). 6.See how the output is now affected by the new input.
 of the sets to see how this will affect the output. 4.Try to add a new input financial status to the system, which describes the financial status of the customer: ranging from 0 for poor, to 10 for rich. 5.Think about the new rules you need to construct and add the new rules to the system (e.g. poor financial status cheap tip, rich financial status generous tip). 6.See how the output is now affected by the new input..")
Similar presentations


: 0logic%20toolbox.pdf>")


>")
