Download presentation
Presentation is loading. Please wait.

1
Dr Julian Johny Thottian

2
Introduction Optical coherence tomography (OCT) uses near-infrared light (NIR) – cross sectional images of coronaries. 10-fold higher resolution than IVUS images but lesser penetration. Started in cardiology as a research tool and in time progressing to the potential of diagnostic application and guidance of therapeutic interventions

3
Comparing the three modalities

4
NORMAL ARTERY WALL

5
Principle of OCT Light based imaging modality Uses near infrared rays- 1.3 microns OCT measures the time delay of the light that is reflected or backscattered from tissue, and that is collected by the catheter, by using a technique known as interferometry.

6
HARDWARE & MECHANICS

7
IMAGING WIRE & CATHETER

8
TD-OCT,FD-OCT & IVUS

9
SAFETY COMPARISONS TD-OCT- Barlis P, Gonzalo N, Di Mario C, et al. A multicentre evaluation of the safety of intracoronary optical coherence tomography. EuroIntervention 2009;5:90 –5. 468 Patients studied- COMPLICATIONFREQUENCY(%) QRS WIDENING / ST CHANGES 47.6% OCCL & 45.5% NON OCCL VF1.1% AIR EMBOLISM0.6% VESSEL DISSECTION0.2%
 QRS WIDENING / ST CHANGES 47.6% OCCL & 45.5% NON OCCL VF1.1% AIR EMBOLISM0.6% VESSEL DISSECTION0.2%.")
10
Imola F, Mallus MT, Ramazzotti V, et al. Safety and feasibility of frequency domain optical coherence tomography to guide decision making in percutaneous coronary intervention. EuroIntervention 2010;6:575– 81. No serious electrocardiogram changes or complications with FD-OCT imaging using the nonocclusive flush technique. In preliminary registries of patients imaged with FD-OCT, the most frequent events were transient T-wave inversion or ST segment depression- 10% of cases.

11
60 patients studied using non occlusive technique No deaths were reported ECG changes were noted in 21. All changes were transient ECG CHANGESNUMBER ST DEPRESSION17(28%) ST ELEVATION4(7%)
 ST ELEVATION4(7%).")
12
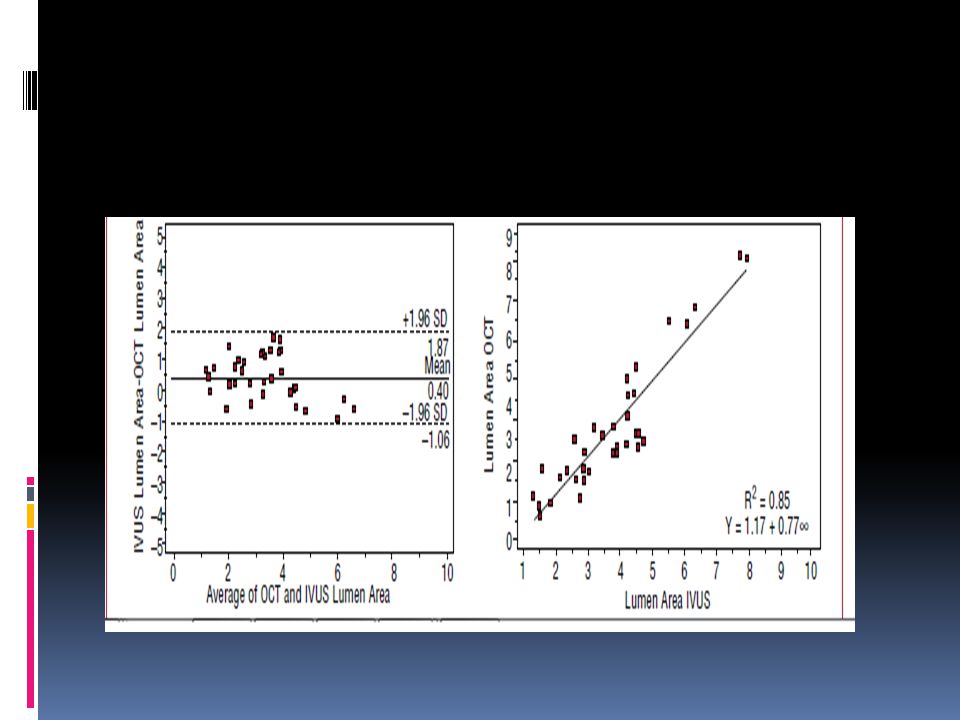
LUMEN ASSESSMENT OCT has been validated exvivo and in vivo for lumen measurements, demonstrating higher accuracy and reproducibility than IVUS. BUT OCT has not been validated for the assessment of functional severity in coronary stenosis

13
Quantitative Ex Vivo and In Vivo Comparison of Lumen Dimensions Measured by Optical Coherence Tomography and Intravascular Ultrasound in Human Coronary Arteries Nieves Gonzalo, Patrick W. Serruys, Héctor M. García-García, Gijs van Soest, Takayuki Okamura, Jurgen Ligthart, Michiel Knaapen, Stefan Verheye, Nico Bruining, and Evelyn Regara European study- Netherlands & Belgium Ex vivo: 8 specimens studied, the lumen area obtained using OCT and IVUS was larger than that obtained using histology: mean difference 0.8 (1) mm² (28%) for OCT and 1.3 (1.1) mm² (40%) for IVUS In vivo: 5 vessels analyzed, the lumen area obtained using IVUS was larger than that obtained using OCT: mean difference 1.67 (0.54) mm² (33.7%) for IVUS relative to OCT with occlusion and 1.11 (0.53) mm² (21.5%) relative to OCT without occlusion. The lumen area obtained using OCT without occlusion was larger than that obtained using OCT with occlusion: mean difference 0.61 (0.23) mm² (13%)
 mm² (28%) for OCT and 1.3 (1.1) mm² (40%) for IVUS In vivo: 5 vessels analyzed, the lumen area obtained using IVUS was larger than that obtained using OCT: mean difference 1.67 (0.54) mm² (33.7%) for IVUS relative to OCT with occlusion and 1.11 (0.53) mm² (21.5%) relative to OCT without occlusion. The lumen area obtained using OCT without occlusion was larger than that obtained using OCT with occlusion: mean difference 0.61 (0.23) mm² (13%).")
18
DIAGNOSTIC ASSESSMENT OF CORONARY ATHEROSCLEROSIS VULNERABLE PLAQUE

19
FIBROUS CAP

20
STUDY 30 patients INCLUSION – Chest pain >30min Admitted with in 6 hrs of symptom onset, ST elevation≥ 0.1mm in 2 or more contiguous leads, Identifiable culprit lesion in CAG. EXCLUSION- LBBB, Left main lesion, Unable to advance the IVUS, OCT catheters, Pacemaker rhythm,h/o MI or CS, Unsuccessful reperfusion of Thrombolysis In Myocardial Infarction (TIMI) flow grade 3 by initial aspiration thrombectomy before the imaging
 flow grade 3 by initial aspiration thrombectomy before the imaging.")
22
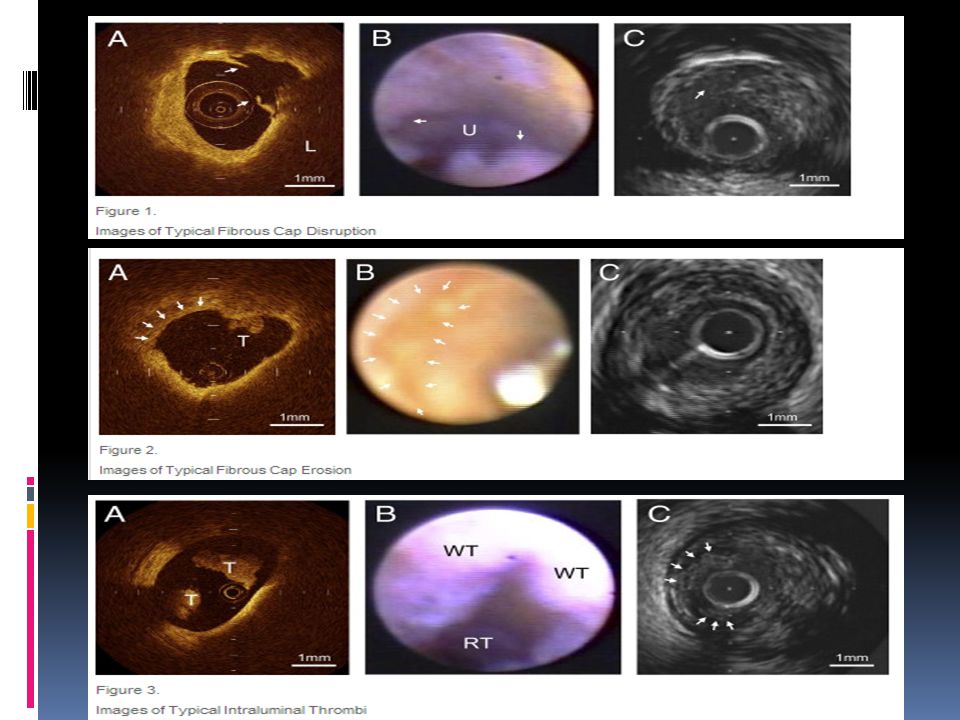
DEFINITIONS TCFA- Plaque with lipid content in ≥2 quadrants and the thinnest part of a fibrous cap measuring ≤65 μm Fibrous cap - Presence of fibrous cap discontinuity and a cavity formation of the plaque. Fibrous cap erosion - Loss of the endothelial lining with lacerations of the superficial intimal layers and without “trans-cap” ruptures. Intracoronary thrombus was identified by the mass images protruding into the vessel lumen from the surface of the vessel wall

23
Results

24
Am J Cardiol 2008;102:975–9.

25
43 patients Inclusion – ACS WITH OR WITHOUT ST ELEVATION USING NON OCCLUSIVE TECHNIQUE Patients were divided into a TCFA group and no-TCFA group on the basis of the OCT TCFA group had hs- CRP higher than no TCFA (median 3.3 mg/L vs 1.7 mg/L ) p = 0.03
 p = 0.03")
26
RESULTS Plaque rupture was found in 28 patients (65%) and multiple plaque ruptures in 5 patients (12%). OCT revealed 21 TCFAs in 18 patients (42%). Multiple TCFAs were found in the same vessel in 3 patients (7%). The distribution of TCFAs in the RCA of subject population was relatively even (proximal 2 [12%], mid 5 [29%], distal 3 [18%], p = 0.42) TCFAs in the LAD artery were common in proximal sites (proximal 6 [27%], mid 2 [9%], distal 0, p = 0.018)
. Multiple TCFAs were found in the same vessel in 3 patients (7%). The distribution of TCFAs in the RCA of subject population was relatively even (proximal 2 [12%], mid 5 [29%], distal 3 [18%], p = 0.42) TCFAs in the LAD artery were common in proximal sites (proximal 6 [27%], mid 2 [9%], distal 0, p = 0.018).")
27
Atherosclerosis Volume 202, Issue 2, 491-497, Feb 2009

28
40 Patients with Dyslipidemia undergoing PCI Statin treatment group (n=23) or control group (n=17). Serial OCT analyses were performed at baseline and 9-month follow-up for a non-PCI lipid-rich plaque lesion.

29
Results The LDL-cholesterol level in the statin group was significantly lower than that in the control group at follow-up. Although the fibrous-cap thickness was significantly increased in both the statin treatment group (151 ± 110 to 280 ± 120μm, p<0.01) and the control group (153 ± 116 to 179 ± 124μm, p<0.01) during follow-up period, the degree of increase was significantly greater in the statin treatment group than in the control group.
 and the control group (153 ± 116 to 179 ± 124μm, p<0.01) during follow-up period, the degree of increase was significantly greater in the statin treatment group than in the control group..")
30
Thin fibrous cap of < 65micronsThick fibrous cap of > 250 microns

32
Circulation 2005;111:1551–5.

33
A total of 69 patients were enrolled in the study ACS – STEMI, NSTEMI & UA included and also CSA Exclusion criteria- Significant left main disease, CHF or renal insufficiency with baseline Serum Creatinine >1.8 mg/dL (>133 μmol/L) or required emergency or primary PCI
 or required emergency or primary PCI")
34
OCT findings

35
Frequency of TCFA defined by lipid-rich plaque (≥2 quadrants) and fibrous cap thickness ≤65 μm. Jang I et al. Circulation 2005;111:1551-1555 Copyright © American Heart Association

36
INFLAMMATION

37
Enrolled patients= 49 Undergoing single-vessel PCI for de novo CAD over an 18-month period between July 2001 and December 2002. Exclusion criteria - Renal insufficiency (Creatinine ≥1.8 mg/dl), CABG intervention, and Emergent procedures including primary angioplasty.
, CABG intervention, and Emergent procedures including primary angioplasty..")
38
Figure 1 Fibrous cap segmentation and macrophage density images for lipid-rich plaques. (a) A normalized standard deviation (NSD) image demonstrating high macrophage density (blue → red) at a site of disruption (arrow) within a lipid-rich plaque (LP)... Briain D. MacNeill, Ik-Kyung Jang, Brett E. Bouma, Nicusor Iftimia, Masamichi Takano, Hiroshi Yabushita, Mil... Focal and multi-focal plaque macrophage distributions in patients with acute and stable presentations of coronary artery disease Journal of the American College of Cardiology Volume 44, Issue 5 2004 972 - 979
 A normalized standard deviation (NSD) image demonstrating high macrophage density (blue → red) at a site of disruption (arrow) within a lipid-rich plaque (LP)... Briain D. MacNeill, Ik-Kyung Jang, Brett E. Bouma, Nicusor Iftimia, Masamichi Takano, Hiroshi Yabushita, Mil... Focal and multi-focal plaque macrophage distributions in patients with acute and stable presentations of coronary artery disease Journal of the American College of Cardiology Volume 44, Issue")
39
Significantly greater macrophage density in both the STEMI (5.54 ± 1.48%) and the ACS (5.86 ± 2.01%) groups than in the SAP group (4.14 ± 1.81%) (p = 0.002 and p < 0.001, respectively). No significant difference was seen in macrophage density between the STEMI and the ACS groups (p = 0.38).
..")
40
CALCIUM NODULES Circulation 2002;106:1640–5.

41
OCT images of 357 (diseased) atherosclerotic arterial segments obtained at autopsy were correlated with histology. OCT -Fibrous plaques- Homogeneous, signal- rich regions Fibrocalcific plaques - Well-delineated, signal- poor regions with sharp borders Lipid-rich plaques signal-poor regions with diffuse border. LESION TYPESENSITIVITY(%)SPECIFICITY(%) FIBROUS71-7997-98 FIBRO CALCIFIC95-9697 LIPID RICH90-9490-92
SPECIFICITY(%) FIBROUS FIBRO CALCIFIC LIPID RICH")
42
(A) Fibrotic plaque: High signal (high backscattering) and low attenuation (deep penetration). (B) Predominantly calcified plaque: Sharp border, low signal, and low attenuation permitting deeper penetration. (C) Lipid-rich plaque: Diffuse border. ‡Calcified region; *lipid core.
 Predominantly calcified plaque: Sharp border, low signal, and low attenuation permitting deeper penetration. (C) Lipid-rich plaque: Diffuse border. ‡Calcified region; *lipid core..")
43
(A) Fibrous plaque with IEM (green arrow) and EEM (yellow arrow). (B) Plaque without IEM or EEM (white arrow). The EEM (yellow arrow) and IEM (green arrow) can be visualized opposite to the main lesion. (C) Fibrocalcific plaque showing circumferential signal-poor heterogeneous region with well-delineated borders. (D) Mixed plaque with focal calcific deposit comprising regions with sharply delineated borders, consistent with calcium (red arrow), and adjacent signal-poor areas with poorly delineated borders, suggestive of lipid (yellow arrows)
 Plaque without IEM or EEM (white arrow). The EEM (yellow arrow) and IEM (green arrow) can be visualized opposite to the main lesion. (C) Fibrocalcific plaque showing circumferential signal-poor heterogeneous region with well-delineated borders. (D) Mixed plaque with focal calcific deposit comprising regions with sharply delineated borders, consistent with calcium (red arrow), and adjacent signal-poor areas with poorly delineated borders, suggestive of lipid (yellow arrows).")
44
THROMBUS

45
Baseline characteristics

46
IMAGES COMPARING 3 MODALITIES

47
THROMBUS The intracoronary thrombus was observed in all cases by OCT and CAS, but it was identified only in 33% by IVUS (p < 0.001). The incidence of thrombus was significantly different between OCT and IVUS (p < 0.001) or between CAS and IVUS (p < 0.001), but not different between OCT and CAS (p = 1.000).
 or between CAS and IVUS (p < 0.001), but not different between OCT and CAS (p = 1.000)..")
49
VARIOUS TRIALS

50
OCT GUIDED INTERVENTION

51
Forty patients - 30 men and 10 women (Mean (SD) age 60 - range 42–79 years). Unstable Angina- 23 patients A/C Myocardial Infarction - 17. 42 lesion locations were imaged LAD - 10, LCX - 8, and RCA - 24

52
Definitions Dissection - Arterial disruption within or adjacent to the stent where a flap of tissue could be clearly differentiated from the underlying plaque. Prolapse- Protrusion of tissue between stent struts extending inside a circular arc connecting adjacent struts. Incomplete apposition- Clear separation between at least one stent strut and the vessel wall. Irregular stent strut distribution as a variation in interstrut separation greater than 200%

54
DISSECTION OCT V/S IVUS TISSUE PROLAPSE LACK OF STENT APPOSITION

56
STUDY Prospective, RCT- Evaluated healing of overlapping stents. 77 patients with a total of 86 overlapping stents: 25 SES, 24 PES, 26 ZES; and 11 BMS. Patients were categorised into high-grade stenosis (HGS, ≥70% diameter stenosis) and low-grade stenosis (LGS, <70%) at the site of stent overlap. Angiography v/s IVUS including OCT were performed after stent deployment and repeated at 6 months. End points were Binary restenosis, percentage Neointimal hyperplasia (%NIH), Mean lumen and stent areas and Degree of strut coverage/apposition at overlapping stents at 6 months
 and low-grade stenosis (LGS, <70%) at the site of stent overlap. Angiography v/s IVUS including OCT were performed after stent deployment and repeated at 6 months. End points were Binary restenosis, percentage Neointimal hyperplasia (%NIH), Mean lumen and stent areas and Degree of strut coverage/apposition at overlapping stents at 6 months.")
57
RESULTS Stent overlaps occurred in 49 HGS and 37 LGS. Restenosis - 5/6 HGS v/s 0/5 LGS - Overlapping BMS (p=0.01) 4/43 HGS versus 0/32 LGS - Overlapping DES. Higher %NIH at BMS overlap in HGS v/s LGS (p=0.07). DES overlaps had lower lumen and stent areas and similar %NIH in HGS v/s LGS. Uncovered or Malapposed struts- more often in overlapping DES at LGS than at HGS (59.4% vs 32.6%, p=0.03)
 4/43 HGS versus 0/32 LGS - Overlapping DES. Higher %NIH at BMS overlap in HGS v/s LGS (p=0.07). DES overlaps had lower lumen and stent areas and similar %NIH in HGS v/s LGS. Uncovered or Malapposed struts- more often in overlapping DES at LGS than at HGS (59.4% vs 32.6%, p=0.03).")
58
In a sub-analysis of the ODESSA trial, it was identified that 20 of 250 stented segments with no detectable NIH by IVUS, but had neointimal coverage ranging from 67% to 100% by OCT

59
INCOMPLETE STENT APPOSITION- the contact of the stent struts with the vessel wall or ISA is then defined as a strut–vessel distance greater than the strut thickness (metal and polymer) with the addition of a correction factor.
 with the addition of a correction factor.")
60
INCOMPLETE STENT APPOSITION

61
Strut–vessel distances ≤270 mm are spontaneously corrected by the neointimal reaction in 100% of the cases (distances ≤400 mm, in 93% of the cases). Gutie´rrez-Chico J, Wykrzykowska JJ, Nu¨esch E, van Geuns RJ, Koch K, Koolen JJ et al. Vascular tissue reaction to acute malapposition in human coronary arteries: sequential assessment with optical coherence tomography. Circ Cardiovasc Interv 2012

62
STRUTS CLASSIFICATION Embedded covered struts: Covered by tissue with at least 50% of the strut boundary below the level of the luminal surface. Protruding covered struts: Covered by tissue and with the strut boundary located above the level of the luminal surface. Uncovered apposed struts: Not covered by tissue but abutting the vessel wall. Uncovered and Malapposed struts: Not covered by tissue and not abutting the vessel wall

63
STRUT COVERAGE It is considered a surrogate for the completeness of Neointimal healing, which is believed to be protective against stent thrombosis Coverage assessed by OCT correlates with histological neointimal healing and endothelialization Detachment of struts from the vessel wall

64
UNCOVERED AND COVERED STRUTS

65
STRUT COVERAGE

67
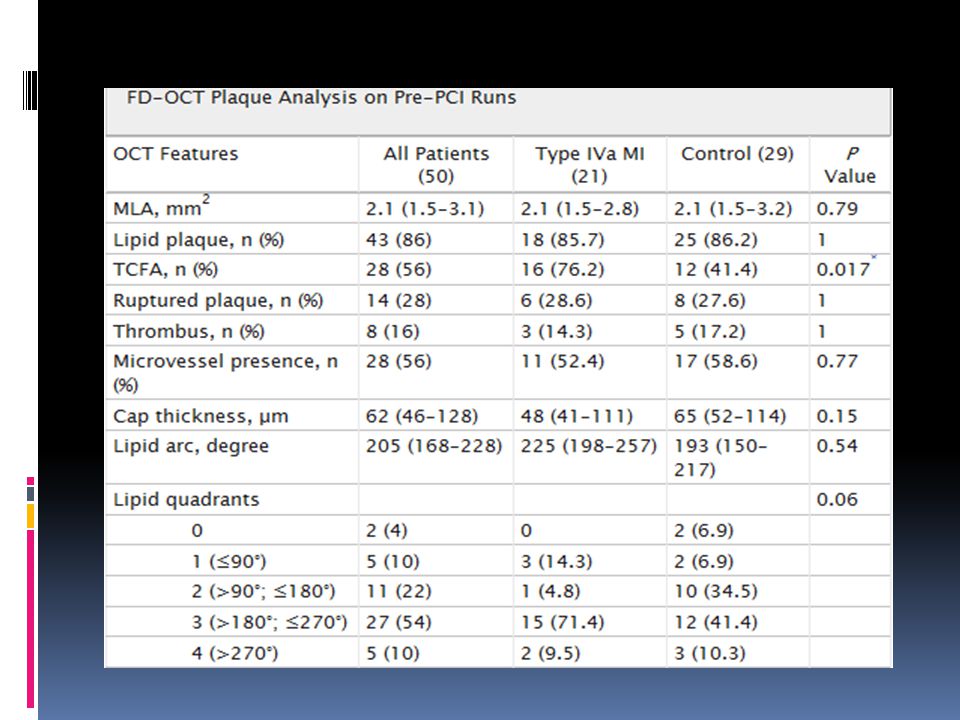
50 patients with NSTEMI or CSA All underwent single vessel stenting with DES Troponin T was analysed before PCI, after 12hrs and 24hrs. Type IV a MI defined as 1. Type IVa MI was defined in stable angina as a rise of at least 3× upper reference limit. 2. In NSTEMI as by post-PCI troponin T rise >20%.

68
Gonzalo N, Serruys et al. Optical coherence tomography assessment of the acute effects of stent implantation on the vessel wall: a systematic quantitative approach. Heart. 2009;95:1913–1919 Intrastent thrombus - Irregular mass with dorsal shadowing protruding into the lumen or a luminal mass with dorsal shadowing that was not connected to the vessel wall. Intrastent dissection - Disruption of the luminal vessel surface in the stented segment Edge dissection - Disruption of the luminal vessel surface at stent edges (within 5 mm proximal and distal to the stent, with no visible struts).
..")
69
Guagliumi G, Ikejima et al. Impact of drug release kinetics on vascular response to different zotarolimus-eluting stents implanted in patients with long coronary stenoses: the LONGOCT study (Optical Coherence Tomography in Long Lesions). JACC Cardiovasc Interv. 2011;4:778–785 Incomplete stent apposition - clear separation between at least 1 stent strut and the vessel wall. Malapposed stent strut was identified when this distance was higher than the sum of strut thickness plus abluminal polymer thickness, according to the stent manufacturer's specifications plus a compensation factor of 20 μm to correct for strut blooming
. JACC Cardiovasc Interv. 2011;4:778–785 Incomplete stent apposition - clear separation between at least 1 stent strut and the vessel wall. Malapposed stent strut was identified when this distance was higher than the sum of strut thickness plus abluminal polymer thickness, according to the stent manufacturer s specifications plus a compensation factor of 20 μm to correct for strut blooming.")
70
A-TCFA is imaged. Lipid arc is 273°, and cap thickness at the thinnest portion is 50 μm (arrows). B- Intrastent thrombus (arrow) is imaged as an irregular mass with dorsal shadowing protruding within the lumen. Stent struts can be identified from their bright “blooming” appearance and characteristic dorsal shadowing. C- Dissection (arrowhead), located in the body of the stent.
 is imaged as an irregular mass with dorsal shadowing protruding within the lumen. Stent struts can be identified from their bright blooming appearance and characteristic dorsal shadowing. C- Dissection (arrowhead), located in the body of the stent..")
71
D- Dissection (arrowhead), located at the stent edge. E- Tissue prolapse (arrow) is imaged as protrusion of tissue between stent struts extending inside a circular arc, connecting adjacent struts. F- Malapposed stent struts are shown (asterisks).
 is imaged as protrusion of tissue between stent struts extending inside a circular arc, connecting adjacent struts. F- Malapposed stent struts are shown (asterisks)..")
74
WHAT THE 2011 GUIDELINES SAY

75
RECOMMENDATIONS FOR OCT Probably Beneficial- Determination of optimal stent deployment (sizing, apposition, and lack of edge dissection), with improved resolution compared with IVUS. Possibly Beneficial- OCT can be useful for the assessment of plaque morphology. No Proven Value/Should be Discouraged- OCT should not be performed to determine stenosis functional significance. The writing group says that with current guidelines these modalities are not indicated when noninvasive imaging and angiographic data are concordant or when the result of the additional procedure will not alter the planned treatment strategy or optimization of stent implantation.

76
THANK YOU

Similar presentations


 of Neointimal Coverage of Sirolimus-Eluting Stent Three Months After Implantation.>")


 in FINLAND 9 e CFCI Hotel Meridien Etoile Paris, France 10 Octobre 2007 Pasi Karjalainen, MD, PhD.>")
-Right Carotid Review of the patient diagnosis In vivo image data Tissue matching between in-vivo and ex-vivo MRI. Matching MR and CT.>")