Download presentation
Presentation is loading. Please wait.

1
Center for Medicare and Medicaid Innovation Grant Barbara McAneny MD, CEO Innovative Oncology Business Solutions, Inc.

2
Funded BY CMMI: The project described is supported by Funding Opportunity Number CMS-ICI-12-0001 from Centers for Medicare and Medicaid Services, Center for Medicare and Medicaid Innovation The content of the presentation and the projects are solely the responsibility of the author and does not necessarily represent the official views of HHS or of any of its agencies.

3
Another Disclaimer The opinions expressed are my own and do not necessarily reflect the opinions of the AMA

4
Why do we need to change? What have we already tried? How did that work? What are are out options?

5
The Best Health Care in the World??? HOW THE US STACKS UP ON PREVENTABLE DEATHS 1. France -- 652. Japan -- 713. Australia -- 714. Spain -- 745. Italy -- 746. Canada -- 777. Norway -- 808. Netherlands -- 829. Sweden -- 8210. Greece --8411. Austria -- 8412. Germany -- 9013. Finland -- 9314. New Zealand -- 9615. Denmark -- 10116. UK -- 10317. Ireland --10318. Portugal --10419. US -- 110The U.S. ranks at the bottom of 19 industrialized nations in the number of preventable deaths by conditions such as diabetes, epilepsy, stroke, influenza, ulcers, pneumonia, infant mortality and appendicitis. The number at the right represents the number of preventable deaths per 100,000 population in each country in 2002-2003.Source: Commonwealth Fund, Health Affairs, World Health Organization

6
Patient’s Inability to pay 62.1% of Bankruptcies are from Medical bills : 48% of the bills are from Hospitals, 18% drugs, 15% physicians Annual Health Care Costs $16,771 2/3 of filers were insured

7
Some People are Suffering (seniors)
")
8
Not everyone is suffering ANNUAL COMPENSATION OF HEALTH INSURANCE COMPANY EXECS (2006, 2007, or 2008 figures): Ronald A. Williams, Chair/ CEO, Aetna Inc., $23,045,834; $24.3 million in 2008 H. Edward Hanway, Chair/ CEO, Cigna Corp, $30.16 million David B. Snow, Jr, Chair/ CEO, Medco Health, $21.76 million Michael B. MCallister, CEO, Humana Inc, $20.06 million Stephen J. Hemsley, CEO, UnitedHealth Group, $13,164,529 Angela F. Braly, President/ CEO, Wellpoint, $9,094,771; $9.8 million in 2008 Dale B. Wolf, CEO, Coventry Health Care, $20.86 million Jay M. Gellert, President/ CEO, Health Net, $16.65 million William C. Van Faasen, Chairman, Blue Cross Blue Shield of Massachusetts, $3 million plus $16.4 million in stock options

9
HMO Profits HMO Net Income after Tax before extra items United Healthcare Humana Cigna Corporation Wellpoint, Inc. Aetna, Inc. Net Income In millions of USD (except for per share items) 3 months ending 2010-06-30 $1,123M $1340.08M $294M $722M $491M http://www.google.com/finance?q=NYSE:
 3 months ending $1,123M $ M $294M $722M $491M q=NYSE:.")
10
We already have a government run health care system

11
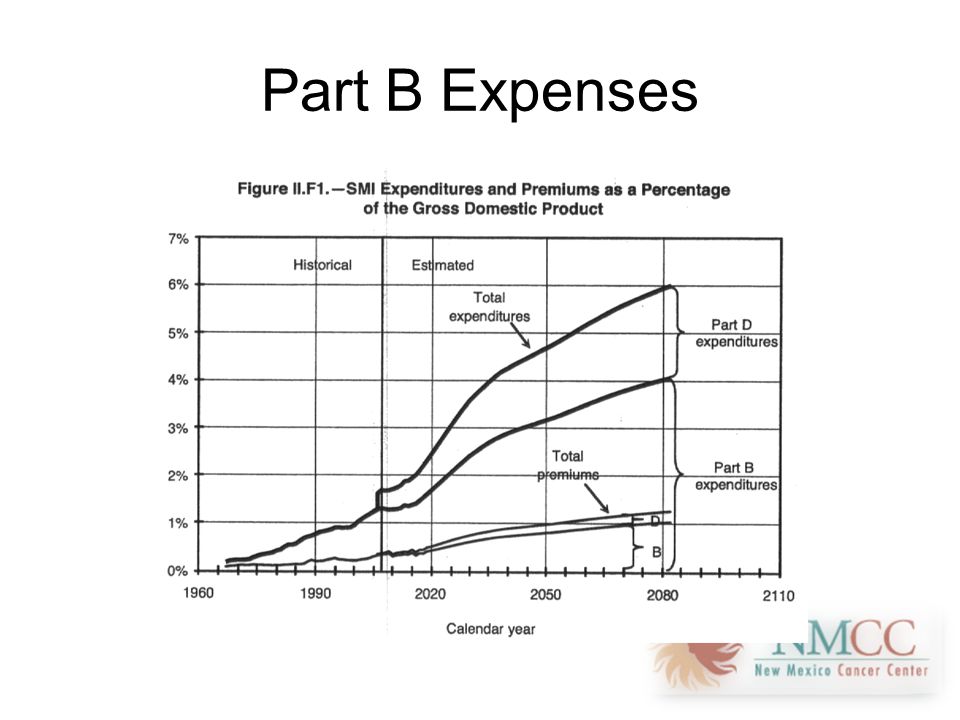
Medicare 101 Part A: Hospital insurance trust fund Part B: Supplementary Medical Insurance Trust Fund from general tax revenues and a premium paid by enrollee Sustainable Growth Rate Formula (SGR) –Designed to control Part B expenses –Zero Sum Game (Budget Neutrality)
 –Designed to control Part B expenses –Zero Sum Game (Budget Neutrality)")
12
We Cannot Afford Medicare as it is

13
Medicare Deficit

14
Costs of Part A

15
Health Insurance Trust Fund is Going Broke

17
Part B Expenses

19
Physician Income Already at Risk 19 Profit per Patient Private Practice Medical Oncologists Drug Margins 1 Private Practice Medical Oncologists Threatening Future Viability of Medical Oncology Delivery Model Source:McKesson, “Onmark 3 rd Annual Benchmarking Survey Shows Community Oncology Practices Seeing More Patients, Makey Uses Profit Per Physician,” July 29, 2008, available at: www.mckesson.com, accessed September 2, 2009. 1 Measured as gross revenue divided by total number of patients.

20
Cost of Parts B&D

22
Decline in Drug Administration Since 2004 Source: Projections based on data from the Centers for Medicare & Medicaid Services

23
Future needs for cancer care 70% of cancer patients will be in Medicare in 2030 (60% are Medicare now) 30% shortfall in number of oncologists needed to treat cancer patients 30% cut in the conversion factors will put the rest of community oncology at risk, and severely strain the hospital based clinics
 30% shortfall in number of oncologists needed to treat cancer patients 30% cut in the conversion factors will put the rest of community oncology at risk, and severely strain the hospital based clinics")
24
Triple Aim Better health Better Healthcare Lower cost

25
CMS Demonstration Projects Since 1967 CMS has had the authority to create demonstration projects – Disease management and care coordination (6) Nurses are care managers – Value based payment(4)
 Nurses are care managers – Value based payment(4)")
26
Medicare Demonstration Projects Integrated systems: Group practice demonstrations Value based purchasing (P4P) Disease management Utilization Review
 Disease management Utilization Review")
27
Disease management CBO Jan 2012: “most programs have not reduced Medicare spending: In nearly every program involving disease management and care coordination, spending was either unchanged or increased relative to the spending that would have occurred in the absence of the program”

29
Medicare Group Practice Demonstration Project The 10 practices, chosen from 26 applicants, are: Dartmouth-Hitchcock Clinic, Bedford, N.H. Deaconess Billings Clinic, Billings, Mont. The Everett Clinic, Everett, Wash. Forsyth Medical Group, Winston-Salem, N.C. Geisinger Health System, Danville, Pa. Marshfield Clinic, Marshfield, Wis. Middlesex Health System, Middletown, Conn. Park Nicollet Health Services, St. Louis Park, Minn. St. John's Health System, Springfield, Mo. University of Michigan Faculty Group Practice, Ann Arbor

30
2 of the 10 saved some money In the first year, Marshfield saved the Medicare trust fund just more than $6 million, and the facility is set to receive roughly $4.5 million of that. Forsyth saved Medicare about $3.5 million and is in line for a roughly $2.8 million payout.

31
CBO on the P4P demonstration A detailed analysis of the demonstration is currently available only for the first two years. That analysis showed that, for patients in the 10 group practices during the second year, average Medicare spending excluding the bonuses paid to physician groups was about 1 percent below projections; with bonuses included, average Medicare spending was just 0.1 percent below projections— about $7 per beneficiary.

32
Value Based Systems CBO comments 1/2012 In one of the four demonstrations examined, Medicare made bundled payments that covered all hospital and physician services for heart bypass surgeries; Medicare’s spending for those services was reduced by about 10 percent under the demonstration. Other demonstrations of value-based payment appear to have produced little or no savings for Medicare.

33
My Theory Hospital based systems are not the answer: – Overpaid – Inefficiencies are built in – No incentive to decrease utilization Practices, if right sized and properly structured, can be very efficient ways to deliver cancer care – Big enough to attain economies of scale – Small enough to be managed

34
Potential Cost Savings from Medical Homes: Supporting Literature StudyPatient Types ED Visits IP Adm Group Health Coop of Puget Sound (12 mos)All Pts- 29 %- 11 % Community Care of North CarolinaAsthma- 16 %- 40% Health Partners Medical Group BestCare Patient Centered Medical Home (PCMH) (5 Yrs) All Pts- 39 %- 24 % Genessee Health Plan HealthWorks PCMH (4 yrs)All Pts- 50%- 15 % Johns Hopkins Guided Care (12 mos)Chronic Disease - 15 %- 24 % Geisenger Health System ProvenHealth NavigatorChronic Disease ---- 14 % Intermountain Healthcare Medical Group PCMHAll Pts ---- 10%
All Pts- 29 %- 11 % Community Care of North CarolinaAsthma- 16 %- 40% Health Partners Medical Group BestCare Patient Centered Medical Home (PCMH) (5 Yrs) All Pts- 39 %- 24 % Genessee Health Plan HealthWorks PCMH (4 yrs)All Pts- 50%- 15 % Johns Hopkins Guided Care (12 mos)Chronic Disease - 15 %- 24 % Geisenger Health System ProvenHealth NavigatorChronic Disease % Intermountain Healthcare Medical Group PCMHAll Pts %")
35
Chemotherapy costs by site of service (annualized) Physician fee schedule payments: $47,500 Hospital Outpatient Prospective Payment System: $54,000 Milliman Client Report Oct 19, 2011 by Fitch and Pyenson
 Physician fee schedule payments: $47,500 Hospital Outpatient Prospective Payment System: $54,000 Milliman Client Report Oct 19, 2011 by Fitch and Pyenson")
36
MEDPAC March 2011 When patients visit a physician office that is part of a hospital’s outpatient department, Medicare pays a facility fee to the hospital and a reduced fee for the physician’s services. The combined fees paid for visits to hospital-based practices are often more than 50 percent greater than rates paid to freestanding practices.

38
COA Practice Impact Report

39
CMMI Grant $19.8M 7 practices Significant savings from being an Oncology Medical Home Goal is to learn how to do bundled payments Shared savings, but not gainsharing

40
COME HOME Model 1. Best Practices Care: Triage, Diagnostic & Therapeutic Pathways 3. Team-Based Care: Med/Rad Onc, Diag Radiology, NPs, RNs, LPNs, Pharmacists, Med Techs, Care Coordinators, first responders – working as team to keep patients in OP setting and out of ER and hospital 4. Active Disease Management: Patient Education, patient/provider web portal 5. Enhanced Access: 24/7 Triage Line with “first responders” (8-6) and On-Call Providers (6-8) 6. Enhanced Care: On- or near-site lab, imaging, pharmacy 7. Financial Support for Medical Home Services 2. Electronic Health Records – to share/track real-time patient information; monitor quality Oncology Patient
 and On-Call Providers (6-8) 6. Enhanced Care: On- or near-site lab, imaging, pharmacy 7. Financial Support for Medical Home Services 2. Electronic Health Records – to share/track real-time patient information; monitor quality Oncology Patient.")
41
COME HOME Project Partners Innovative Oncology Business Solutions (IOBS) – managing organization formed for the purposes of administering project Seven community oncology practices – New Mexico Cancer Center – Center for Cancer & Blood Disorders (Ft. Worth) – Dayton Physician Network (OH) – Space Coast Oncology – Maine Center for Cancer Medicine – NW Georgia Oncology Centers – To be determined Net.Orange – HIT company creating customized quality & pathway performance dashboards using claims data and integrated EHRs KEW Group – integration of genetic markers into diagnostic and therapeutic pathways UTHSC – evaluation, cost, quality measurement expertise; using claims data for rapid-cycle feedback of cost/utilization performance
 – Dayton Physician Network (OH) – Space Coast Oncology – Maine Center for Cancer Medicine – NW Georgia Oncology Centers – To be determined Net.Orange – HIT company creating customized quality & pathway performance dashboards using claims data and integrated EHRs KEW Group – integration of genetic markers into diagnostic and therapeutic pathways UTHSC – evaluation, cost, quality measurement expertise; using claims data for rapid-cycle feedback of cost/utilization performance.")
42
COME HOME: Targeted Patients Newly diagnosed or relapsed oncology patients Seven tumor types will be put on Diagnostic/ Therapeutic Pathways: – Breast – Lung – Colorectal – Lymphoma – Melanoma – Pancreas – Thyroid Seeking care @ 1 of 7 participating sites

43
COME HOME: Estimated Enrollment Patient TypeMedicareNon-MedicareTotal Breast Cancer1,5873041,891 Lung Cancer1,5362941,830 Colorectal Cancer8881701,058 Lymphoma538103641 Melanoma43984523 Pancreas40277479 Thyroid14728175 Other Cancers2,4854762,961 Total Cases8,0221,5369,558

44
Community Oncology Medical HOME Medical home model of aggressive management of the side effects of cancer and its therapies Patient education Triage Same day visits Prospective interventions

45
COME HOME: Services To Be Delivered Enhanced Services (Phase I) – Patient education & medication management – 24/7 practice access: telephone triage, triage pathways, night/weekend clinic hours, on-call physicians – On-site or near-site imaging, lab testing – Admitting physicians who shepherd pts through IP encounters, avoiding handoffs & readmits, ensure seamless care
 – Patient education & medication management – 24/7 practice access: telephone triage, triage pathways, night/weekend clinic hours, on-call physicians – On-site or near-site imaging, lab testing – Admitting physicians who shepherd pts through IP encounters, avoiding handoffs & readmits, ensure seamless care")
46
Pathways Diagnostic pathways, including genetic markers (Phase II) Therapeutic pathways, including genetic markers (Phase III) Decision support
 Therapeutic pathways, including genetic markers (Phase III) Decision support")
47
Data Management is Key Extracting data from EHRs – All practices fully electronic – Outcomes will be documented Combining with Medicare Claims Data – Essential to know savings Real time (or close) – Able to drill down to monitor adherence Control groups
 – Able to drill down to monitor adherence Control groups")
48
Projected Savings to Medicare (CMS) Service Average Cost Per Unit of Service Baseline Total Costs Per Patient* Projected Decrease in Costs Projected Total Costs Per Patient Projected Average Savings Per Patient Hospital$8,225$17,108- 21.15 %$13,489$3,619 ED Visits$ 554$ 1,136- 52.2 %$543$ 593 Physician$ 228$ 6,398+ 7.6 %$6,882- $ 484 Pharmacy$ 90$13,355 - 3.4 %$12,905$ 450 Other$9,480$28,573 0.00 %$28,573$ 0 Total$66,5696.276 %$62,391 $4,178 *Cost Projections based on Medical Expenditure Panel Survey (MEPS) data for Medicare beneficiaries in ‘poor health’, inflated to reflect higher expenditures associated with cancer.
 Service Average Cost Per Unit of Service Baseline Total Costs Per Patient* Projected Decrease in Costs Projected Total Costs Per Patient Projected Average Savings Per Patient Hospital$8,225$17, %$13,489$3,619 ED Visits$ 554$ 1, %$543$ 593 Physician$ 228$ 6, %$6,882- $ 484 Pharmacy$ 90$13, %$12,905$ 450 Other$9,480$28, %$28,573$ 0 Total$66, %$62,391 $4,178 *Cost Projections based on Medical Expenditure Panel Survey (MEPS) data for Medicare beneficiaries in ‘poor health’, inflated to reflect higher expenditures associated with cancer.")
49
Bundled payments First one to get the money wins? Transparency is essential Need a quality pool Need a mechanism to avoid the law of small numbers Need good data on costs and payments, real time

50
Shared savings Not Gainsharing: I don’t want to compete against myself Pick a target with a reputation for quality Need accurate claims data NCCN systems defined as the patients treated by an NCCN hospital

51
Questions? I appreciate the opportunity to present this project Thanks for listening

Similar presentations


>")


