Download presentation
Presentation is loading. Please wait.

1
Estimating Contribution of Women through Time Use Survey: Indian Experience Contributed by the National Academy of Statistical Administration Central Statistics Office, India

2
Why Time Use Survey? – To provide Time Use Statistics What Time Use Statistics Provide? – Information about individual time disposition on a daily and weekly basis with a combination of specificity and comprehensiveness not achieved in any type of social survey Time Use Studies in Developed Countries – Used these studies mainly to measure household unpaid work – To analyze the relationship between market and domestic labour – Serves as a basis for quantifying the domestic work in monetary terms comparable to production included in National Accounts

3
Objectives of Time Use Studies in Developing Countries To collect relevant data on the following: Market oriented economic activity not included in labour force and/or in national accounts due to the inadequacy of concepts and methods of conventional surveys. Non-market oriented economic activities covered under the Production Boundary of 1993-SNA: These activities would be production of goods for self consumption, collection of water, fuel, fodder etc., construction and repair of buildings etc. Non-market oriented non-SNA activities, which fall under the Extended Production Boundary as per the 1993-SNA: These activities would be mainly related to domestic and voluntary services. Personal care services that cannot be delegated to others.

4
Ministry of Statistics & P. I. decided to organize a Time Use Study in 1998-99 with the following objectives: To derive a conceptual framework and suitable methodology for Time Use Surveys To evolve methodology to estimate workforce and estimate value of unpaid work Analysis of the Time Use data to infer policy/ programme implications To analyze and understand the Time Use pattern of different sections of population in various types of activities To use the data in generating more reliable estimates on work force and national income as per 1993-SNA, and in computing the value of unpaid work through separate satellite account

5
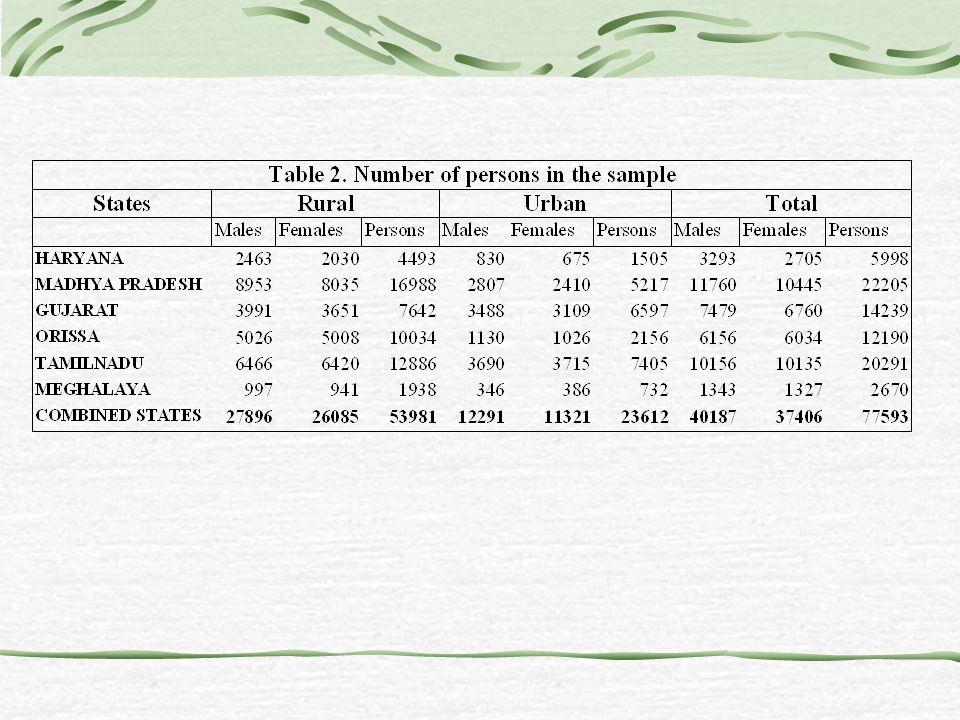
Selection of States Six States selected to represent six geographical regions Northern – Haryana (6 districts) Central - Madhya Pradesh (15 districts) Western – Gujarat (7 districts) Eastern – Orissa (10 districts) North Eastern – Meghalaya (4 districts) Southern - Tamil Nadu (10 districts)
 Central - Madhya Pradesh (15 districts) Western – Gujarat (7 districts) Eastern – Orissa (10 districts) North Eastern – Meghalaya (4 districts) Southern - Tamil Nadu (10 districts)")
8
Characteristics of Surveyed Population Average size of household was about 4.16 with maximum being 4.56 in Gujarat and lowest in Tamil Nadu (3.57) About 10% of rural households and 9% of urban households headed by women Overall literacy rate found to be 67% with 56% for females and 77% for males About 87% of women reported participation in household decision making
 About 10% of rural households and 9% of urban households headed by women Overall literacy rate found to be 67% with 56% for females and 77% for males About 87% of women reported participation in household decision making")
9
ACTIVITY CLASSIFICATION To capture the individual response on the time use pattern All the activities categorised into activities pertaining to System of National Accounts (SNA), Extended SNA and Non-SNA. A new classification was developed The activities were grouped into following categories: SNA ( Productive and Economic) Activities I. Primary production activities II. Secondary activities III. Trade, business and services Extended SNA Activities IV. Household maintenance, management and shopping for own households V. Care for children, the sick, elderly and disabled for own household VI. Community services and help to other households Non-SNA Activities VII. Learning VIII.Social and cultural activities, mass media etc. IX. Personal care and self maintenance
 Activities I. Primary production activities II. Secondary activities III. Trade, business and services Extended SNA Activities IV. Household maintenance, management and shopping for own households V. Care for children, the sick, elderly and disabled for own household VI. Community services and help to other households Non-SNA Activities VII. Learning VIII.Social and cultural activities, mass media etc. IX. Personal care and self maintenance.")
10
Main Findings

11
Table 1 gives the distribution of time spent on three types of activities viz. SNA, Extended SNA & Non-SNA assuming that all individuals participate in various activities Time spent in SNA activities for rural males is highest in Meghalaya (48.28 hours) and lowest in Orissa (39.54 hours). Trend almost similar for rural females. For urban males, highest time is used in Tamil Nadu (43.28 hours) followed by Orissa (42.13 hours). For urban females, highest time is found in Meghalaya (14.42 hours) followed by Haryana (11.21 hours ).
 and lowest in Orissa (39.54 hours). Trend almost similar for rural females. For urban males, highest time is used in Tamil Nadu (43.28 hours) followed by Orissa (42.13 hours). For urban females, highest time is found in Meghalaya (14.42 hours) followed by Haryana (11.21 hours )..")
13
In extended SNA activities the participation of males is highest in Meghalaya (7.16 hours) followed by Orissa (4.47 hours) and Madhya Pradesh (4.43 hours). Whereas female participation in these activities is highest in Gujarat (39.08 hours) followed by Madhya Pradesh (35.79 hours) and Orissa (30.46 hours). In Non-SNA activities, the participation of males is highest in Haryana (128 hours a week) and is lowest in Meghalaya (114 hours a week); whereas participation of females in these activities is highest in Tamil Nadu (118 hours a week) and lowest in Meghalaya (107 hours a week). Table 2 presents the percentage distribution time in three types of activities
 followed by Madhya Pradesh (35.79 hours) and Orissa (30.46 hours). In Non-SNA activities, the participation of males is highest in Haryana (128 hours a week) and is lowest in Meghalaya (114 hours a week); whereas participation of females in these activities is highest in Tamil Nadu (118 hours a week) and lowest in Meghalaya (107 hours a week). Table 2 presents the percentage distribution time in three types of activities.")
15
Unpaid SNA Activities The sex wise detail of the unpaid work in the SNA activities is given in Table 3. For the six States combined, payment was not made for about 38% of the time spent in SNA activities. The amount of unpaid activities was more (51%) for female as compared to only 33 % for male. The predominance of women in unpaid activities was visible in all the States. The percent of time spent by females in unpaid activities was highest in Haryana(86%) followed by Meghalaya(76%) and Orissa(69 %). This percentage was lowest for Tamil Nadu (32%).
 for female as compared to only 33 % for male. The predominance of women in unpaid activities was visible in all the States. The percent of time spent by females in unpaid activities was highest in Haryana(86%) followed by Meghalaya(76%) and Orissa(69 %). This percentage was lowest for Tamil Nadu (32%)..")
19
Time use pattern in care of children, sick and elderly people by age, sex, marital status and educational level is presented in Tables 6 and 7. Females spend about double the time as compared to male Time spent by currently married and widowed females found to be higher than those for never married and divorced Females aged 60 years and above found to be spending maximum time as compared to those in the age group 6-14 and 16-59 No significant impact of educational level in such activities

22
Time spent on Personal care and self maintenance presented in Tables 8 and 9 Not much significant difference according to sex Iindividuals aged 60 years and above spent about 124 hours as compared to 98 hours in the age group 6-14 and about 95 hours in the age group 15-59 Time spent in these activities found to be slowly decreasing with educational level

27
Valuation of Unpaid Work Measurement of Gross Domestic Product (GDP) includes production boundary within SNA like: The production of all individual or collective goods or services that are supplied to units other than their producers, or intended to be supplied, including the production of goods or services used up in the process of producing such goods and services; The own-account production of all goods that are retained by their producers for their own final consumption or gross capital formation; The own-account production of housing services by own-occupiers and of domestic and personal services produced by employing paid domestic staff. Extended SNA Activities: - are generally in the form of personal services and are not considered for computation of the GDP because no standard frame work have been developed for valuing these services.

28
Need For Valuation of Extended SNA Activities -Limited scope of the definition of the 'economic activity' is used in the System of National Accounts (SNA), which renders the contribution of some section of population specially women unvalued or undervalued. -Non market activities, which are welfare in nature could not valued. -Main reason is that there is no quantitative method available for the same. -However, the following types of work can be easily valued: a)unpaid work in household unincorporated enterprise including household subsistence production of goods; b)unpaid work of production of household own-account services; and; c)unpaid work of household as volunteers in non profit institutions. How to price these work: Opportunity cost: The cost of the wages foregone as a result of opting not to offer services in the market. The valuation will change depending upon who is engaged in the unpaid work. Replacement cost (specialist): The wage of specialist or profession engaged in the activity in the market(wage=wage rate*time spent). Replacement cost (generalist): The wages paid to household worker(wage=wage rate*time spent) or depending upon the practice in the country.
unpaid work in household unincorporated enterprise including household subsistence production of goods; b)unpaid work of production of household own-account services; and; c)unpaid work of household as volunteers in non profit institutions. How to price these work: Opportunity cost: The cost of the wages foregone as a result of opting not to offer services in the market. The valuation will change depending upon who is engaged in the unpaid work. Replacement cost (specialist): The wage of specialist or profession engaged in the activity in the market(wage=wage rate*time spent). Replacement cost (generalist): The wages paid to household worker(wage=wage rate*time spent) or depending upon the practice in the country..")
29
Value of unpaid work = average time spent for activity* wage rate*no. of person = total time spent for activity* wage rate per unit of time

30
Notations and Calculation Procedure T C A : The weekly average time spent by an average children aged 6-14 years for the Extended-SNA activities for the type of area ‘A’ (rural/urban). T AD A,S : The weekly average time used by an average individual aged 15 years and above for the Extended-SNA activities for the type of area ‘A’ (rural/urban) and sex 'S' (male/female). W c A : The daily (8 hours) wage rate for the children aged 6-14 years in area 'A' (rural/urban) W AD A,S : The daily (8 hours) wage rate for the individual aged 15 years and above in area 'A' (rural/urban) and sex 'S' (male/female). P C A : The projected population under the type of area 'A' (rural/urban) in the age group 6-14 years. P AD A,S : The projected population under the type of area 'A' (rural/urban) for the sex 'S' (male/female) in the age group 15 years and above. V : The average annual value (in crores) of work done for the entire district. State level estimates of value of unpaid work was calculated as follows: District level values in the age-groups 6-14 years and 15 years and above were obtained with rural/urban break up. The values were also obtained separately for males and females in the age-groups 15 years and above and for children in the age 6-14 years. Per capita value for the districts covered in the sample were obtained by dividing the total value for all the districts by the total populations of the districts covered in the sample in respective age-groups with rural/urban break up. State level estimate of values in the respective age-groups with rural/urban break up were obtained by multiplying the per capita value for the districts covered in the sample by the corresponding total population in the State.
 and sex S (male/female). W c A : The daily (8 hours) wage rate for the children aged 6-14 years in area A (rural/urban) W AD A,S : The daily (8 hours) wage rate for the individual aged 15 years and above in area A (rural/urban) and sex S (male/female). P C A : The projected population under the type of area A (rural/urban) in the age group 6-14 years. P AD A,S : The projected population under the type of area A (rural/urban) for the sex S (male/female) in the age group 15 years and above. V : The average annual value (in crores) of work done for the entire district. State level estimates of value of unpaid work was calculated as follows: District level values in the age-groups 6-14 years and 15 years and above were obtained with rural/urban break up. The values were also obtained separately for males and females in the age-groups 15 years and above and for children in the age 6-14 years. Per capita value for the districts covered in the sample were obtained by dividing the total value for all the districts by the total populations of the districts covered in the sample in respective age-groups with rural/urban break up. State level estimate of values in the respective age-groups with rural/urban break up were obtained by multiplying the per capita value for the districts covered in the sample by the corresponding total population in the State..")
31
Value of unpaid activities as compared to State Domestic Product StateTotal Value (in Crores) Of Extended SNA ActivitiesState Domestic Product (In Crores) At Current Prices (1998-99) Value of Extended SNA as a % of SDP MaleFemaleChildrenTotalMaleFemaleChildrenTotal Haryana759.058739.13525.9510024.13436711.74%20.01%1.20%22.95% Madhya Pradesh3360.8222877.182289.6928527.69907373.70%25.21%2.52%31.44% Gujarat1613.2318541.951767.0221922.211022061.58%18.14%1.73%21.45% Orissa1440.888734.37763.6210938.88358344.02%24.37%2.13%30.53% Tamil Nadu2934.1718944.931492.8623371.961170442.51%16.19%1.28%19.97% Meghalaya217.72692.21127.871023.7329967.27%23.10%4.27%34.17%
 Of Extended SNA ActivitiesState Domestic Product (In Crores) At Current Prices ( ) Value of Extended SNA as a % of SDP MaleFemaleChildrenTotalMaleFemaleChildrenTotal Haryana %20.01%1.20%22.95% Madhya Pradesh %25.21%2.52%31.44% Gujarat %18.14%1.73%21.45% Orissa %24.37%2.13%30.53% Tamil Nadu %16.19%1.28%19.97% Meghalaya %23.10%4.27%34.17%")
32
Policy Implications from Time Use Survey Extent of Unpaid Work in SNA and Extended-SNA activities Work in SNA Activities About 38% of time spent in SNA activities goes unpaid; the amount of unpaid activities being more for females (51%) as compared to about 33% for males This unpaid and non-marketed production not captured properly in usual Labour force surveys
 as compared to about 33% for males This unpaid and non-marketed production not captured properly in usual Labour force surveys")
33
Work in Extended-SNA Activities Information on unpaid household production of goods and services for own use(Extended-SNA activities) not available elsewhere Extended-SNA activities- immensely valuable to the economy and society About 90% of the work in Extended-SNA activities done by women A greater extent of women’s contribution to the economy goes unrecognized TUS data- a good source of information to fill existing data gaps
 not available elsewhere Extended-SNA activities- immensely valuable to the economy and society About 90% of the work in Extended-SNA activities done by women A greater extent of women’s contribution to the economy goes unrecognized TUS data- a good source of information to fill existing data gaps")
34
34

Similar presentations


>")


 Indicators on Employment, Philippines: 1999-2010 (In percent) GOAL 1: ERADICATE EXTREME POVERTY AND HUNGER Target 1.B:>")


