Download presentation
Presentation is loading. Please wait.

2
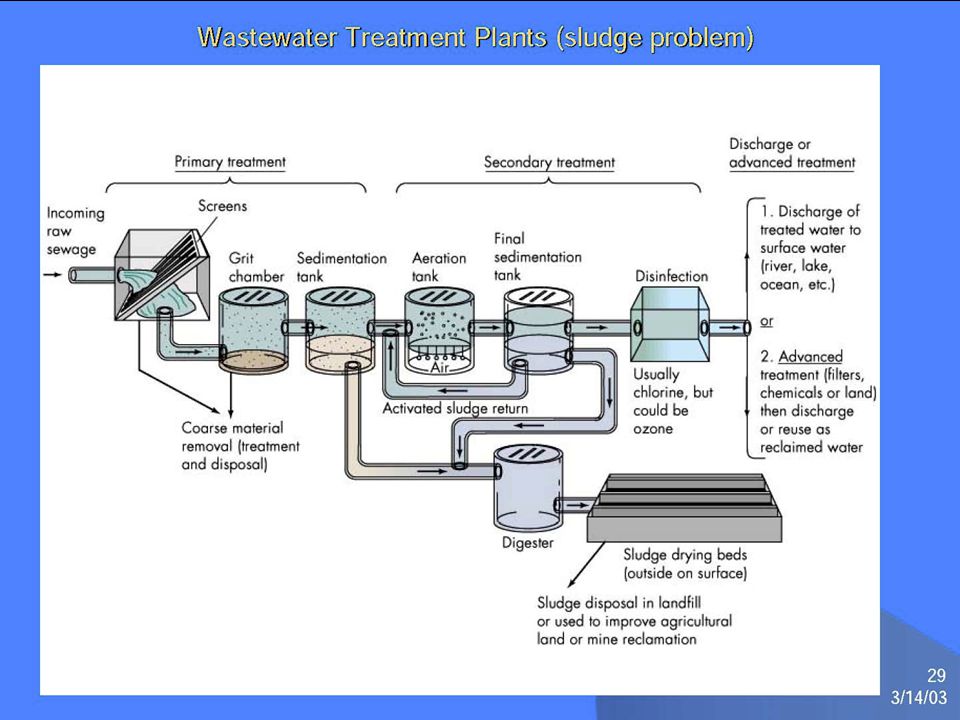
Where does the sludge go? 50-100 grams per person per day Sludge handling/disposal accounts for 25-50% of the cost –Sludge treatment:- Convert organics to a stable form Remove liquid to reduce volume Destroy harmful organisms Produce useful byproducts –soil

3
Sewage Treatment in San Diego & The International Border San Diego System: 2 million people over 550 square miles 190 million gallons a day

4
Collection System 1. Over 2,800 miles of pipes collect sewage 2. 84 collection system pump stations 3. 6 major “Metro” pump stations 4. 28 miles of interceptor pipes 5. 15 connecting agencies (Cities and municipalities) that utilize the Metro system for sewage disposal
 that utilize the Metro system for sewage disposal.")
5
Treatment System 1. Point Loma Treatment Plant (Advanced Primary treatment) 240 MGD Capacity. 2. North City Water Reclamation Plant, 30 MGD 3. South Bay Water Reclamation Plant, 15 MGD 4. San Pasqual Aqua Culture Plant, 1 MGD 5. Metro Biosolids Center. (Biosolids/Sludge processing)
.")
7
Point Loma Wastewater Treatment Plant

8
SAN DIEGO AREA SEWERAGE HISTORY 1935: discharging nine million gallons of raw sewage through 22 outfalls. Nine of these empty into San Diego Bay. 1935: discharging nine million gallons of raw sewage through 22 outfalls. Nine of these empty into San Diego Bay. 1943 :first primary treatment plant at 32nd Street and Harbor Drive with a capacity of 14 million gallons a day (MGD). 1943 :first primary treatment plant at 32nd Street and Harbor Drive with a capacity of 14 million gallons a day (MGD). 1950: Original 32nd Street expanded to 40 MGD capacity. Pollution in San Diego Bay continues 1950: Original 32nd Street expanded to 40 MGD capacity. Pollution in San Diego Bay continues
 :first primary treatment plant at 32nd Street and Harbor Drive with a capacity of 14 million gallons a day (MGD). 1950: Original 32nd Street expanded to 40 MGD capacity. Pollution in San Diego Bay continues 1950: Original 32nd Street expanded to 40 MGD capacity. Pollution in San Diego Bay continues.")
9
SAN DIEGO AREA SEWERAGE HISTORY 1960:Water pollution in San Diego caused by sewage worst ever seen. Santee to the east is operating a state of the art reclamation plant. 1960:Water pollution in San Diego caused by sewage worst ever seen. Santee to the east is operating a state of the art reclamation plant. 1963: Metro system is put into operation. One primary treatment plant at Point Loma with a capacity of 88 MGD. Treated wastewater discharged 3 miles offshore into the Pacific Ocean. 1963: Metro system is put into operation. One primary treatment plant at Point Loma with a capacity of 88 MGD. Treated wastewater discharged 3 miles offshore into the Pacific Ocean. 1972: Northern areas of the city (Sorrento Valley, Poway and Del Mar) connect into the Metro system Clean Water Act is passed requiring San Diego to covert to secondary treatment by 1975. 1972: Northern areas of the city (Sorrento Valley, Poway and Del Mar) connect into the Metro system Clean Water Act is passed requiring San Diego to covert to secondary treatment by 1975.
 connect into the Metro system Clean Water Act is passed requiring San Diego to covert to secondary treatment by : Northern areas of the city (Sorrento Valley, Poway and Del Mar) connect into the Metro system Clean Water Act is passed requiring San Diego to covert to secondary treatment by")
10
SAN DIEGO AREA SEWERAGE HISTORY 1976: After studies for proposed secondary treatment and determining that primary treatment was effective, San Diego pursued a waiver for secondary treatment. 1976: After studies for proposed secondary treatment and determining that primary treatment was effective, San Diego pursued a waiver for secondary treatment. 1984: Waiver application still in process. San Diego studies natural waste treatment and completes the “Accelerated Projects” which was an expansion and improvement of the wastewater system to compensate for increased growth. Otay Water District opens a new water reclamation plant. 1984: Waiver application still in process. San Diego studies natural waste treatment and completes the “Accelerated Projects” which was an expansion and improvement of the wastewater system to compensate for increased growth. Otay Water District opens a new water reclamation plant. 1988: Subsequent lawsuits by the State and EPA. 1988: Subsequent lawsuits by the State and EPA.

11
SAN DIEGO AREA SEWERAGE HISTORY 1995 : Court battle concluded. San Diego receives a waiver for secondary treatment. Point Loma will continue to treat sewage at the advanced primary level. Treated effluent is discharged 5 miles offshore in 350 feet below the surface. 1995 : Court battle concluded. San Diego receives a waiver for secondary treatment. Point Loma will continue to treat sewage at the advanced primary level. Treated effluent is discharged 5 miles offshore in 350 feet below the surface. 1998: Over 1 billion dollars in improvements to San Diego’s system completed. North City Reclamation Plant and Metro Biosolids Center put into operation. Point Loma Treatment Plant capacity increased to 240 MGD. 1998: Over 1 billion dollars in improvements to San Diego’s system completed. North City Reclamation Plant and Metro Biosolids Center put into operation. Point Loma Treatment Plant capacity increased to 240 MGD.

12
SAN DIEGO AREA SEWERAGE HISTORY 2002: South Bay Water Reclamation Plant put into operation. Canyon sewage spills plague city and secondary treatment waiver issue resurfaces causing concern. 2002: South Bay Water Reclamation Plant put into operation. Canyon sewage spills plague city and secondary treatment waiver issue resurfaces causing concern.

13
Tijuana River Watershed

14
Tijuana River

15
Imperial Beach

17
Sewage flow and pollution do not respect international borders Sewage flow and pollution do not respect international borders Border Issues

18
Mesa/canyon topography

23
Population Growth

24
INTERNATIONAL WASTEWATER TREATMENT PLANT INTERNATIONAL BOUNDARY AND WATER COMMISSION

25
South Bay Water Reclamation Plant 2411 Dairy Mart Road

26
Financing the San Diego Plant U.S. federal government $239 million U.S. federal government $239 million Mexico $16 million Mexico $16 million City of San Diego $88-$140 million City of San Diego $88-$140 million State of California $5.3 million State of California $5.3 million

Similar presentations


 Overview Dean Fisher, P.E., PMP, CCM July 25, 2013.>")
 Overview Jim Herberg, P.E., BCEE June 14, 2012.>")


 Overview Nick Kanetis, P.E. June 14, 2013.>")


