Download presentation
Presentation is loading. Please wait.

1
GRAPHING & BASIC TRIG REVIEW AUGUST 14 -15 2014

2
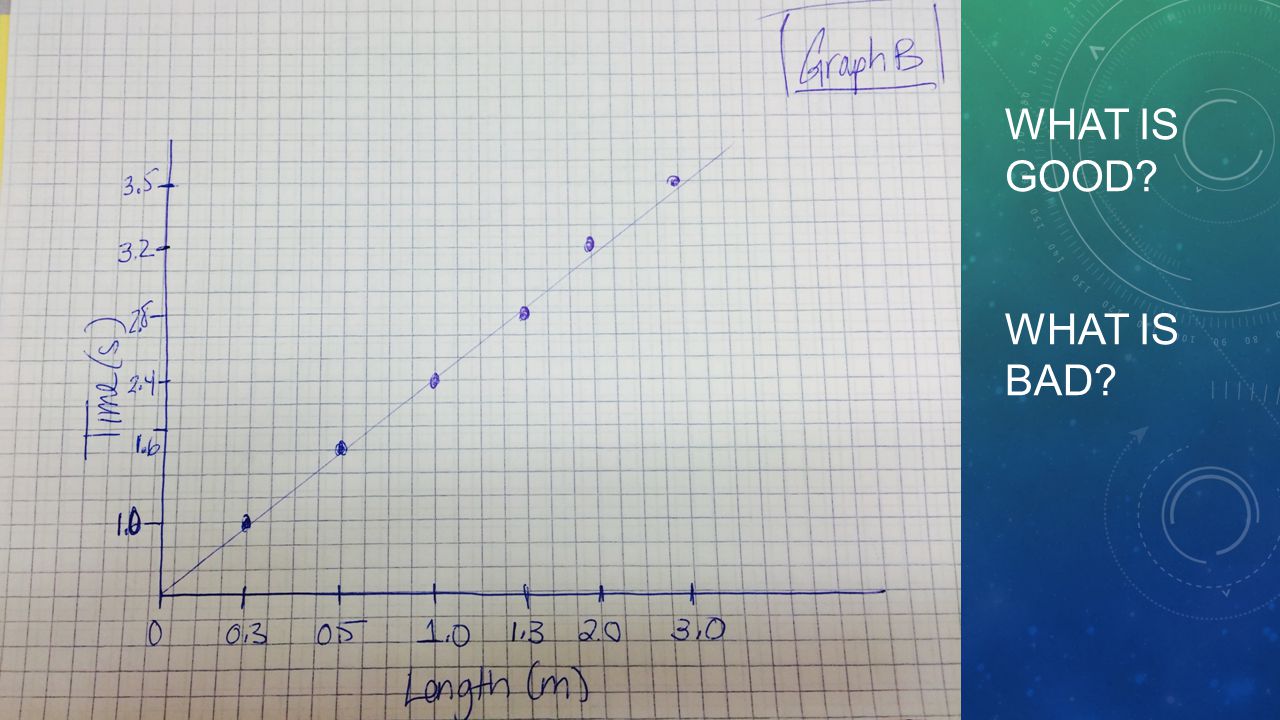
ANALYZING GRAPHS AND TABLES In groups of 2-3, examine a graph. Can you understand exactly what data is shown? Is there a clearer way to convey the same data? Try to find as many flaws with it as possible. Also identify the good aspects of the graph.

3
WHAT IS GOOD? WHAT IS BAD?

7
EXEMPLAR GRAPH Examine these graphs & try to develop a list of qualities that good graphs should have. Graph 1: Velocity as a function of body mass and method of locomotion. Each data point represents a different species. Linear best fit lines are shown. Graph 2: Voltage measurements across resistors with varying current. Each data point shows the average of 15 measurements. X error bars shows instrument uncertainty; Y error bars show the measurement uncertainty. A linear best fit line has been drawn.

8
EXEMPLAR TABLE Examine this table, and use it to try to identify characteristics of good tables.

9
CHARACTERISTICS OF GOOD GRAPHS & TABLES Graphs Descriptive title Descriptive axes names AND units Appropriate & EVEN scale to axes Legend which describes data, including things like sample size, meaning of data points, and meaning of error bars If multiple replicates are done, then average data points should be plotted and uncertainty should be graphed as error bars (more on this later!). DO NOT ‘connect the dots’. A best fit line may be appropriate. Only draw a best fit line through zero IF theory says it should. Tables Descriptive title Descriptive headings AND units Should give both RAW data and PROCESSED data (averages,uncertainty) Data should be recorded using appropriate sig figs.
 Data should be recorded using appropriate sig figs..")
Similar presentations


 List the three major kinematic equations 2) Define displacement, velocity and acceleration using complete sentences.>")


 Rubric IS the assessment statement.>")


