Download presentation
Presentation is loading. Please wait.

1
Cardiac Output and Venous Return

2
Learning objectives Define venous return. Understand the concept of “resistance to venous return” and know what factors determine its value. Understand the principles underlying cardiac output measurements using the Fick principle, dye dilution, and thermodilution methods. Know how cardiac function (output) curves are generated and how factors which cause changes in contractility in the heart can alter the shape of cardiac function curves.
 curves are generated and how factors which cause changes in contractility in the heart can alter the shape of cardiac function curves.")
3
Learning objectives Construct a vascular function curve. Predict how changes in total peripheral resistance, blood volume, and venous compliance influence this curve. Use the intersection point of the cardiac function curve and vascular function curve to predict how interventions such as hemorrhage, heart failure, autonomic stimulation, and exercise will affect cardiac output and right atrial pressure.

4
Cardiac output Amount of blood ejected by each ventricle per minute is called cardiac output (CO). Its value is almost same for both the ventricles & is about 5L/min. in a normal adult male Cardiac output = heart beat rate X stroke volume (stroke volume is amount of blood ejected/ventricle/beat or stroke = EDV-ESV) CO = 72/min X 70ml = 5 L/min (approx.)
. Its value is almost same for both the ventricles & is about 5L/min. in a normal adult male. Cardiac output = heart beat rate X stroke volume (stroke volume is amount of blood ejected/ventricle/beat or stroke = EDV-ESV) CO = 72/min X 70ml = 5 L/min (approx.)")
5
Cardiac index: CI is the cardiac output per square meter of body surface area. Normal value is about 3 L/min/m2 (2.6 to 4.2 L/min/m2 )
")
6
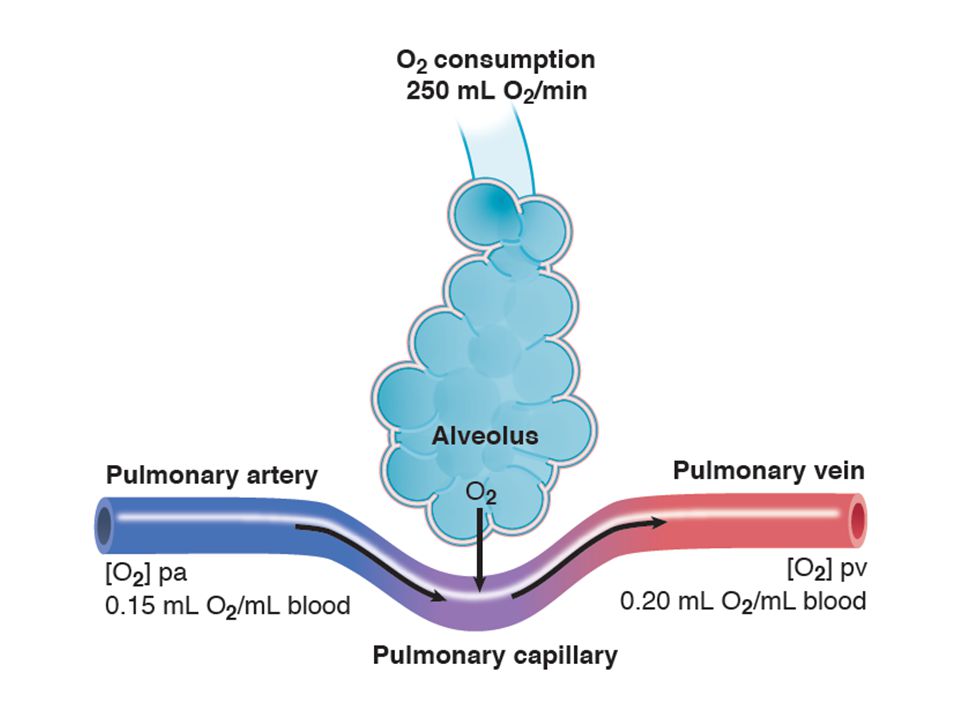
Measurement of Cardiac Output
Calculation of flow through the pulmonary circuit provides a measure of the CO. Required data are: oxygen consumption of the organ A – V oxygen content (concentration) difference across the organ (not PO2)
 difference across the organ (not PO2)")
9
In a test subject, oxygen consumption was measured at 700 mL/min
In a test subject, oxygen consumption was measured at 700 mL/min.Pulmonary artery oxygen content was 140 mL per liter of blood and brachial artery oxygen content was 210 mL per liter of blood. Cardiac out-put was which of the following? a. 4.2 L/min b. 7.0 L/min c L/min d L/min e L/min Answer- C

10
Regulation of cardiac output
Factors effecting

12
Regulation of Heart rate
Sympathetic & parasympathetic (vagus) nerves control the heart beat rate. A normal heart beat is maintained by slow continuous discharge from sympathetic nerves The vagal fibers are distributed mainly to atria than ventricles Without neuronal influences, SA node will drive heart at rate of its spontaneous activity Normally Symp & Parasymp activity influence HR (chronotropic effect) Mechanisms that affect HR: chronotropic effect Positive increases; negative decreases Autonomic innervation of SA node is main controller of HR Symp & Parasymp nerve fibers modify rate of spontaneous depolarization
 nerves control the heart beat rate. A normal heart beat is maintained by slow continuous discharge from sympathetic nerves. The vagal fibers are distributed mainly to atria than ventricles. Without neuronal influences, SA node will drive heart at rate of its spontaneous activity. Normally Symp & Parasymp activity influence HR (chronotropic effect) Mechanisms that affect HR: chronotropic effect. Positive increases; negative decreases. Autonomic innervation of SA node is main controller of HR. Symp & Parasymp nerve fibers modify rate of spontaneous depolarization.")
13
Regulation of Heart rate
Strong sympathetic stimulation can increase the heart rate from normal 70 beats / min. upto beats / min. Strong vagal stimulation bring down the rate to beats/min & also can decrease strength of heart muscle contraction by 20-30% .

14
14-8

15
Both divisions of the autonomic nervous system tonically influence the cardiac pacemaker, which is normally the sinoatrial (SA) node. The sympathetic system enhances automaticity, whereas the parasympathetic system inhibits it Parasympathetic tone usually predominates in healthy, resting individuals. When a resting individual is given atropine, a muscarinic receptor antagonist that blocks parasympathetic effects, the heart rate generally increases substantially. If a resting individual is given propranolol, a β-adrenergic receptor antagonist that blocks sympathetic effects, the heart rate usually decreases only slightly. When both divisions of the autonomic nervous system are blocked, the heart rate of young adults averages about 100 beats/min. The rate that prevails after complete autonomic blockade is called the intrinsic heart rate.

16
Cardiac output Stroke volume Afterload Cardiac index Preload
The output per minute per square meter of body surface is called Cardiac output Stroke volume Afterload Cardiac index Preload

17
Baroreceptor Reflex Baroreceptor Reflex Sudden changes in arterial blood pressure initiate a reflex that evokes an inverse change in heart rate Baroreceptors located in the aortic arch and carotid sinuses are responsible for this reflex. The inverse relationship between heart rate and arterial blood pressure is generally most pronounced over an intermediate range of arterial blood pressure. Below this intermediate range, the heart rate maintains a constant, high value; above this pressure range, the heart rate maintains a constant, low value

18
of changes in pressure in isolated carotid sinuses on neural activity in cardiac vagal and sympathetic efferent nerve fibers

19
Bainbridge Reflex, Atrial Receptors, and Atrial Natriuretic Peptide
Intravenous infusions of blood or electrolyte solutions tend to increase the heart rate via the Bainbridge reflex. Bainbridge reflex – stretched rt.atrium – vasomotor center – back to heart by sympathetic & vagi nerve – increase the heart rate Decrease the heart rate via the baroreceptor reflex. The actual change in heart rate induced by such infusions is the result of these two opposing effects.

20
Respiratory Sinus Arrhythmia
The heart rate typically accelerates during inspiration and decelerates during expiration . Stretch receptors in the lungs are stimulated during inspiration, and this action leads to a reflex increase in heart rate. The afferent and efferent limbs of this reflex are located in the vagus nerves. Intrathoracic pressure also decreases during inspiration and thereby increases venous return to the right side of the heart .The consequent stretch of the right atrium elicits the Bainbridge reflex. After the time delay required for the increased venous return to reach the left side of the heart, left ventricular output increases and raises arterial blood pressure. This rise in blood pressure in turn reduces the heart rate through the baroreceptor reflex

21
IN THE CLINIC A quadriplegic patient who could not breathe spontaneously and required tracheal intubation and artificial respiration. When the tracheal catheter was briefly disconnected to permit nursing care, profound bradycardia quickly developed. The patient's heart rate was 65 beats/min just before the tracheal catheter was disconnected. In less than 10 seconds after cessation of artificial respiration, his heart rate dropped to about 20 beats/min. WHY? This bradycardia could be prevented by blocking the effects of efferent vagal activity with atropine, and its onset could be delayed considerably by hyperventilating the patient before disconnecting the tracheal catheter

22
Chemoreceptor reflex The primary effect of stimulation of peripheral chemoreceptors on the heart rate is to excite the cardiac vagal center in the medulla and thus to decrease the heart rate. Peripheral chemoreceptor stimulation also excites the respiratory center in the medulla. This effect produces hypocapnia and increases lung inflation, both of which secondarily inhibit the medullary vagal center. Thus, these secondary influences attenuate the primary reflex effect of peripheral chemoreceptor stimulation on heart rate.

23
Determinants of Cardiac Output
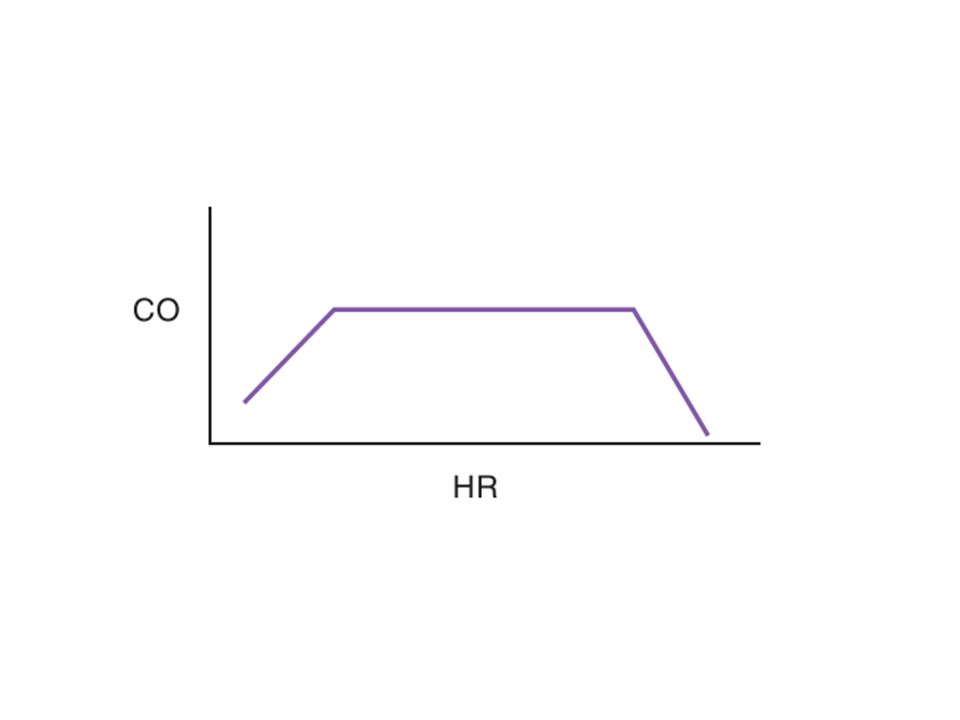
Venous parameters, not arterial parameters, normally determine cardiac output. Heart rate does not normally affect cardiac output but very low and very high heart rates impede venous return and cardiac output. Increased resistance of arteries raises blood pressure but does not affect venous return and cardiac output. For instance, aortic stenosis, coarc-tion of the aorta, and hypertension do not decrease cardiac output if the heart if able to pump against the increased afterload.

26
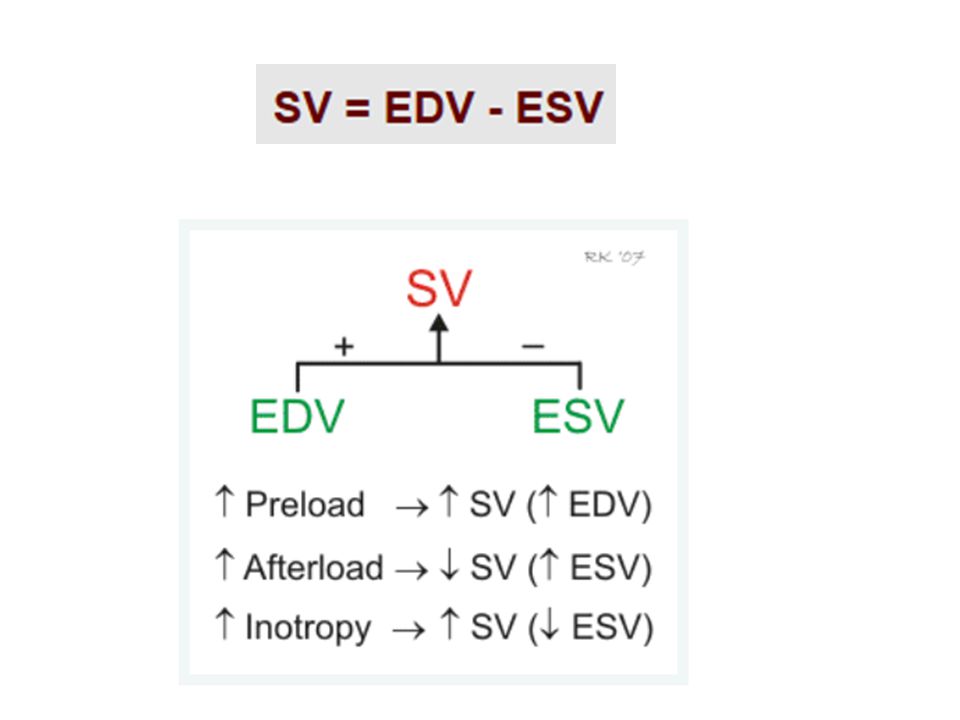
Stroke Volume Is determined by 3 variables:
Preload/End diastolic volume (EDV) = volume of blood in ventricles at end of diastole Afterload/Total peripheral resistance (TPR) = impedance to blood flow in arteries Contractility/Inotropy = strength of ventricular contraction 14-9
 = volume of blood in ventricles at end of diastole. Afterload/Total peripheral resistance (TPR) = impedance to blood flow in arteries. Contractility/Inotropy = strength of ventricular contraction")
27
Regulation of Stroke Volume
EDV is workload (preload) on heart prior to contraction SV is directly proportional to preload & contractility Total peripheral resistance = afterload which impedes ejection from ventricle SV is inversely proportional to TPR SV is directly proportional to Contractility. Ejection fraction is SV/ EDV (~80ml/130ml=62%) Normally is 60%; useful clinical diagnostic tool
 on heart prior to contraction. SV is directly proportional to preload & contractility. Total peripheral resistance = afterload which impedes ejection from ventricle. SV is inversely proportional to TPR. SV is directly proportional to Contractility. Ejection fraction is SV/ EDV (~80ml/130ml=62%) Normally is 60%; useful clinical diagnostic tool.")
29
Regulation of stroke volume
Preload :Passive tension in the muscle when it is being filled during diastole. End diastolic volume Venous return Frank-Starling’s law (Energy of contraction is proportional to the initial length of cardiac muscle fibres) Ejection fraction EF=(SV/EDV) X 100%
 Ejection fraction EF=(SV/EDV) X 100%")
30
Preload General features
Preload is the load on the muscle in the relaxed state. More specifically, it is the load or prestretch on ventricular muscle at the end of diastole. Preload on ventricular muscle is not measured directly; rather, indices are utilized.

31
Indices of left ventricular preload:
Left ventricular end-diastolic volume (LVEDV) Left ventricular end-diastolic pressure (LVEDP) somewhat less reliable indices of left ventricular preload are those measured in the venous system. Left atrial pressure Pulmonary venous pressure Pulmonary wedge pressure Measurement of systemic central venous pressure is an index of preload on the right ventricle
 Left ventricular end-diastolic pressure (LVEDP) somewhat less reliable indices of left ventricular preload are those measured in the venous system. Left atrial pressure. Pulmonary venous pressure. Pulmonary wedge pressure. Measurement of systemic central venous pressure is an index of preload on the right ventricle.")
32
Pulmonary wedge pressure, sometimes called pulmonary capillary wedge pressure, is measured from the tip of a Swan-Ganz catheter, which, after passing through the right heart, has been wedged in a small pulmonary artery. The tip is pointing downstream toward the pulmonary capillaries, and the pressure measured at the tip is probably very close to pulmonary capillary pressure. Since the vessel is occluded on inflating the balloon and assuming minimal flow, the pressure is probably very close to left atrial pressure as well. A rise in pulmonary capillary wedge pressure is evidence of an increase in preload on the left ventricle. In some cases, such as in mitral stenosis, it is not a good index of left ventricular preload.

33
Question time again- In skeletal muscle the resting muscle length is approximately the optimal length at which maximal tension can be developed during a subsequent contraction- A)True B)False.
True. B)False.")
34
Frank-Starling Law of the Heart
(a) is state of myocardial sarcomeres just before filling Actins overlap, actin-myosin interactions are reduced & contraction would be weak In (b, c & d) there is increasing interaction of actin & myosin allowing more force to be developed Stroke volume is the amount of blood pumped by each ventricle during systole. Unlike the resting length of skeletal muscle where a sarcomere length is close to the optimum for maximal cross-bridge linking between actin and myosin during contraction (Lo), heart muscle at the end of diastole is below this point. Thus, in a normal heart, increased preload increases sarcomere length toward the optimum actin-myosin overlap. This results in more cross-linking and a more forceful contraction during systole
 is state of myocardial sarcomeres just before filling. Actins overlap, actin-myosin interactions are reduced & contraction would be weak. In (b, c & d) there is increasing interaction of actin & myosin allowing more force to be developed. Stroke volume is the amount of blood pumped by each ventricle during systole. Unlike the resting length of skeletal muscle where a sarcomere length is close to the optimum for maximal cross-bridge linking between actin and myosin during contraction (Lo), heart muscle at the end of diastole is below this point. Thus, in a normal heart, increased preload increases sarcomere length toward the optimum actin-myosin overlap. This results in more cross-linking and a more forceful contraction during systole.")
35
The Frank–Starling law of the heart states that the stroke volume of the heart increases in response to an increase in the volume of blood filling the heart (the end diastolic volume) when all other factors remain constant. Important in Balancing left and right ventricular Cardiac output.

36
Fig. -. Frank-Starling Law of the heart
Fig. -. Frank-Starling Law of the heart. The graph illustrates the relationship between SV and changes in ventricular end-diastolic volume. The insets showing diagrammatic sarcomeres, illustrate the relationship between end-diastolic volume and myofilament overlap.

37
Optimal Length Length-force relationships in intact heart:
a Frank-Starling curve Optimal Length Figure 14-28

38
Factors affecting end-diastolic volume, e. g
Factors affecting end-diastolic volume, e.g. the degree to which cardiac muscle is stretched Increase Stronger atrial contraction Increased total blood volume Increased venous tone Increased pumping action of skeletal muscle Increased negative intrathoracic pressure Decrease Standing Increased intrapericardial pressure(Cardiac tamponade) Decreased ventricular compliance
 Decreased ventricular compliance.")
39
Pathological conditions such as ventricular systolic failure and valve defects such as aortic stenosis, aortic regurgitation (pulmonary valve stenosis and regurgitation have similar effects on right ventricular preload).
.")
41
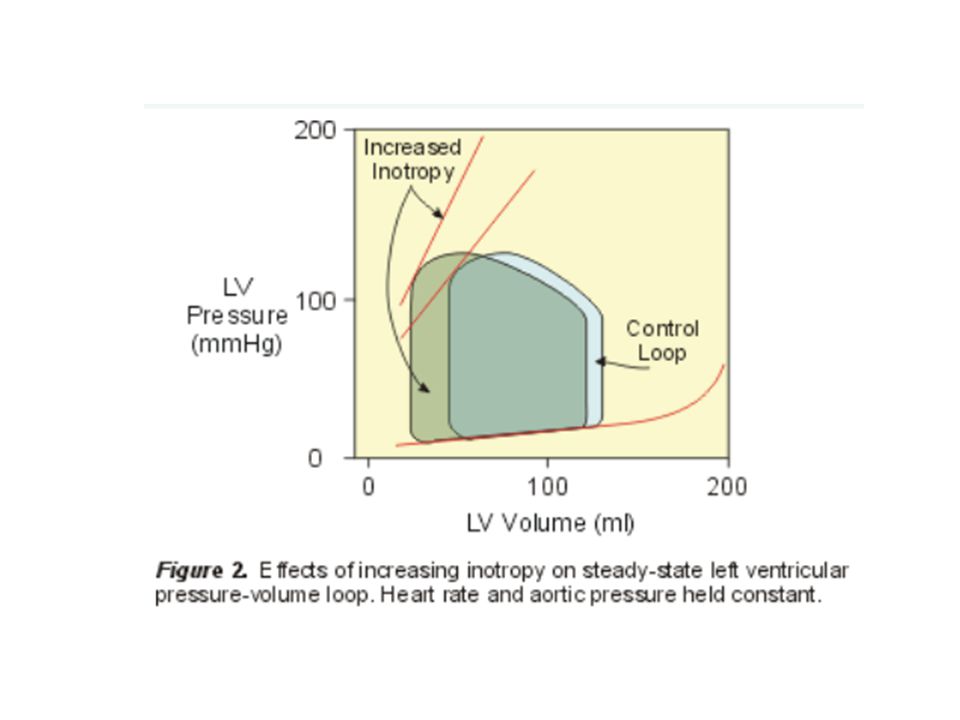
B. Extrinsic Regulation of Stroke Volume
Any changes in the strength of cardiac contraction that occur independently of changes in EDV are referred to as changes in myocardial contractility A change in myocardial contractility (Inotropism) is mechanistically different from the altered vigor of contraction seen with changes in muscle length Changes in contractility are direct result of changes in the rate and extent of Ca2+ movement into the cytoplasm Increased firing of cardiac sympathetic nerve results in in both the rate (chronotropic action) and extent (inotropic action) of myocardial contractions
 is mechanistically different from the altered vigor of contraction seen with changes in muscle length. Changes in contractility are direct result of changes in the rate and extent of Ca2+ movement into the cytoplasm. Increased firing of cardiac sympathetic nerve results in in both the rate (chronotropic action) and extent (inotropic action) of myocardial contractions.")
42
Relationship between contractility and intracellular Ca2+ : contractility is a result of cytoplasmic Ca2+ concentration. This is the result of both release of Ca2+ from the sarcoplasmic reticulum and influx of Ca2+ from the extracellular space. Increased Ca2+ results in activation of additional crossbridges (indicated in red)
.")
43
sympathetic Fig. 14. Effect of changes in myocardial contractility on the Frank-Starling curve. The curve shifts downward and to the right as contractility is decreased. The major factors influencing contractility are summarized on the right (dashed lines indicate portions of the curve where maximum contractility has been exceeded). W.Ganong. Review of Medical Physiology
. W.Ganong. Review of Medical Physiology.")
45
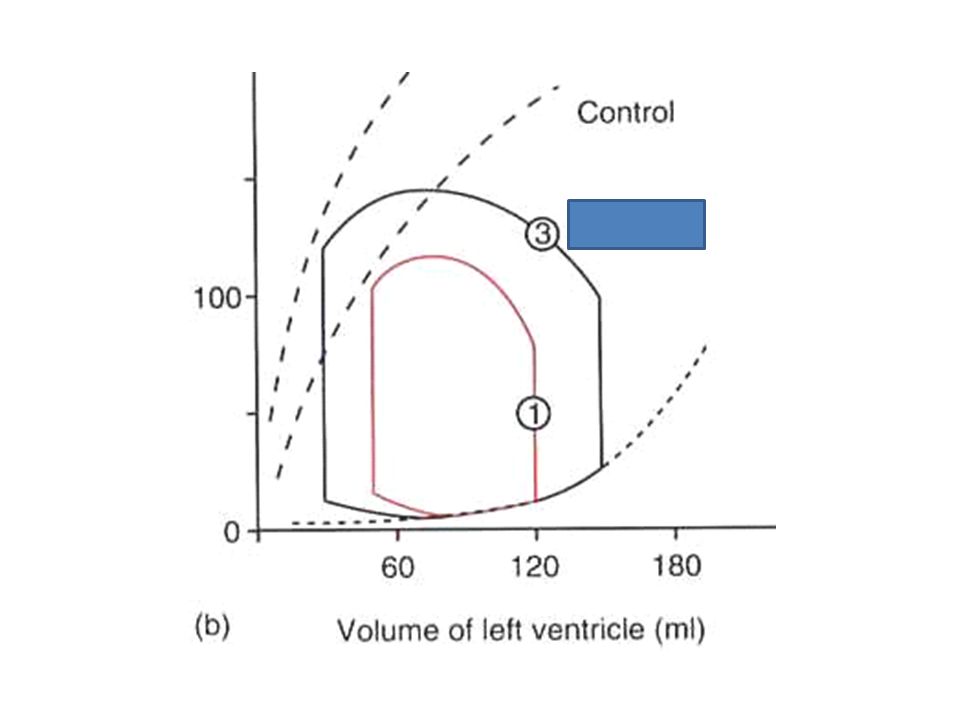
Fig. . Changes in SV due to changes in contractility are mechanistically different from those occurring as a result of EDV. The two mechanisms can operate simultaneously to SV (lower panel). EDV = end- diastolic volume; ESV = end-systolic volume; SV = stroke volume (Human Physiology)
. EDV = end- diastolic volume; ESV = end-systolic volume; SV = stroke volume (Human Physiology).")
46
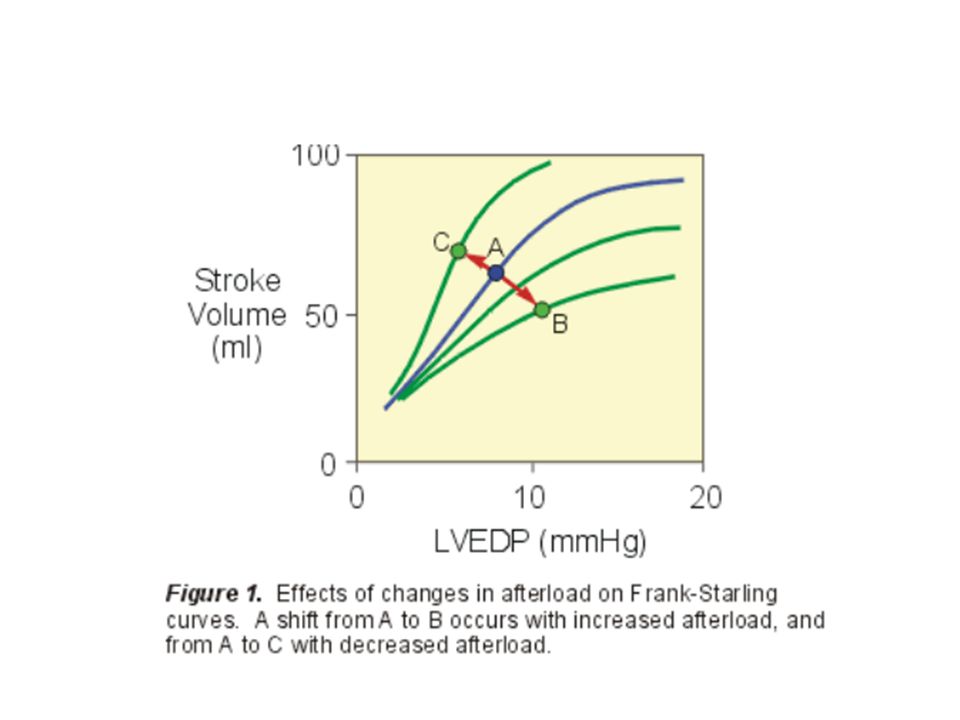
Afterload and Cardiac Performance
Presentation Information Afterload and Cardiac Performance Afterload: all the factors that impede fiber shortening, in this case it would be all the factors that impede the ejection of blood from the ventricle. What the heart has to pump against Volume of blood in the arterial circulation Pressure in aorta at onset of ejection (DAP) Compliance of aorta Size of outflow orifice CONFIDENTIAL
 Compliance of aorta. Size of outflow orifice. CONFIDENTIAL.")
47
Factors that affect stroke volume.

50
Myocardial Hypertrophy
Presentation Information Myocardial Hypertrophy Concentric Cross sectional area of a muscle increases when repeatedly exposed to an elevated work load over a sustained period of time In cardiac muscle this can be the result of increased wall tension caused by increased preload or increased after load . eccentric CONFIDENTIAL

51
Changes in the radius of the ventricles (curvature of the ventricle) can affect ventricular pressure (Laplace’s Law) and efficiency of the heart as a pump The pressure generated in a sphere is directly proportional to the wall tension (T) developed, and inversely related to the radius of the sphere (r) (Law of Laplace) P = 2T/r In normal conditions, during ejection phase of cardiac cycle the volume of blood in the V falls, and the r of the V decreases. As the radius falls, the tension in the V walls is more effective in ventricular pressure In chronic cardiac failure the contractility is reduced and the heart becomes less effective as a pump and dilates radius of the ventricles and reduces its curvature, and ejection gets more difficult as it proceeds As related to the heart, this law means that the amount of pressure generated in the ventricle is directly proportional to the tension (force) developed in the ventricular muscle. The greater the force generated by the ventricles, the greater the tension in the walls and the greater the pressure of the blood inside. However, when the radius of the ventricle chamber is large, the amount of tension developed is less and so the pressure developed in the ventricle is less. So, as the heart becomes more and more dilated the ventricles are not so effective in converting tension into ventricular pressure which reduces the efficiency of the heart as a pump. Conversely, the smaller the radius, the less tension is needed to raise the ventricular pressure. Ventricular distension has advantages and disadvantages The Laplace effect and Frank-Starling mechanism act in opposition. Distension of the ventricle raises its contractile force through the Frank-Starling mechanism but reduces the pressure generated by a given force through Laplace’s Law. In a healthy heart, the gain in contractile energy by the Starling mechanism greatly outweighs the Laplace effect. In moderate to severe heart failure, the cardiac distension has stretched the myocardial fibres so much that the heart is on the plateau of the Starling curve. Laplace’s Law and Heart Failure The failing heart is often grossly dilated which means that its radius is enlarged. Conversion of tension into ventricular pressure then is adversely affected. Laplace’s law states that to reach the normal ventricular systolic pressure, the heart has to contract with a greater force i.e. it has to exert a greater contractile tension and it needs more oxygen. Such a heart is less efficient as a pump. An important therapeutic goal in heart failure is to reduce cardiac distension and this is achieved by diuretics which lower the cardiac filling pressure.
 developed, and inversely related to the radius of the sphere (r) (Law of Laplace) P = 2T/r. In normal conditions, during ejection phase of cardiac cycle the volume of blood in the V falls, and the r of the V decreases. As the radius falls, the tension in the V walls is more effective in ventricular pressure. In chronic cardiac failure the contractility is reduced and the heart becomes less effective as a pump and dilates radius of the ventricles and reduces its curvature, and ejection gets more difficult as it proceeds. As related to the heart, this law means that the amount of pressure generated in the ventricle is directly proportional to the tension (force) developed in the ventricular muscle. The greater the force generated by the ventricles, the greater the tension in the walls and the greater the pressure of the blood inside. However, when the radius of the ventricle chamber is large, the amount of tension developed is less and so the pressure developed in the ventricle is less. So, as the heart becomes more and more dilated the ventricles are not so effective in converting tension into ventricular pressure which reduces the efficiency of the heart as a pump. Conversely, the smaller the radius, the less tension is needed to raise the ventricular pressure. Ventricular distension has advantages and disadvantages. The Laplace effect and Frank-Starling mechanism act in opposition. Distension of the ventricle raises its contractile force through the Frank-Starling mechanism but reduces the pressure generated by a given force through Laplace’s Law. In a healthy heart, the gain in contractile energy by the Starling mechanism greatly outweighs the Laplace effect. In moderate to severe heart failure, the cardiac distension has stretched the myocardial fibres so much that the heart is on the plateau of the Starling curve. Laplace’s Law and Heart Failure. The failing heart is often grossly dilated which means that its radius is enlarged. Conversion of tension into ventricular pressure then is adversely affected. Laplace’s law states that to reach the normal ventricular systolic pressure, the heart has to contract with a greater force i.e. it has to exert a greater contractile tension and it needs more oxygen. Such a heart is less efficient as a pump. An important therapeutic goal in heart failure is to reduce cardiac distension and this is achieved by diuretics which lower the cardiac filling pressure.")
52
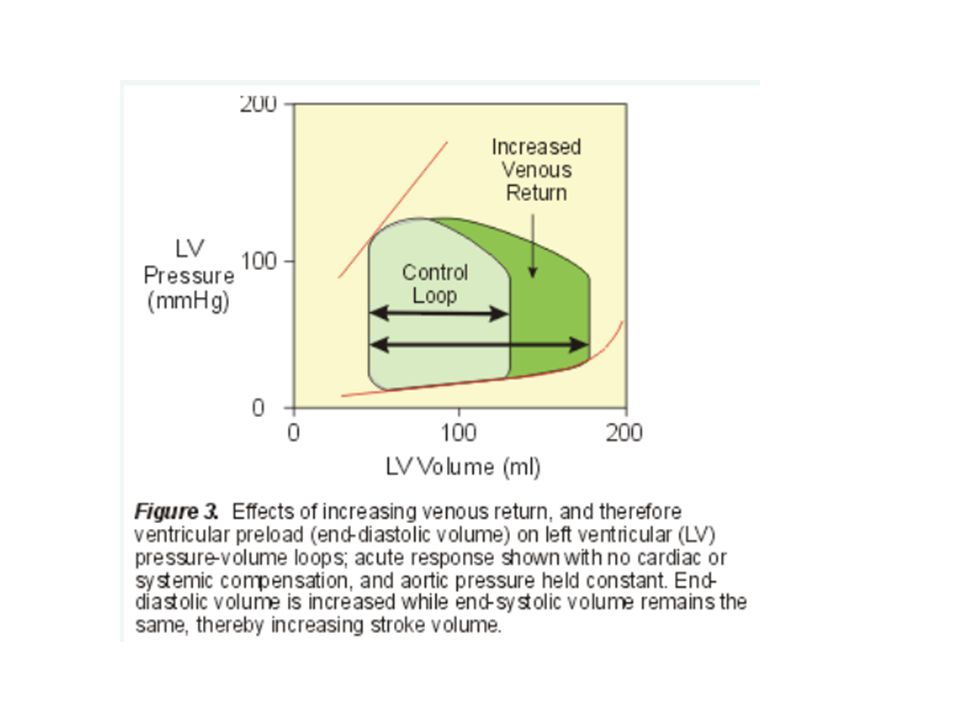
Increased Preload Normal P-V loop Increased Afterload Increased Contractility

54
The figure below shows pressure volume loops for two situations
The figure below shows pressure volume loops for two situations. When compared with loop A, loop B demonstrates (A) Increased preload (B) Decreased preload (C) Increased contractility (D) Increased afterload (E) Decreased afterload
 Increased preload. (B) Decreased preload. (C) Increased contractility. (D) Increased afterload. (E) Decreased afterload.")
56
Which of the following would cause a decrease in stroke volume, compared with the normal resting value? (A) Reduction in afterload (B) An increase in end-diastolic pressure (C) Stimulation of the vagus nerves (D) Electrical pacing to a heart rate of 200 beats/min (E) Stimulation of sympathetic nerves to the heart
 Reduction in afterload. (B) An increase in end-diastolic pressure. (C) Stimulation of the vagus nerves. (D) Electrical pacing to a heart rate of 200 beats/min. (E) Stimulation of sympathetic nerves to the heart.")
57
Point Y in the figure below is the control point. Which point
corresponds to a combination of increased contractility and increased ventricular filling? (A) Point A (B) Point B (C) Point C (D) Point D (E) Point E
 Point A. (B) Point B. (C) Point C. (D) Point D. (E) Point E.")
58
Summary of the regulation of Cardiac Output
The Cardiac output is the volume of blood pumped by each ventricle and equals the product of heart rate and stroke volume Heart rate is by stimulation of the sympathetic nerves to the heart (NE) and by epinephrine (E); it is by stimulation of the parasympathetic nerves to the heart Stroke volume is increased mainly by an in end-diastolic volume (the Frank-Starling mechanism) and by an in contractility due to sympathetic-nerve stimulation or to epinephrine. Afterload can also play a significant role in certain situations
 and by epinephrine (E); it is by stimulation of the parasympathetic nerves to the heart. Stroke volume is increased mainly by an in end-diastolic volume (the Frank-Starling mechanism) and by an in contractility due to sympathetic-nerve stimulation or to epinephrine. Afterload can also play a significant role in certain situations.")
59
Swollen legs A 47 year old woman was brought to the hospital because of severe shortness of breath and swelling of her lower body. Over the last year *she had noticed periods of shortness of breath while doing her housework (exertional dyspnea). She also had shortness of breath while lying down (orthopnea). The patient often awoke at night with a sensation of not getting enough air and she had to sit or stand to obtain relief (paroxysmal nocturnal dyspnea). #More recently she noticed swelling first of her lower extremities and then of her lower abdomen. The swelling was worse through the day and decreased overnight. She reported awakening three to four times a night to urinate. The patient did not remember any ill health before these problems began. Physical examination revealed a woman sitting up in bed in mild to moderate respiratory distress. Her blood pressure was 100/70, pulse was 120 and weak. Respirations were 26 per minute and labored. There was jugular venous distension, even while she was sitting. Palpation of the sternum revealed a restrosternal lift. Auscultation of the heart revealed an opening snap and a long diastolic rumble at the apex. Auscultation of the lungs revealed crackles halfway up the lungs. There was also severe lower extremity edema. During her hospitalization, as part the work-up, the following studies were done.
. She also had shortness of breath while lying down (orthopnea). The patient often awoke at night with a sensation of not getting enough air and she had to sit or stand to obtain relief (paroxysmal nocturnal dyspnea). #More recently she noticed swelling first of her lower extremities and then of her lower abdomen. The swelling was. worse through the day and decreased overnight. She reported awakening three to four times a night to urinate. The patient did not remember any ill health before these problems began. Physical examination revealed a woman sitting up in bed in mild to moderate respiratory distress. Her blood pressure was 100/70, pulse was 120 and weak. Respirations were 26 per minute and labored. There was jugular venous distension, even while she was sitting. Palpation of the sternum revealed a restrosternal lift. Auscultation of the heart revealed an opening snap and a long diastolic rumble at the apex. Auscultation of the lungs revealed crackles halfway up the lungs. There was also severe lower extremity edema. During her hospitalization, as part the work-up, the following studies were done.")
60
Arterial-venous O2 content difference 5.3 ml/dl blood
Patient Normal O2 consumption(VO2) 188 ml/min mL/min Arterial-venous O2 content difference 5.3 ml/dl blood ml/dl blood Heart rate 122 beats/min Mean Pulmonary Capillary Wedge Pressure 25 mm Hg <15 mmHg Right Ventricular Systolic pressure End-Diastolic pressure 80 mm Hg 16 mm Hg <28mmHg <8mmHg Right Ventricular End Diastolic volume 140 ml/m2 60-88mL/m2 Use the data in the table above to calculate cardiac output and ejection fraction · Evaluate the mean electrical axis of the heart using the ECG shown overleaf
 188 ml/min mL/min. Arterial-venous O2 content difference. 5.3 ml/dl blood ml/dl blood. Heart rate beats/min. Mean Pulmonary Capillary Wedge Pressure. 25 mm Hg. <15 mmHg. Right Ventricular Systolic pressure. End-Diastolic pressure. 80 mm Hg. 16 mm Hg. <28mmHg. <8mmHg. Right Ventricular End Diastolic volume. 140 ml/m mL/m2. Use the data in the table above to calculate cardiac output and ejection fraction. · Evaluate the mean electrical axis of the heart using the ECG shown overleaf.")
Similar presentations


: Amount of blood pumped by each ventricle per minute. Stroke volume (SV):>")


