Download presentation
Presentation is loading. Please wait.

1
BIOMARKER DAN BIOINDIKATOR
BAHAN KULIAH ANALISIS PENCEMARAN

2
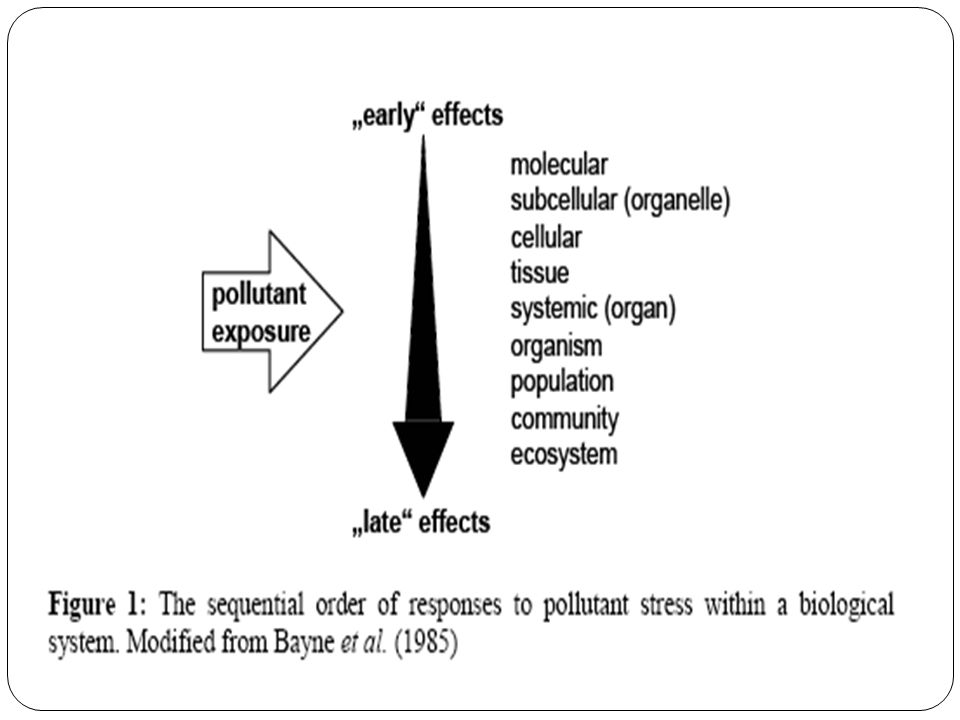
1.Monitoring Monitoring must take into consideration the type or types of contaminants present (biological and chemical), their availability and the possibility of biomagnification and bioaccumulation. The environmental monitoring must be able to detect with accuracy and consistency pollutants present at very low levels.
, their availability and the possibility of biomagnification and bioaccumulation. The environmental monitoring must be able to detect with accuracy and consistency pollutants present at very low levels.")
3
2.Biomarkers, Test organisms and Bioindicators,
The effects of pollutants on whole organisms representative of the environment, known as bioindicators. The effects of pollutants on physiological, biochemical, and molecular characteristics of organisms in the environment, known as biomarkers. The effect of the pollutant on test organisms in the laboratory.

4
Bioindicators and biomarkers have the advantage that they measure the action of the pollutants in the real and complex environment where there may be many and complex interactions at sublethal levels. 4

5
BioMarker Definition:
Biomarker is a substance used as an indicator of a biologic state Existence of living organisms or biological process. A particular disease state A fragment of DNA sequence Proteins Nucleic acids Carbohydrate Lipids Small molecules

6
Biomarkers Location of the biomarker: Tissue or organ locations
Location of a particular molecule can also be a marker Cellular-subcellular locations Tissue or organ locations Thymidylate synthase (TS) nucleus vs the cytoplasm The higher the level in NE, lower level in the cyto. Lower survival in colorectal cancer patients Galectin-3 Galectin-3 is a member of lectin family. It is wildly distributed In tissue of epithelial, fibroblast, and dendritic cells. Blood Galectin-3 Predict the outcomes for patients with symptoms of heart failure
 nucleus vs the cytoplasm. The higher the level in NE, lower level in the cyto. Lower survival in colorectal cancer patients. Galectin-3. Galectin-3 is a member of lectin family. It is wildly distributed. In tissue of epithelial, fibroblast, and dendritic cells. Blood Galectin-3. Predict the outcomes for patients with symptoms of heart failure.")
7
Biomarker Detection of biomarker Detection of biomarker – diagnosis
Self properties, e.g enzymatic activities Antibodies, IHC, ELISA Detection of biomarker Quantitative a link between quantity of the marker and disease Qualitative a link between exist of a marker and disease

8
Biomarker & Diagnosis Ideal Marker for diagnosis
Should have great sensitivity, specificity, and accuracy in reflecting total disease burden. A tumor marker should also be prognostic of outcome and predictive of tumor recurrence and effectiveness of anti-cancer treatments. Biomarker for Screening The marker must be highly specific, minimize false positive and negative The marker must be able to clearly reflect the early stage of disease The marker must be easily detected without complicated medical procedures. The disease markers released to serum and urine are good targets for application of early screening. The method for screening should be cost effective. Samples for biomarker detection Blood, urine, or other body fluids samples Tissue samples

12
A.BIOMARKERS Biomarkers can be defined as quantitative measures of changes in the biological system in response to pollutant exposure. Biomarkers can be placed into three groups; biochemical, immunochemical, and genetic.

14
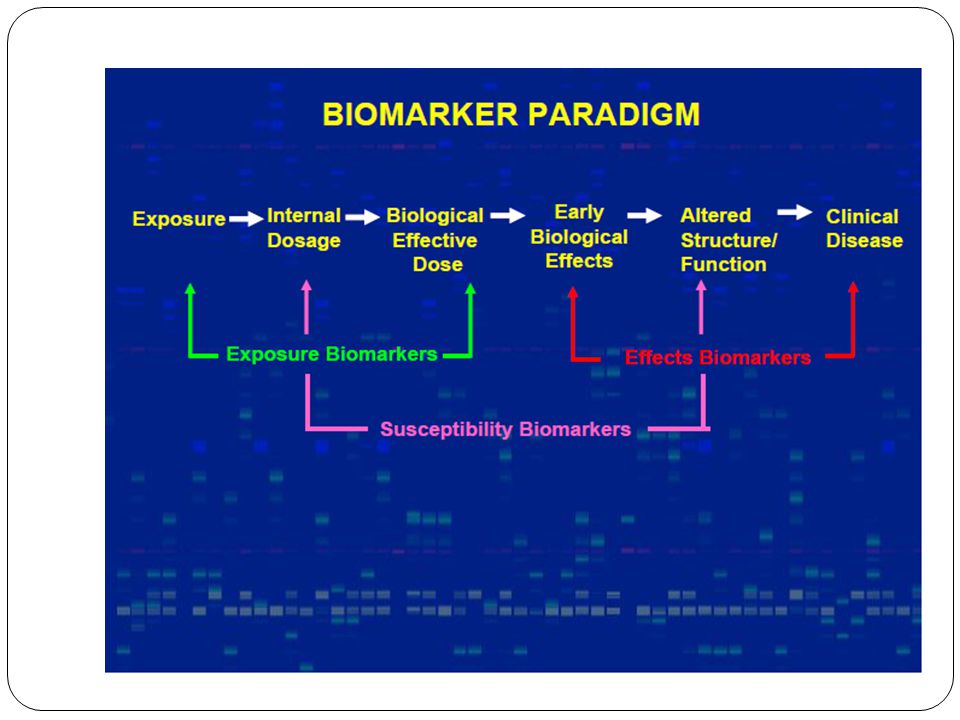
Use of Biomarkers in Epidemiology and Clinical Medicine
Traditional Exposure Disease Biological or Molecular Epidemiology Markers of Exposure Biomarkers of Disease Exposure dose biological effect Altered clinical prognosis structure/ diagnosis function

15
Predictive Biomarkers for Lung Cancer
Current Status / Perspectives: Although curative resection of patients with early-stage lung CA are performed, the risk of relapse remains substantial Indicates that there may be micro-invasion/metastasis have not been detected by general imaging and/or pathological examinations Predictive biomarkers will allow the selection of lung cancer patients who may need more aggressive screening and treatment

16
2.1.Biochemical biomarkers
Based on the ability of the pollutant to generate a response at the gene level, inducing or increasing specific enzymes involved with detoxification of contaminants. The detoxification of xenobiotics often involves one of three detoxification strategies: - cytochrome P450, - conjugation with glutathione and -chelation by proteins (Metallothioneines).
.")
17
*EROD, ethoxyresorufin-o-dethylase. ^AHH, aryl hydrocarbon hydroxylase.
*GSH, glutathione.polyaromatic hydrocarbon.

18
2.2.Immunochemical biomarkers
The specific reaction between antigens and antibodies can be used to determine the presence of xenobiotics in environmental samples. Antibodies against PCBs (polychlorinated biphenyls), PCDDs (polychlorinated dibenzo-p-dioxins), and PCDFs (polychlorinated dibenzofurans) have been developed and used in an ELISA system to determine PCBs in samples (Hahn, 2002).
, PCDDs (polychlorinated dibenzo-p-dioxins), and PCDFs (polychlorinated dibenzofurans) have been developed and used in an ELISA system to determine PCBs in samples (Hahn, 2002).")
19
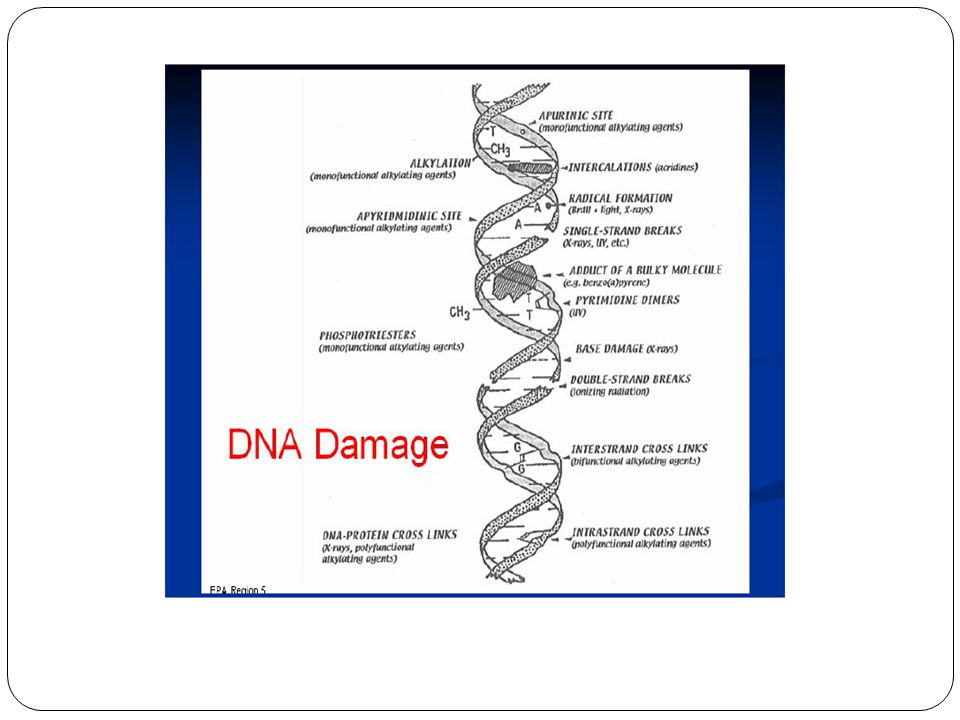
2.3.Genetic biomarkers Ames test
The Ames test was developed to test substances for their ability to produce mutations in bacteria. The test consists of the treatment of a Salmonella typhimurium histidine auxotroph (His-). The test compound is added to the Salmonella typhimurium His- in an extract of rat liver. If the compound is a mutagen then mutations will cause revertants- colonies will form on a medium lacking histidine. The number of colonies will give a measure of the mutagenic potential.
. The test compound is added to the Salmonella typhimurium His- in an extract of rat liver. If the compound is a mutagen then mutations will cause revertants- colonies will form on a medium lacking histidine. The number of colonies will give a measure of the mutagenic potential.")
21
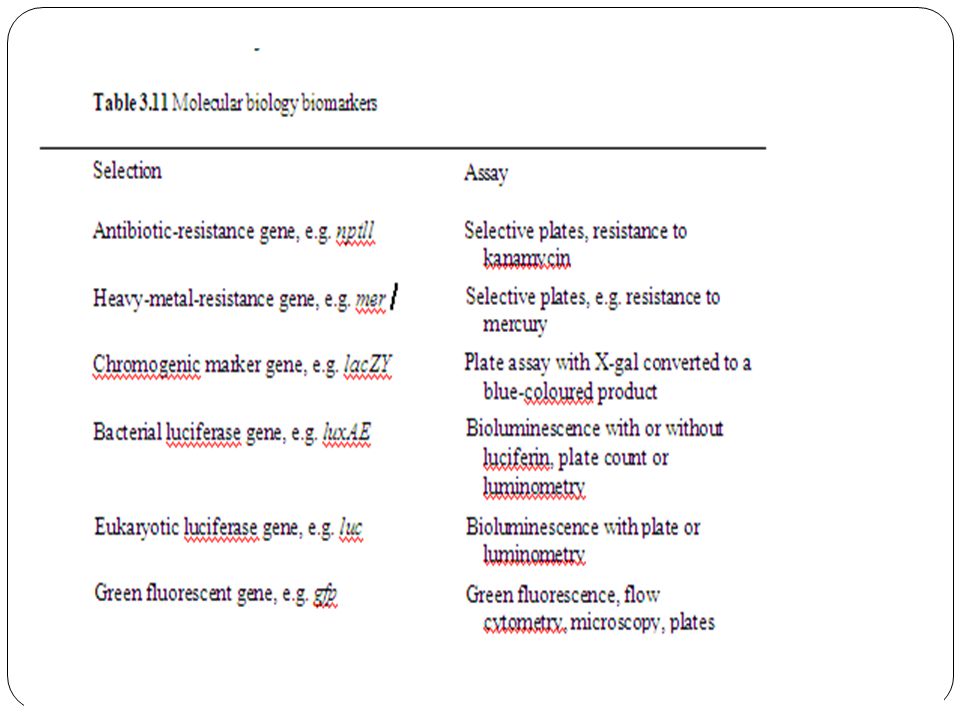
2.4.Molecular biology biomarkers
Another development using genetic manipulation of biological material for the estimation of toxicity has been the generation of a transgenic strain of the nematode Caenorhabditis elegans . The lacZ gene from E. coli is fused to the hsp16 gene. When the nematode is stressed the enzyme is induced in the worm. The enzyme can be detected by the addition of a substrate such as o-nitrophenyl-p-galactopyranoside (ONPG), which will produce a blue colour when cleaved by the enzyme.
, which will produce a blue colour when cleaved by the enzyme.")
23
2.5.Fish and Endocrine Disruptors/ Modulators
Fish are good indicators for the aquatic environment Fish health and fish populations Commercially and recreationally-important species Ecologically important species Indicators of effects on aquatic ecosystem and ultimately human health

24
2.5.1.Endocrine Modulators Synthetic or naturally-occurring chemicals that modify or disrupt normal hormonal functions Alterations in synthesis and metabolism Improper balance or quantity of circulating hormones Directly or indirectly interact with natural hormones Change hormone message and alter cell activity Induce creation of extra receptor sites Amplify the hormone effect on cell activity Block binding sites Impair normal cell activity Bind to receptors (hormone mimics) Abnormal, unpredictable cell activity
 Abnormal, unpredictable cell activity.")
25
2.5.2.Endocrine Disruption Reproductive Thyroid
Adrenal (Interrenal, chromaffin) Neuroendocrine Immune system/disease resistance Cortisol Estrogens/androgens
 Neuroendocrine. Immune system/disease resistance. Cortisol. Estrogens/androgens.")
26
Common Serum Markers for Cancer Diagnosis/prognosis
AFP CEA CA15-3 CA19-9 CA125 PSA PSAf PAP hTG HCGb Ferr NSE B2M A2M Lung x Pancreas Kidney Breast Ovarian Cervical Uterine Prostate Liver Gastro Colon Bladder Brain Leukemia Myeloma Thyroid Testicular

27
Prostate Cancer marker PSA
PSA is a protein normally made in the prostate gland in ductal cells that make some of the semen. PSA helps to keep the semen liquid. PSA, also known as kallikrein III, seminin, semenogelase, γ-seminoprotein and P-30 antigen, is a glycoprotein, a serine protease PSA has several forms in serum Free Pre-enzyme Complex Inactive

28
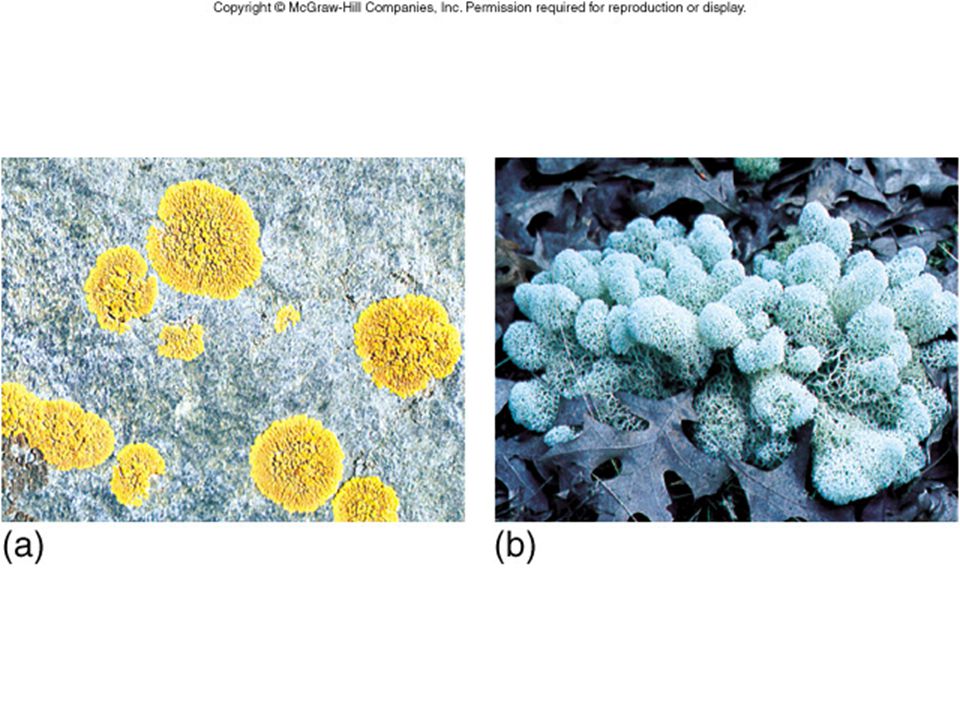
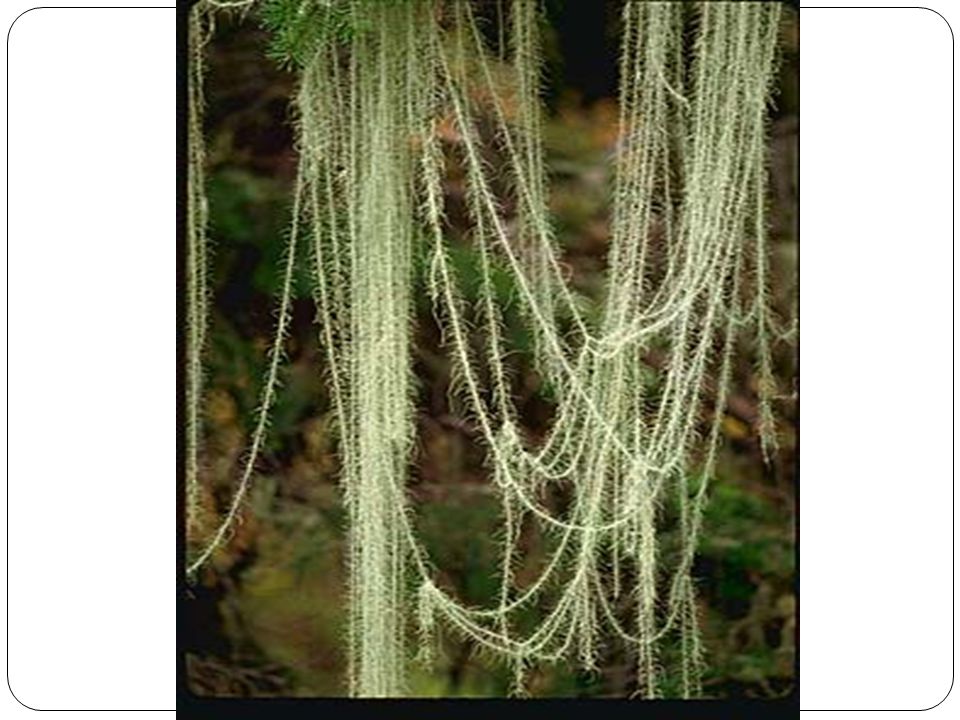
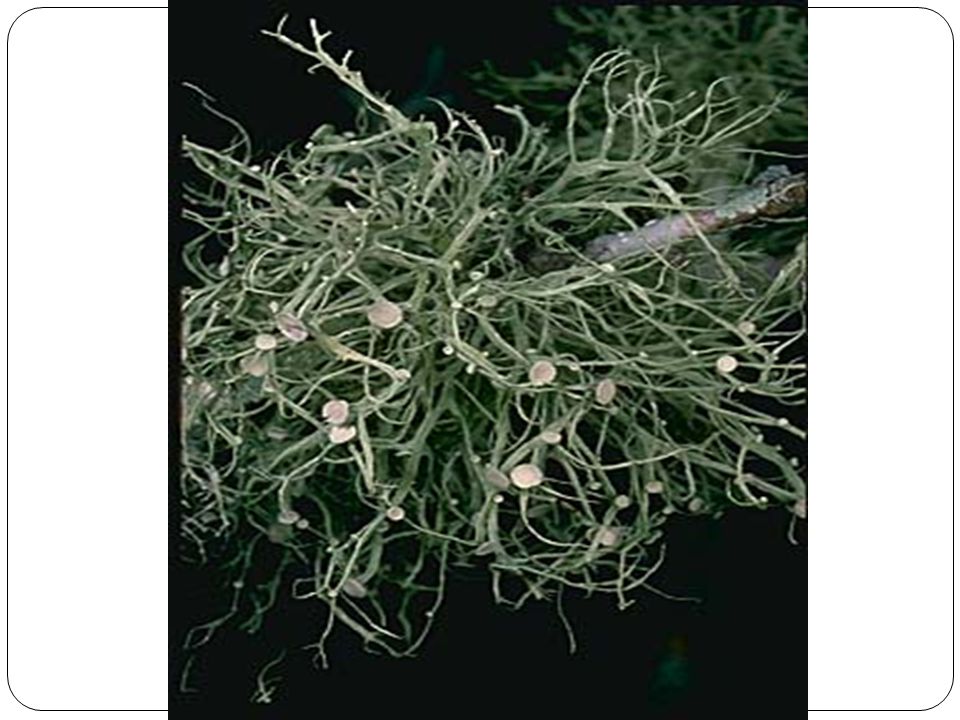
B.BIOINDICATORS Bioindicator organisms are those that can be used to identify and quantify the effects of pollutants on the environment. Lichens are a symbiotic relationship between an alga and fungus and are particularly sensitive to air pollutants and have been used widely used as bioindicators of air quality (Conti and Cecchetti, 2001) Honey bees have been used as a bioindicator for the contamination of the atmosphere by heavy metals (cadmium, chromium, and lead). The filter-feeding mussels are known to accumulate heavy metals, making them ideal for the monitoring of coastal waters eg. Mediterranean mussel Myttlus galloprovincialis (Regioli and Principato, 1995). Frogs, fish eggs as a measure of water quality
 Honey bees have been used as a bioindicator for the contamination of the atmosphere by heavy metals (cadmium, chromium, and lead). The filter-feeding mussels are known to accumulate heavy metals, making them ideal for the monitoring of coastal waters eg. Mediterranean mussel Myttlus galloprovincialis (Regioli and Principato, 1995). Frogs, fish eggs as a measure of water quality.")
29
Bioindikator adalah kelompok atau komunitas organisme yang keberadaannya atau perilakunya di alam berhubungan dengan kondisi lingkungan Apabila terjadi perubahan kualitas air maka akan berpengaruh terhadap keberadaaan dan perilaku organisme tersebut, sehingga dapat digunakan sebagai penunjuk kualitas lingkungan.

33
Lichens

34
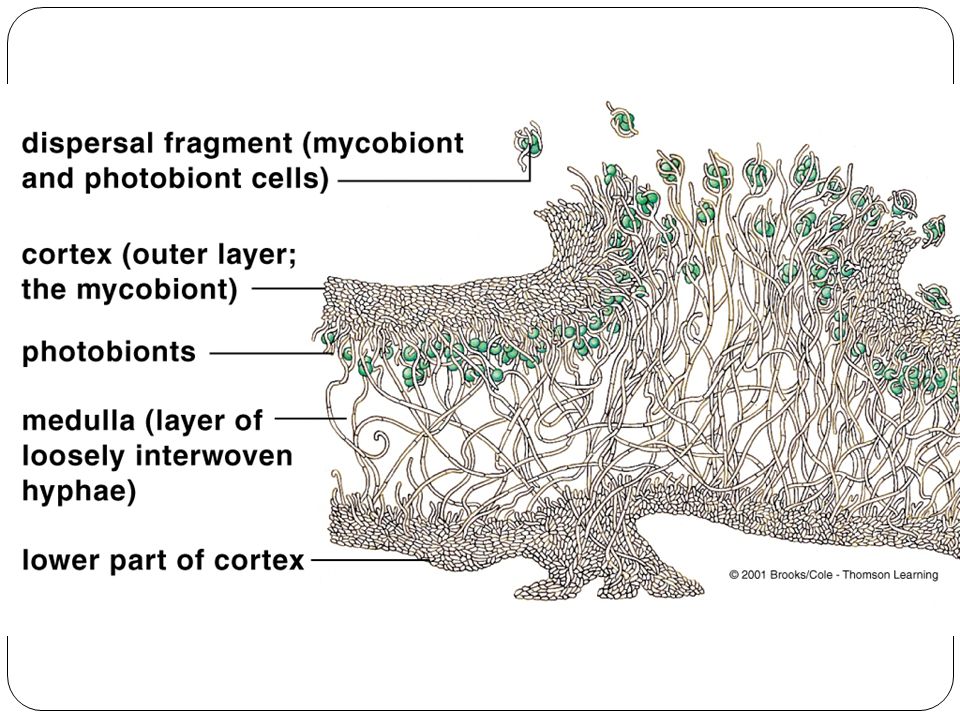
Characteristics Associated Organism
Thallus (Mass of Hyphae Grasping Algae) Symbiotic Relationship Lichenized Pioneers in New Environments Long Lifespan (9000 Years Old)
 Symbiotic Relationship. Lichenized. Pioneers in New Environments. Long Lifespan (9000 Years Old)")
39
Closely Attached to Substrate
Crustose (Crusty) Flat Edges Unlobed Closely Attached to Substrate
 Flat Edges. Unlobed. Closely Attached to Substrate.")
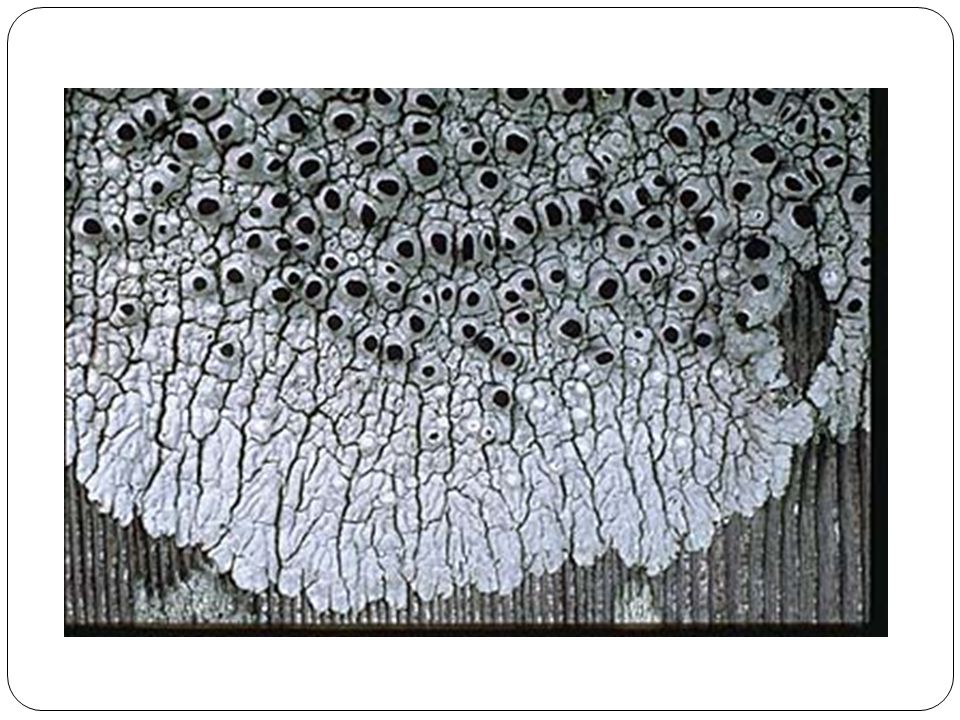
42
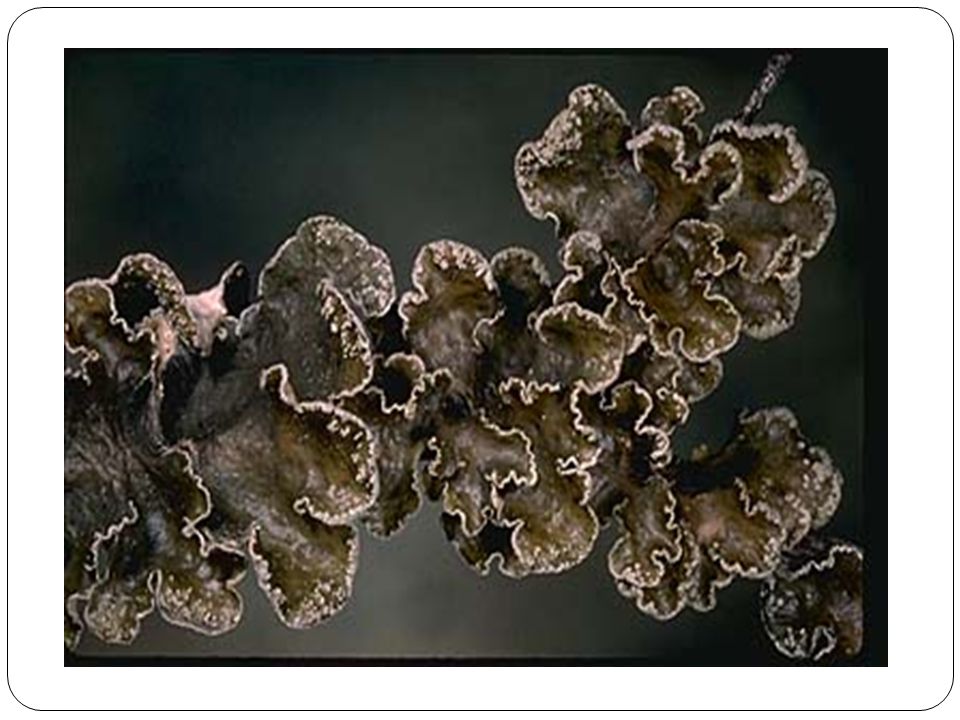
Foliose (Leafy) Sandwich of Fungal Layer with Algal Mat in Middle
Circular Growth Lobes Rootlets Called Rhizines

43
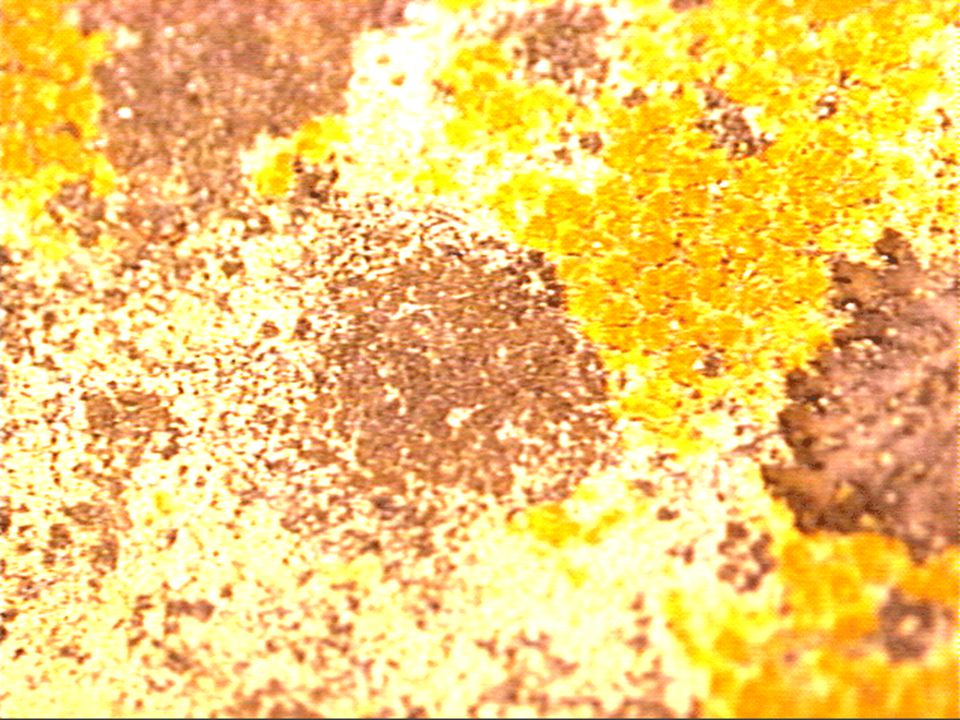
Foliose Lichen

46
Fructicose (Shrubby) Round Branches Vertical Growth Pattern Globets
Threads Shrub-like or Mounded Beard-like

50
Powdery Masses with Little or No Organized Structure
Leprose (Powdery) Powdery Masses with Little or No Organized Structure
 Powdery Masses with Little or No Organized Structure.")
52
Squamulose Similar to Crustose, but with Raised Edges which can be Folded or Lobe-Like.

53
An Early Bioindicator – A Canary in a Mine

54
British Lichen Bioindicator Sulfur Dioxide Toxic Elemental Pollutants
Air Pollution Sulfur Dioxide Toxic Elemental Pollutants Radioactive Metals Heavy Metals Ozone

55
Loss of 1/3 of Lichens Due to Sulfur Dioxide Emissions
England and Wales Loss of 1/3 of Lichens Due to Sulfur Dioxide Emissions

56
Alaska

57
Air Pollution Leads to Acid Rain
First Loss -- Birches and Conifers Next on -- Oaks and Sycamores Finally -- Elm

58
Wolf Lichen

59
"Wolf lichen" (Letharia vulpina) was the most widely used dye lichen for native peoples in North America The Apache painted wolf-lichen crosses on their feet so they could pass their enemies unseen. Tribes (the Gitksan) in British Columbia associated the lichen Lobaria pulmonaria with frogs and used it in a spring bathing ritual to bring health and long life.
 in British Columbia associated the lichen Lobaria pulmonaria with frogs and used it in a spring bathing ritual to bring health and long life.")
60
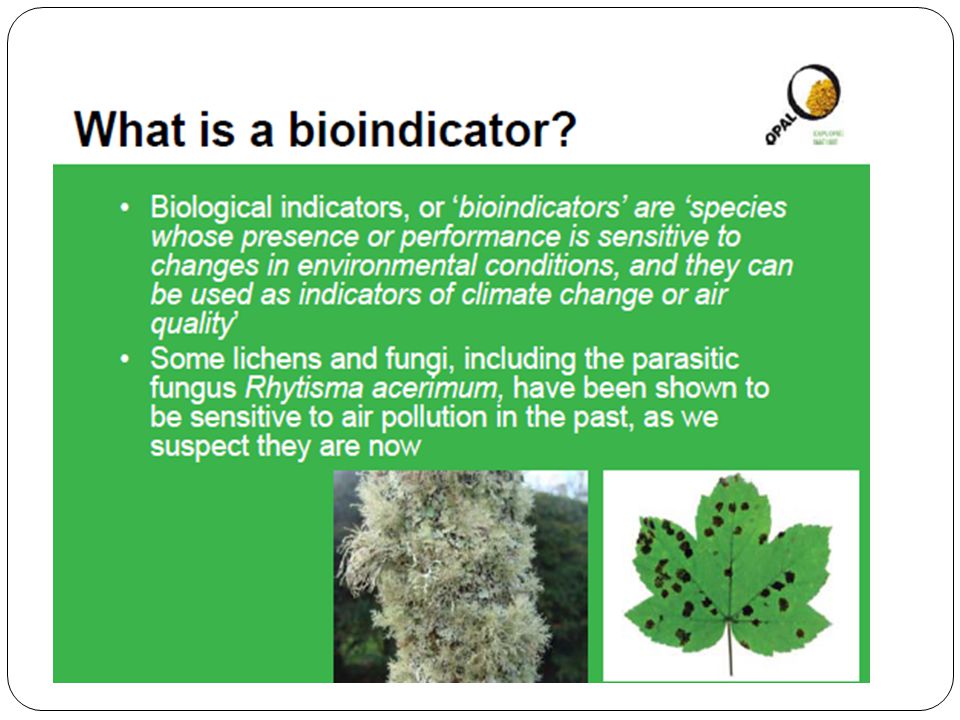
What are indicator species?
Some species can alert us to harmful changes that are taking place in biological communities (Miller,,Living in the Environment: p. 147) A famous example is the canaries that coal miners took down into the mine shafts in the 1800’s and early 1900’s. We call these bioindicators. They can tell us about the overall health of an ecosystem.
 A famous example is the canaries that coal miners took down into the mine shafts in the 1800’s and early 1900’s. We call these bioindicators. They can tell us about the overall health of an ecosystem.")
61
We will be studying species that act as bioindicators of stream quality.
works/cranefly.html Insect larvae that develop in streams are valuable bioindicators. An example is the Dameselfly. The presence of Damselfly adults (left) and larvae (right) indicate moderately clean water. They are somewhat sensitive to pollution and so water they are found in will be of good to fair quality. Why are we concerned about the quality of stream water, anyway?
 and larvae (right) indicate moderately clean water. They are somewhat sensitive to pollution and so water they are found in will be of good to fair quality. Why are we concerned about the quality of stream water, anyway")
62
Jenis Bioindikator Planktonkton Bentos
merupakan organisme perairan yang keberadaannya dapat dijadikan indikator perubahan kualitas biologi perairan sungai. Plankton memegang peran penting dalam mempengaruhi produktifitas primer perairan sungai. Bentos merupakanindikator biologis dalam mempelajari ekosistem sungai . Hal ini disebabkan adanya respon yang berbeda terhadap suatu bahan pencemar yang masuk dalam perairan sungai dan bersifat immobile

63
What do we mean when we say ‘healthy stream’?
Plenty of Oxygen 02 Oxygen for cellular respiration -----> energy A source of nutrition; use this to review food webs: note bioindicators in this web! A place to reproduce: clean,unsilted gravel; siltation also affects temp. and thus oxygen content A healthy food web Habitat for reproduction

64
Bioindikator Ideal Mudah dalam identifikasi taksonomi
Terdistribusi secara luas Jumlah banyak Karakter ekologinya diketahui Variabitas ekologi dan genetiknya rendah

65
BIOINDICATION IN AQUATIC ECOSYSTEMS

66
Biological Methods to Assess Water Quality
Physiological methods = experimental - ecological methods Ecological methods = descriptive - analytic field methods

67
Physiological Methods = Biotests
Activity of particular metabolic features of the sample Effect of the sample on the bioactivity of exposed organism

68
Ecological Methods = Bioindication
Community of organism reflects the situation of the ecosystem Single Taxa have specific optima and tolerance ranges for selected environmental factor = Bioindicators

69
Index of Saprobity

70
Category Organic Pollution Saprobity SI I No polution Oligosaprobic
1,0 to <1,5 I-II Few polution Oligo to beta-mesosaprobic 1,5 to <1,8 II Moderate polution Beta mesosprobic 1,8 to <2,3 II-III Critical polution Beta to Alpha-mesosaprobic 2,3 to <2,7 III High Polution Alpha-mesosaprobic 2,7 to 3,2 III-IV Very high polution Alpha-mesosaprobic to polysaprobic 3,2 to < 3,5 IV Extremly high p Polysaprobic 3,5 to 4,0

71
We can study populations of Macroinvertebrates as bioindicators of the health and oxygenation of a stream. Macro means large enough to see with your eyes. Invertebrate means animals without backbones. 95% of all animals are invertebrates! Examples: insect larvae, crayfish, worms, adult aquatic insects

72
Why do these macroinvertebrates make good bioindicators of stream and watershed health?
•live in the water for all or most of their life •stay in areas suitable for their survival •are easy to collect •differ in their tolerance to amount and types of pollution •are easy to identify in a laboratory •often live for more than one year •have limited mobility

73
Bioindicators are grouped according to their tolerance of pollution/water quality.
Dragonfly larvae tolerate some pollution. 1. Caddisfly larvae are intolerant of pollution. This uses the Four Taxa Groups from IS handout Leeches and blood midge larvae are very tolerant of pollution & michellemahood/image/

74
These are Bioindicators which are Pollution Intolerant
These are Bioindicators which are Pollution Intolerant. Their presence tells you that the water quality is excellent. We will use the dichotomous key to identify some of these! images from pathfinderscience.net unless otherwise cited Top left: Mayfly nymph All of these are pollution intolerant species. They require 4 ppm O2 Top middlet: Caddisfly larvae Top right: riffle beetle (adult) and larvae Bottom left: Stonefly larvae Bottom right: Dobsonfly larvae
 and larvae. Bottom left: Stonefly larvae. Bottom right: Dobsonfly larvae.")
75
Periphyton Many methods have been developed to collect periphyton from natural substrates. All involve quanitatively removing material from a known surface area. Different methods may be needed to collect periphyton from rocks, woody debris, aquatic macrophytes, or other substrates. Substrate size will also determine how samples are collected. Large boulders require the use of a device that prevents the sample from being lost downstream. If the substrate is a fist-sized cobble the rock can be paced in a pan, scraped, then washed into a bottle with stream water.

76
Periphyton as indicators
Periphyton are used as indicators of environmental condition because they respond rapidly and are sensitive to a number of anthropogenic disturbances, including: habitat degradation nutrient enrichment metals herbicides hydrocarbons acidification

77
Periphyton Biomass Measurements
Ash-Free Dry Weight Pigment Analysis Biovolume Measurement Ash-Free Dry Mass -This is a gravimetric approach that involves filtering the sample on to a pre-dried, pre-weighed filter then drying the sample to a constant weight. The sample is then ashed or oxidized in a muffle furnace and percent organic matter is determined by difference. One of the major drawbacks to this method is that it measures the mass of all of the organic material including detritus, bacteria, insects, as well as periphyton. Pigment Analysis – This method involves extracting the chlorophyll from the algal cells. This method allows the differentiation of algal biomass from other organic constituents in the sample. The main disadvantage to this method is that the amount of chlorophyll within an algal cell is specific to its physiological state and ambient light conditions. The method also requires either a spectrophotometer or fluorometer. Biovolume Measurement- This method determines the biovolume of individual algal cells. It is very time consuming and requires knowledge of algal taxonomy.

78
Periphyton – Sampling methods
One way to scrape a known area is to lay a plastic 35 mm slide (film removed) over the rock and scrape off the material within the slide area scrub area = 2.3cmX3.5cm=8cm2
 over the rock and scrape off the material within the slide area. scrub area = 2.3cmX3.5cm=8cm2.")
79
Periphyton – Sampling methods
Rocks don’t always look like they have much on them Nearly all the stuff scrubbed off this one was organic matter –most of it living algae S.Loeb and J.Reuter images Notes: A tooth brush head was glued to the plunger of a 60 mL polypropylene syringe to make a device that can be used to scrub and then collect material from a standard circle of area. A reasonably flat portion of the rock is needed. A rubber stopper is used to contain the material if collected underwater. The one above, developed by Dr. Stanford Loeb at the U. of California-Davis’s Tahoe Research Group in the late 1970’s fabricated an extra syringe attached to the main one to allow Scuba divers to draw in over a 100 mL of lake water to ensure that all the material is collected. The samplers can be used underwater or on the shoreline of lakes or streams. At Tahoe they were used to sample periphyton to depths of about 30 meters and to sample algae incubated with carbon and nitrogen isotopes to estimate rates of algal assimilation in situ (meaning in place at the actual depth where the rocks were located).
.")
80
periphyton – in situ sampling
Material from a rock scrub contains macro and micro invertebrates, detritus, fungi, bacteria, as well as algae Recall that this entire community is also called “aufwuchs” (pronounced owf-wooks)
")
81
Periphyton – III. Preservation methods
Lugols’s iodine can used if the algae of interest are soft bodied forms (i.e. blue-greens and green algae). If interested only in diatoms, it may be best to preserve in 70% ethanol. Freeze sediment samples if they are to be analyzed for surficial chlorophyll. Notes on diatoms: the method used to identify diatoms in periphyton samples involves an acid digestion of the sample which removes all organic matter. Diatoms cell walls are glass (called frustules) and species identification entails viewing the fine holes (punctae) and lines (striae) within the frustules. This cannot be done easily if the cell contents are still intact.
. If interested only in diatoms, it may be best to preserve in 70% ethanol. Freeze sediment samples if they are to be analyzed for surficial chlorophyll. Notes on diatoms: the method used to identify diatoms in periphyton samples involves an acid digestion of the sample which removes all organic matter. Diatoms cell walls are glass (called frustules) and species identification entails viewing the fine holes (punctae) and lines (striae) within the frustules. This cannot be done easily if the cell contents are still intact.")
82
Periphyton – sample prep
This involves filtering a known volume of the periphyton suspension. Remember that this volume is arbitrary and what really matters is the weight that was collected from a known area of substrate. Here’s a portion of the previous sample after being deposited on a glass fiber filter in preparation for chlorophyll extraction or AFDW determination.

83
Periphyton – pigment analysis
Chlorophyll extraction: Tear filter into several pieces Place in a test tube Add 10 mLs of 90% acetone Extract overnight at 4oC Chlorophyll analysis After hr extraction, centrifuge to settle filter debris Read absorbance or fluorescence of the supernatant The glass fiber filters, if left suspended in the extract, will contribute to increased turbidity in the sample which can reduce the chlorophyll signal. To clarify the sample, centrifuge for 20 minutes at 4000 rpm. Cap the tubes to prevent evaporation of the acetone during the extraction and analysis. Details in chlorophyll method (PDF). Sometimes periphyton samples contain blue-green or green algal filaments. Often the chlorophyll within these filaments will not extract completely without physical disruption. This can be done using a tissue grinder but care must be taken not to overheat the sample (remember that heat degrades chlorophyll). Place the filter in the grinder, then place the grinder into a beaker filled with crushed ice. An alternative is to use an ultrasonic disrupter or sonicator. Alternative solvents and solvent mixtures have been shown to better for some groups of algae (such as hot methanol for blue-greens). However, 90% acetone extracted overnight at 4 oC or ground and analyzed after a 0.5 to 1.0 hr extraction are considered “standard methods”.
. Sometimes periphyton samples contain blue-green or green algal filaments. Often the chlorophyll within these filaments will not extract completely without physical disruption. This can be done using a tissue grinder but care must be taken not to overheat the sample (remember that heat degrades chlorophyll). Place the filter in the grinder, then place the grinder into a beaker filled with crushed ice. An alternative is to use an ultrasonic disrupter or sonicator. Alternative solvents and solvent mixtures have been shown to better for some groups of algae (such as hot methanol for blue-greens). However, 90% acetone extracted overnight at 4 oC or ground and analyzed after a 0.5 to 1.0 hr extraction are considered standard methods .")
84
Periphyton – biomass estimation
Wet weight Dry weight (dried at 103–105 oC) Ash free dry weight (AFDW) Loss on ignition (LOI) Combust at oC Chlorophyll (extract as per phytoplankton) Particulate organic carbon and/or nitrogen (POC or PON) Muffle furnace Remember that this measurement does not distinguish between detritus, algae, fungi, bugs or bacteria. Methods closely follow those used for water column algae. Note that for the organic matter estimation, it is the material that is burned off that is the organic matter. The residue is inorganic “ash”.
 Ash free dry weight (AFDW) Loss on ignition (LOI) Combust at oC. Chlorophyll (extract as per phytoplankton) Particulate organic carbon and/or nitrogen (POC or PON) Muffle furnace. Remember that this measurement does not distinguish between detritus, algae, fungi, bugs or bacteria. Methods closely follow those used for water column algae. Note that for the organic matter estimation, it is the material that is burned off that is the organic matter. The residue is inorganic ash .")
85
Periphyton – biomass calculations
Once you have a measure of chlorophyll or AFDW you’ll need to calculate per unit area. Note: You have to be careful to record the various volumes of solvents and dilution factors and what % of the original sample was used for the different analyses. For water samples it’s easy – just note the volume analyzed. For periphyton and sediment, there was a total amount of sample collected for a given surface area. A portion, by weight, was used for each analysis.

86
Fish

87
Fish: index of biotic integrity
Fish Keys: Fish Identification System Fishes of Minnesota

88
Fish Fish and other aquatic vertebrates can indicate stream quality
Extensive life history information is available for many species, Because many fish are high order consumers, they often reflect the responses of the entire trophic structure to environmental stress Fish provide a more publicly understandable indicator of environmental degradation Fish generally have long life histories and integrate pollution effects over longer time periods and large spatial scales Text adapted from: USEPA: A National Program for Monitoring Stream Condition in the Western United States American Fisheries Society Education Section

89
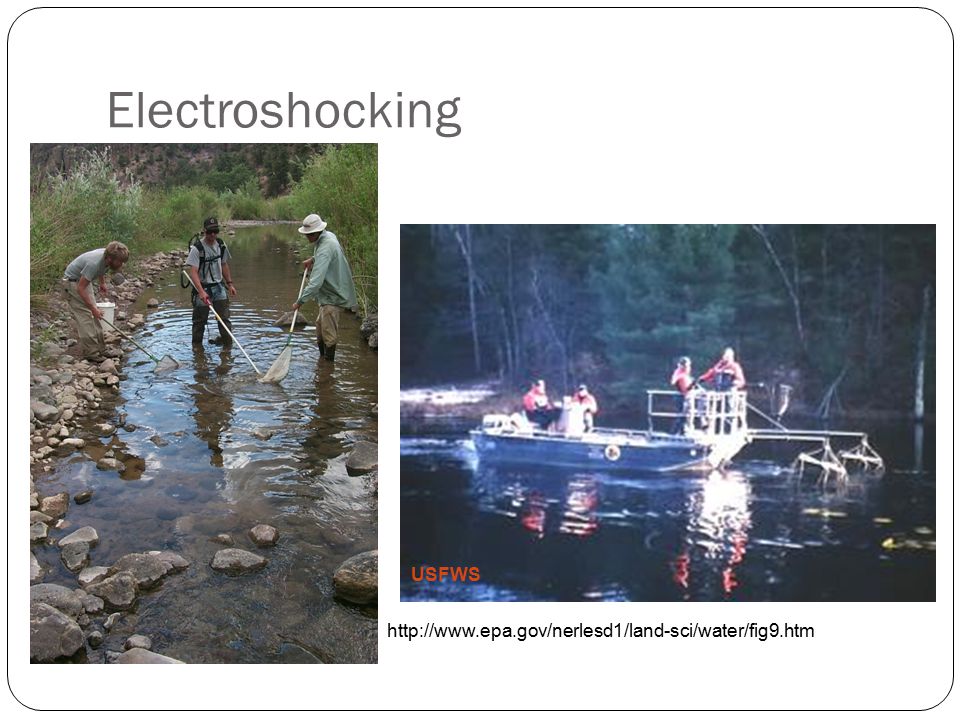
Fish Varieties Collection Methods Seines Electroshocking Backpack
Barge or boat

90
Electroshocking USFWS
91
Major groups of fish Petromyzontidae - lampreys
Acipenseridae – sturgeons Amiidae – bowfin Cyprinidae – minnows, dace, chubs, carp Catostomidae – suckers Ictaluridae – bullheads, catfish, madtoms Esocidae – pike Umbridae – mudminnows Umbridae – salmon, trout, whitefish Gasterosteidae – sticklebacks Cottidae – sculpins Moronidae – white perch, white bass Centrarchidae – bass, sunfish Centrarchidae – darters, perch, walleye There are so many more. See: Fishes of Minnesota Fishes of Wisconsin Identification Keys to Massachusetts Freshwater Fishes

92
Fish – trophic designations
Piscivore Herbivore Omnivore Insectivore Filter feeder Generalist Invertivore

93
Fish: index of biotic integrity
This index is a scientifically validated combination of measurements concerning fish communities in streams and rivers. The components of a typical fish IBI fall into three broad categories: fish species richness and abundance, food chain composition and reproductive function, and fish abundance and condition.

94
Fish: index of biotic integrity
An IBI is expressed as a single index value, based on the measurements of particular characteristics of the stream or river Because the rivers and streams are physically, chemically and biologically diverse, the measured characteristics are compared to specific reference values for the type and location of river or stream.

95
Fish: index of biotic integrity
IBI values range from 0 to 100. A low IBI value indicates the fish community is substantially different from a minimally disturbed stream in the same geographic area. A high IBI value indicates the fish community is similar to a minimally disturbed stream in the same geographic region

Similar presentations


 Emission rates SOURCES Concentrations in media (external dose) Emission.>")

 in the Lake Champlain basin would cause detrimental effects Determine the pathways.>")


 chemicals into the environment. Some examples are:>")


