Download presentation
Presentation is loading. Please wait.

1
International and Domestic Macro Comparisons Basic Performance Measures Winter 2001 - Economics 102 Mr. Smitka

2
GDP levels Y = C + I + G + X - M is our basic measure –Represents final demand total production thus also total income How does the US fare? –Income per capita? –Income growth?

3
Comparing GDP Internationally Growth rates can be directly compared Still, in the long run distortions arise Growth levels cannot be directly compared Prices vary a lot across national borders Exchange rates don’t solve this problem Forex rates aren’t set by trade Forex rates also can vary by 5% a week GDP clearly doesn’t rise and fall that rapidly!

4
PPP comparisons Instead of using nominal GDP data and exchange rates a common set of prices must be constructed Output quantities in each country can then be used with such common “international” prices PPP (purchasing power parity) is the jargon
 is the jargon")
6
GDP per capita The US leads (except for tiny Luxembourg) The EU is about 75% of the US level –Developed Asia is similar (Japan, Australia, NZ) –Iberia & Greece are at a bit lower The developing world has far lower output –And according far lower incomes –The citizens of Mexico, Turkey & Poland receive only 25% the average income of the US –The rest of the world is poorer, often much poorer
 The EU is about 75% of the US level –Developed Asia is similar (Japan, Australia, NZ) –Iberia & Greece are at a bit lower The developing world has far lower output –And according far lower incomes –The citizens of Mexico, Turkey & Poland receive only 25% the average income of the US –The rest of the world is poorer, often much poorer")
9
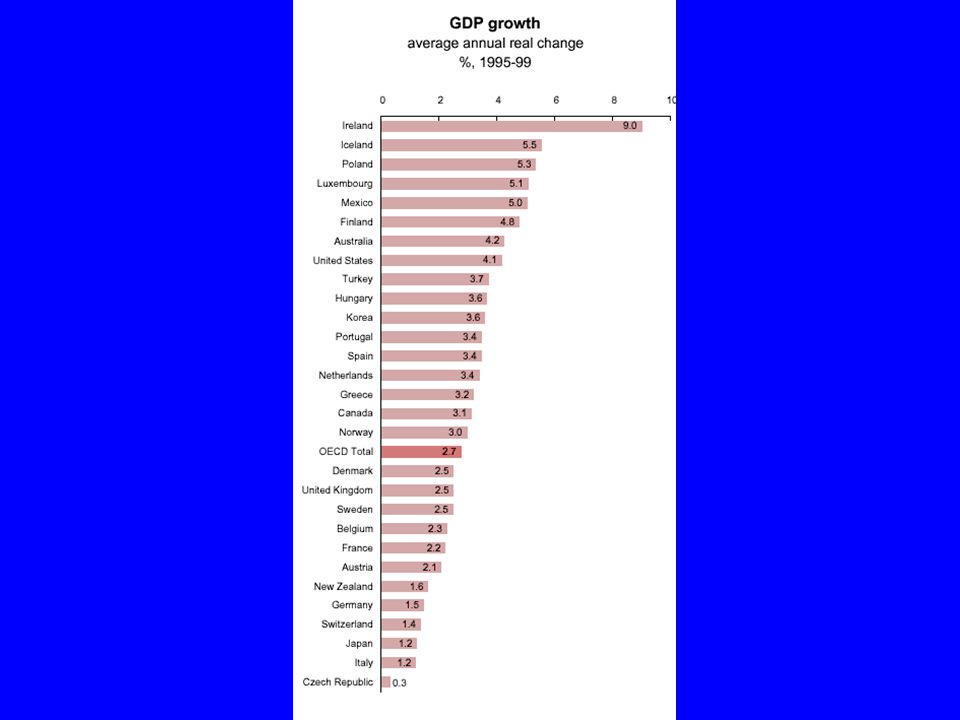
US Growth is strong, too US real growth - 4.1% pa - is well above average The EU grew slowly --Italy, Germany, France, the UK - except for Spain Japan in fact did worse in 1990-99 as a whole (and Korea did better) Ireland is the star -- a nice paper topic: why??
 Ireland is the star -- a nice paper topic: why")
11
US cyclical performance Postwar real GDP grew 3.5% pa Output thus doubled every 20 years... but short run growth... The post-WWII recession reflected an end to wartime I, not lower C The Great Depression remains anomalous –… thankfully!! –but such crises afflicted many developing countries

13
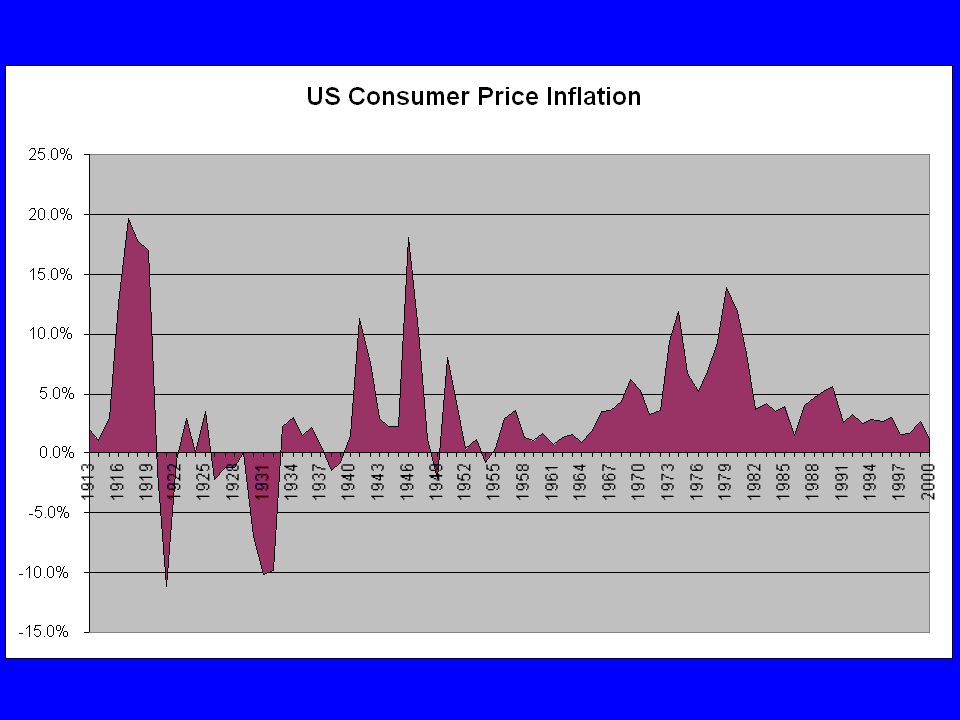
Inflation Mild since the Civil War Clear bouts associated with –WWI –WWII –Korean War –Vietnam War –1st & 2nd Oil Crises

16
Growth & Inflation?! Periods of sustained growth often are accompanied by rising inflation –1954-57 – 1964-69 –1971-73– 1976-79 But not booms in the late 1980s and 1990s –other factors matter! –plus the time lag varies!

18
OECD Inflation Comparisons US inflation is not high, but not low Japan is very different - deflation!! Mexican inflation rates are high if continued prices double in 6 years No country suffers hyperinflation Linked to war or political breakdown - Russia (USSR “transition”) - some LDCs - Weimar Germany
 - some LDCs - Weimar Germany.")
20
Inflation composition Prices move in different directions for different goods Energy has been very volatile, up and down Food prices also bounce around a lot –Still, focusing on “core” inflation (non-food, non-energy) can be misleading...
 can be misleading...")
24
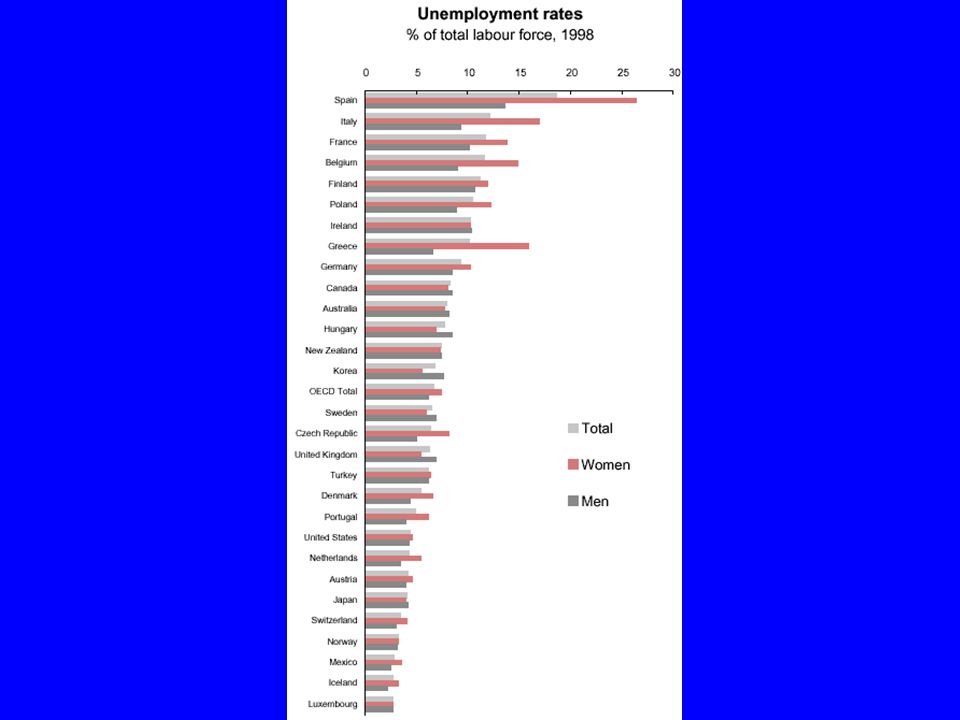
Unemployment During the last 20-odd years: European U is high Japanese U is low US is moderate Long-term unemployment also varies ∑ economic structure matters As do details of definitions of U and data collection

26
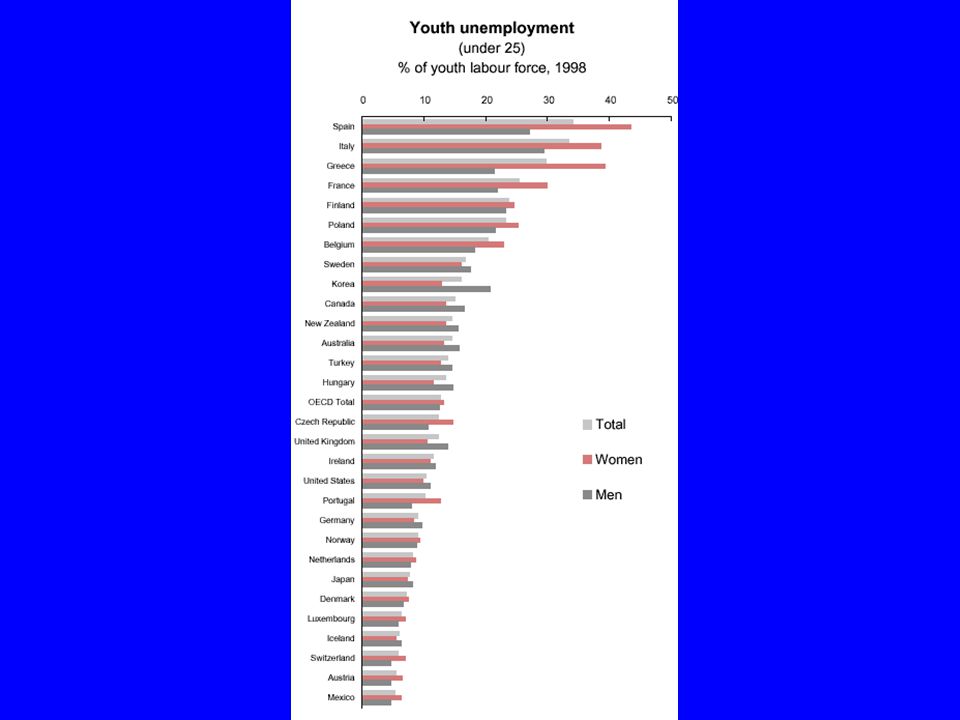
Women & youth Women generally suffer more U Youth suffer much higher U In the US male youth U is high - not female Such male youth U is geographically based It also correlates closely with crime

28
Unemployment variation It correlates with growth (surprise?!) Cyclical factors are not the only influence Hence we distinguish: –Cyclical U –Structural U –Frictional U
 Cyclical factors are not the only influence Hence we distinguish: –Cyclical U –Structural U –Frictional U")
30
Causation A sharp drop in investment –“causes” higher U with a lag –“causes” lower Y growth with a lag Y growth and U are more simultaneous The relationship is clearly complex, and is affected by other factors

31
Causation So what “causes” variability “cause” is in parentheses for now -- it merely indicates statistical correlation A starting point: how do the elements of GDP vary As share of GDP In terms of growth rates

33
Shares of GDP Consumption is large but steady –Some variation, and since large need to detail –In fact, the puzzle is stability, not variation! Government is even steadier –A one-time change with Korea & Cold War –Secular shift from Federal to State & Local –See next slide….

35
Trade One major shift: trade –4% of Y in 1950s –8% in 1973 with oil crisis –12%-14% today Net trade –Remains smallish –Shift from small surplus to 3 + % deficit –Some variability, too

37
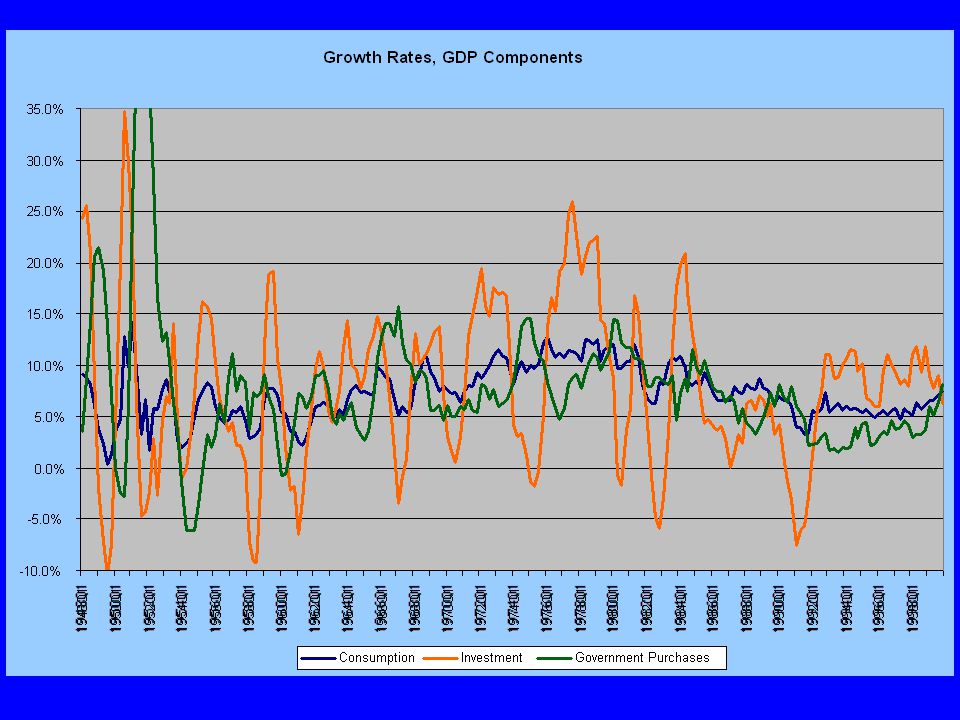
Investment Far more volatile than C or G –C & G are larger, but I is still 1/6th of GDP I is the proximate cause of business cycles –See charts following… –We’ll also see that shifts in I are amplified What parts of I vary? –Business fixed investment –Residential (housing)
.")
38
Why the business cycle? Why does C not vary? Life cycle models Why does housing investment vary? Interest rates shift mortgage costs Why does business investment vary? “Animal spirits” (Keynes) Net trade? -- some impact of interest rates Government -- fiscal policy (taxing & spending) not central
 Net trade. -- some impact of interest rates Government -- fiscal policy (taxing & spending) not central.")
42
Factors Driving Business Cycles All components of GDP shift over time C is the largest component –It however tracks GDP (= national income) –Indeed, the puzzle is why is it so stable? G varies primarily with war –Also long-run shift from Federal to State/local –Not a source of the business cycle

43
Investment Investment is by far the most volatile item –At 1/6th of GDP, big enough to matter –Residential investment volative Interest rates affect it –Business plant & equipment investment Keynes’ “animal spirits” affect it Net trade now sometimes matters Interest rates shift forex, shifting levels

45
Contribution Graph In the previous graph, dark blue line is GDP Bar graphs reflect contribution to change in GDP growth –Portions below 0 are slowing growth –Portions above 0 add to growth Drops in investment drive recessions –Net trade declines contribute, too

46
Conclusions We are left with questions / hypotheses –Why does investment vary? –Why doesn’t consumption vary? –How strong / constant is the link between declines in growth and unemployment? –What is the link between growth and inflation? Why do long-run growth / U etc vary across countries?

Similar presentations