Download presentation
Presentation is loading. Please wait.

1
Climate Tools & Data

2
Note: This slide set is one of several that were presented at climate training workshops in 2014. Please visit the SCIPP Documents page in the Resources tab on the SCIPP’s website, www.southernclimate.org, for slide sets on additional topics. www.southernclimate.org Workshop funding was provided by the NOAA Regional Integrated Sciences and Assessments program.

3
Why use climate data? Provides physical evidence of what climate was like before we were born or can remember. Observations do not change whereas our memory of particular events or time periods might change. Can provide supporting material that is required for a project report, grant application, legal proceeding, etc. A way to measure past events.

4
See Tools & Data handout for URLs.

5
Past Conditions Climatological Tools

6
Already Mentioned PRISM Climate Maps (PRISM Climate Group, Oregon State) Historical Climate Trends Tool (SCIPP)
 Historical Climate Trends Tool (SCIPP)")
7
Average Monthly Temperature and Precipitation Tool (SCIPP) Description: This tool displays information on how a particular year’s monthly temperature or precipitation records compare to normal (i.e., 30- year average for the period 1981-2010.)
 Description: This tool displays information on how a particular year’s monthly temperature or precipitation records compare to normal (i.e., 30- year average for the period )")
8
Oklahoma Climate Divisions

9
How to use it Choose a State Oklahoma Climate Division 3 Year 2014

10
Example Applications of the Tool Determine if your area is behind or ahead on rainfall and the impact that could have on water quantity and quality. Temperatures can also impact water quantity and quality. Potential for algal blooms. A rainfall deficit leads to drier vegetation and drought development. Determine if past months and years of perceived significance were actually significant. Example: Was summer 2007 as wet as I think it was? Rain-soaked farmland in June 2007. Source: ARM Climate Research Facility

11
Southern U.S. Drought Tool (SCIPP) Description Displays information on drought severity and the amount of precipitation needed to get out of drought. Useful for understanding precipitation deficits, or lack thereof, over a relatively short period of time (365 days or less). Users can view precipitation statistics by climate division.
 Description Displays information on drought severity and the amount of precipitation needed to get out of drought. Useful for understanding precipitation deficits, or lack thereof, over a relatively short period of time (365 days or less). Users can view precipitation statistics by climate division..")
12
How to use it

13
Global Climate Dashboard (NOAA) Description: Interactive display gives viewer a look at global climate conditions over different periods of time such as temperature, carbon dioxide, spring snow cover, sea level, arctic sea ice and more.
 Description: Interactive display gives viewer a look at global climate conditions over different periods of time such as temperature, carbon dioxide, spring snow cover, sea level, arctic sea ice and more.")
15
Drought Risk Atlas (NDMC) Purpose: To provide “a wide range of decision makers with historical drought information and a web-based tool to visualize and assess their risk to drought.” (NDMC)
 Purpose: To provide a wide range of decision makers with historical drought information and a web-based tool to visualize and assess their risk to drought. (NDMC)")
16
Drought Risk Atlas (NDMC) Applications of the tool: Compare a current or past drought to another past drought (e.g., How did the 2010-current drought compare to the drought during the Dust Bowl?). Can view the U.S. Drought Monitor and other drought indices such as PDSI, SPI, etc. Dusty cotton field in Texas, March 2014. Source: Tim Benson Farm in Texas Panhandle during Dust Bowl. Source: Library of Congress, Farm Security Administration-Office of War Information Collection.

17
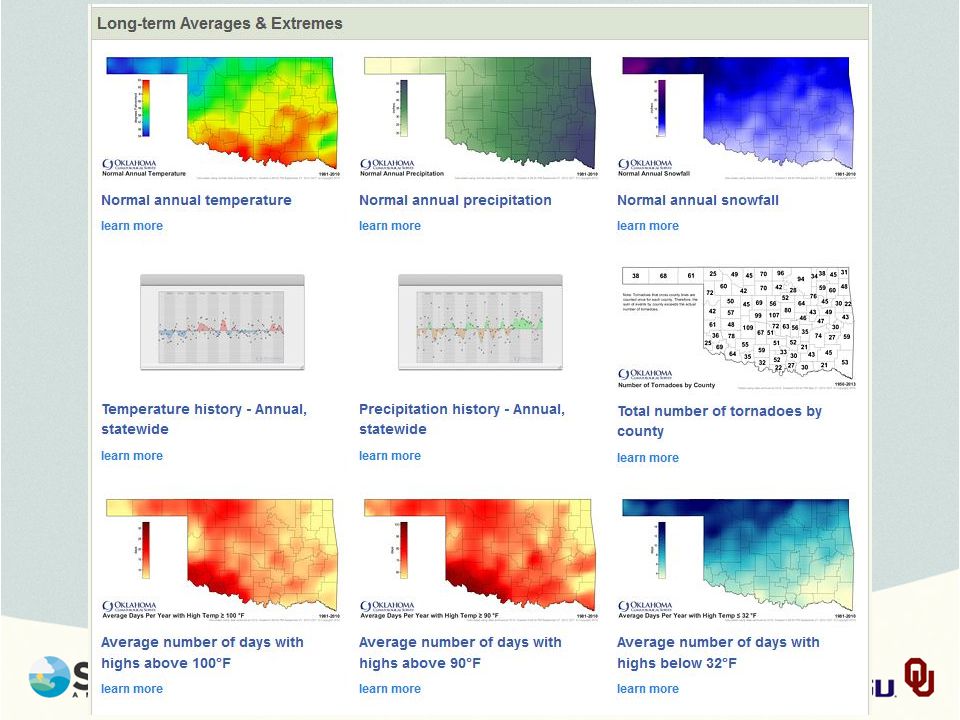
Oklahoma’s Climate: Long-Term Averages and Extremes (OCS) Description: Maps and graphs that provide long-term data on temperature, precipitation, snowfall, tornadoes, etc. for Oklahoma.

20
Weather Observation Networks ASOS – Automated Surface Observing System The nation’s primary surface weather observing network. A joint effort between the National Weather Service, Federal Aviation Administration, and Department of Defense. Operates 24/7, 365 days per year. NOAA

21
Weather Observation Networks COOP (Pronounced “co-op”) – NWS Cooperative Observer Program Program dates back to 1870. Consists of almost 11,000 volunteers across the nation. Daily max/min temperature, snowfall, and 24-hour precipitation totals. NWS

22
Weather Observation Networks Cocorahs – Community Collaborative Rain, Hail & Snow Network “Volunteers working together to measure precipitation across the nation.” Established in 1998. Precipitation record.

23
Current Conditions Monitoring Tools

24
Already Mentioned U.S. Drought Monitor (NDMC) Heat Index and Wind Chill Charts (NWS)
 Heat Index and Wind Chill Charts (NWS)")
25
Oklahoma Mesonet - Oklahoma Weather Observation Network

26
The Oklahoma Mesonet app is FREE! Content goes here List item 1 List item 2 List item 3

27
Other useful mobile apps: iMap Weather Radio ($10) Pushes NWS weather alerts to your phone like a NOAA weather radio. Both sold by Weather Decision Technologies in Norman, OK RadarScope ($10) Specialized high resolution radar data and derived products for the entire country.
 Specialized high resolution radar data and derived products for the entire country..")
28
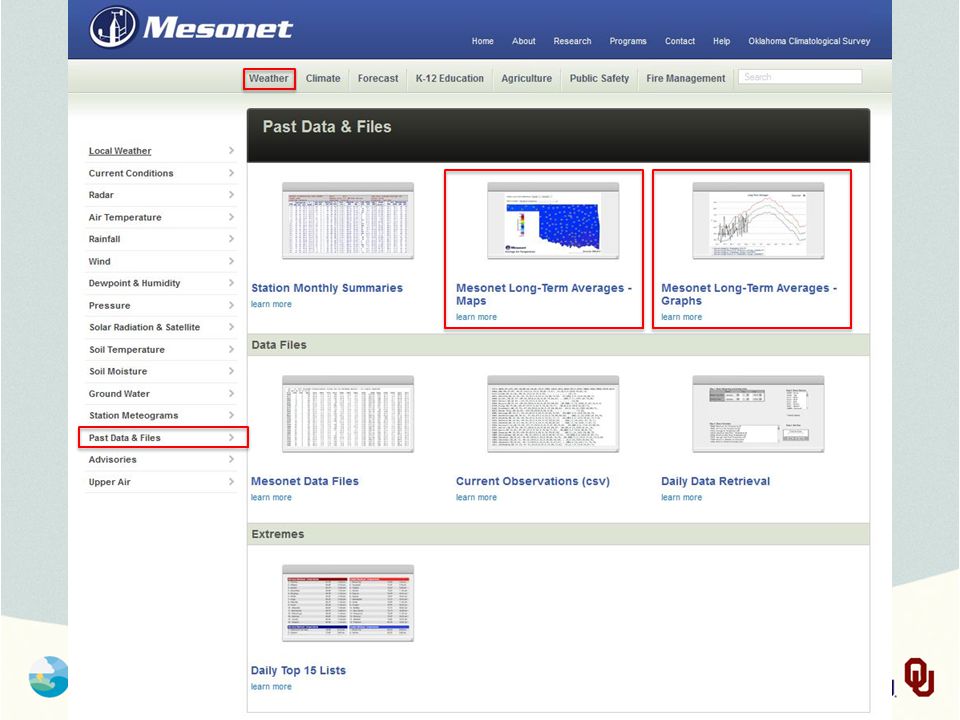
Oklahoma Mesonet Basic weather information such as temperature, precipitation, winds, and dewpoint, etc. Maps and graphs. Some climatological information.

31
Burning Index (Fire Conditions) The Burning Index (BI) represents potential fire conditions in response to short term meteorological factors such as temperature, relative humidity, wind speed, and solar radiation. A satellite measure of vegetative health (greenness) and a fuel model for native vegetation are also incorporated. The BI infers fire line intensity and flame length. The higher the number, the more difficult it is to fight a wildfire.
 and a fuel model for native vegetation are also incorporated. The BI infers fire line intensity and flame length. The higher the number, the more difficult it is to fight a wildfire..")
32
Burning Index Legend

33
River Forecast Center Products (NWS) Description: Provides flood observation and forecast data.
 Description: Provides flood observation and forecast data.")
34
How to use it

35
Legend

36
Future Conditions Forecasting Tools

37
Already Mentioned SPIA Index

38
Climate Prediction Center Outlooks (NWS) Description: Users can obtain temperature and precipitation outlooks for seasonal timescales, as well as drought outlooks.
 Description: Users can obtain temperature and precipitation outlooks for seasonal timescales, as well as drought outlooks.")
39
Example: One Month Outlook - Precipitation Probability of above or below average precipitation during the period (e.g., July 2014). Keep lead time and forecast period in mind when interpreting. “EC” does not mean normal/average!

40
Example: Three Month Outlook - Temperature Probability of above or below average temperatures during the period (e.g., July-August-Sept). Keep lead time and forecast period in mind when interpreting. “EC” does not mean normal/average!

41
Uses of CPC Seasonal Outlooks Temperature and precipitation outlooks can be monitored for determining whether drought conditions may persist. Example: A chance of above normal temperatures coupled with below normal rainfall could lead to drought intensification. Example: A chance of below normal temperatures coupled with normal rainfall could lead to less evaporation.

42
Example: Seasonal Drought Outlook A forecast for whether drought will improve or get worse. Keep forecast period in mind when interpreting.

43
Questions?

Similar presentations


 Winter Weather Forecast Conference OMSI / Oregon Chapter of the AMS 29 October 2011 Winter Weather Forecast Conference OMSI.>")

